SVI Infographics and Choropleth Map
Introduction
Rates of social vulnerability in the Middle Atlantic Division closely mirror national rates. A few notable exceptions are the increased rates of individuals who live in multi-unit housing and lack access to transportation. This is likely due to the existence of several major cities in the division including New York City and Philadelphia. In contrast, the division has a higher rate of individuals with health insurance indicating a diversion in local trends from national rates.
From 2010 to 2020 most rates remained fairly steady in the division, with the exception of individuals who were classified as housing-cost burdened which decreased by 5%, adults without a high school diploma decreased by 3% and in accordance with the passing of the Affordable Care Act in March 2010 (HealthCare.gov, n.d.), individuals with a lack of health insurance decreased by 5%.
Data
| division | year | pct in poverty | pct not in poverty | pct unemployed | pct employed | pct housing cost-burdened | pct not housing cost-burdened | pct adults without high school diploma | pct adults with high school diploma | pct age 17 & under | pct age 18-64 | pct age 65+ | pct single parent families | pct other families | pct limited English speakers | pct proficient English speakers | pct Minority race/ethnicity | pct Non-Hispanic White race/ethnicity | pct in multi-unit housing | pct in mobile housing | pct in other housing | pct in crowded living spaces | pct in non-crowded living spaces | pct with no vehicle access | pct with vehicle access | pct in group living quarters | pct not in group living quarters | pct without health insurance | pct with health insurance | pct disabled civilians | pct not disabled civilians |
|---|---|---|---|---|---|---|---|---|---|---|---|---|---|---|---|---|---|---|---|---|---|---|---|---|---|---|---|---|---|---|---|
| United States | 2010 | 23 | 77 | 8 | 92 | 36 | 64 | 15 | 85 | 24 | 63 | 13 | 17 | 83 | 5 | 95 | 35 | 65 | 13 | 7 | 80 | 3 | 97 | 9 | 91 | 3 | 97 | 15 | 85 | 15 | 85 |
| Middle Atlantic Division | 2010 | 20 | 80 | 8 | 92 | 39 | 61 | 14 | 86 | 23 | 63 | 14 | 16 | 84 | 5 | 95 | 34 | 66 | 18 | 3 | 79 | 3 | 97 | 19 | 81 | 3 | 97 | 11 | 89 | 14 | 86 |
| United States | 2020 | 21 | 79 | 5 | 95 | 30 | 70 | 11 | 89 | 22 | 62 | 16 | 16 | 84 | 4 | 96 | 40 | 60 | 14 | 6 | 80 | 3 | 97 | 8 | 92 | 2 | 98 | 9 | 91 | 15 | 85 |
| Middle Atlantic Division | 2020 | 19 | 81 | 6 | 94 | 34 | 66 | 11 | 89 | 21 | 62 | 17 | 15 | 85 | 5 | 95 | 39 | 61 | 20 | 2 | 78 | 4 | 96 | 19 | 81 | 3 | 97 | 6 | 94 | 14 | 86 |
Socieconomic Status Infographics
Poverty in the Middle Atantic Division is 3% less than national trends in 2010 and drops slightly to a rate of 2% less in 2020.
Unemployment rates are identical to national trends in 2010 and follow the drop in 2020. NY, NJ, and PA maintain higher rates of housing cost burdens over the decade.
While the division has slightly less adults without a high school diploma in 2010, there is no diversion from national trends in 2020.
Better-than-national health insurance coverage trends persist across the decade.

Household Characteristics Infographics
The Middle Atlantic Division has an older population compared to national trends in 2010 and 2020. Across the decade the population continues to age in accordance with similar national population shifts.
Nationally and divisionally, the disabled population remains stable. Family types also remain similar across the decade per Census definitions.
While English language proficiency increased by 1% nationally, the Middle Atlantic Division did not experience any changes.

Racial and Ethnic Minority Status Infographics
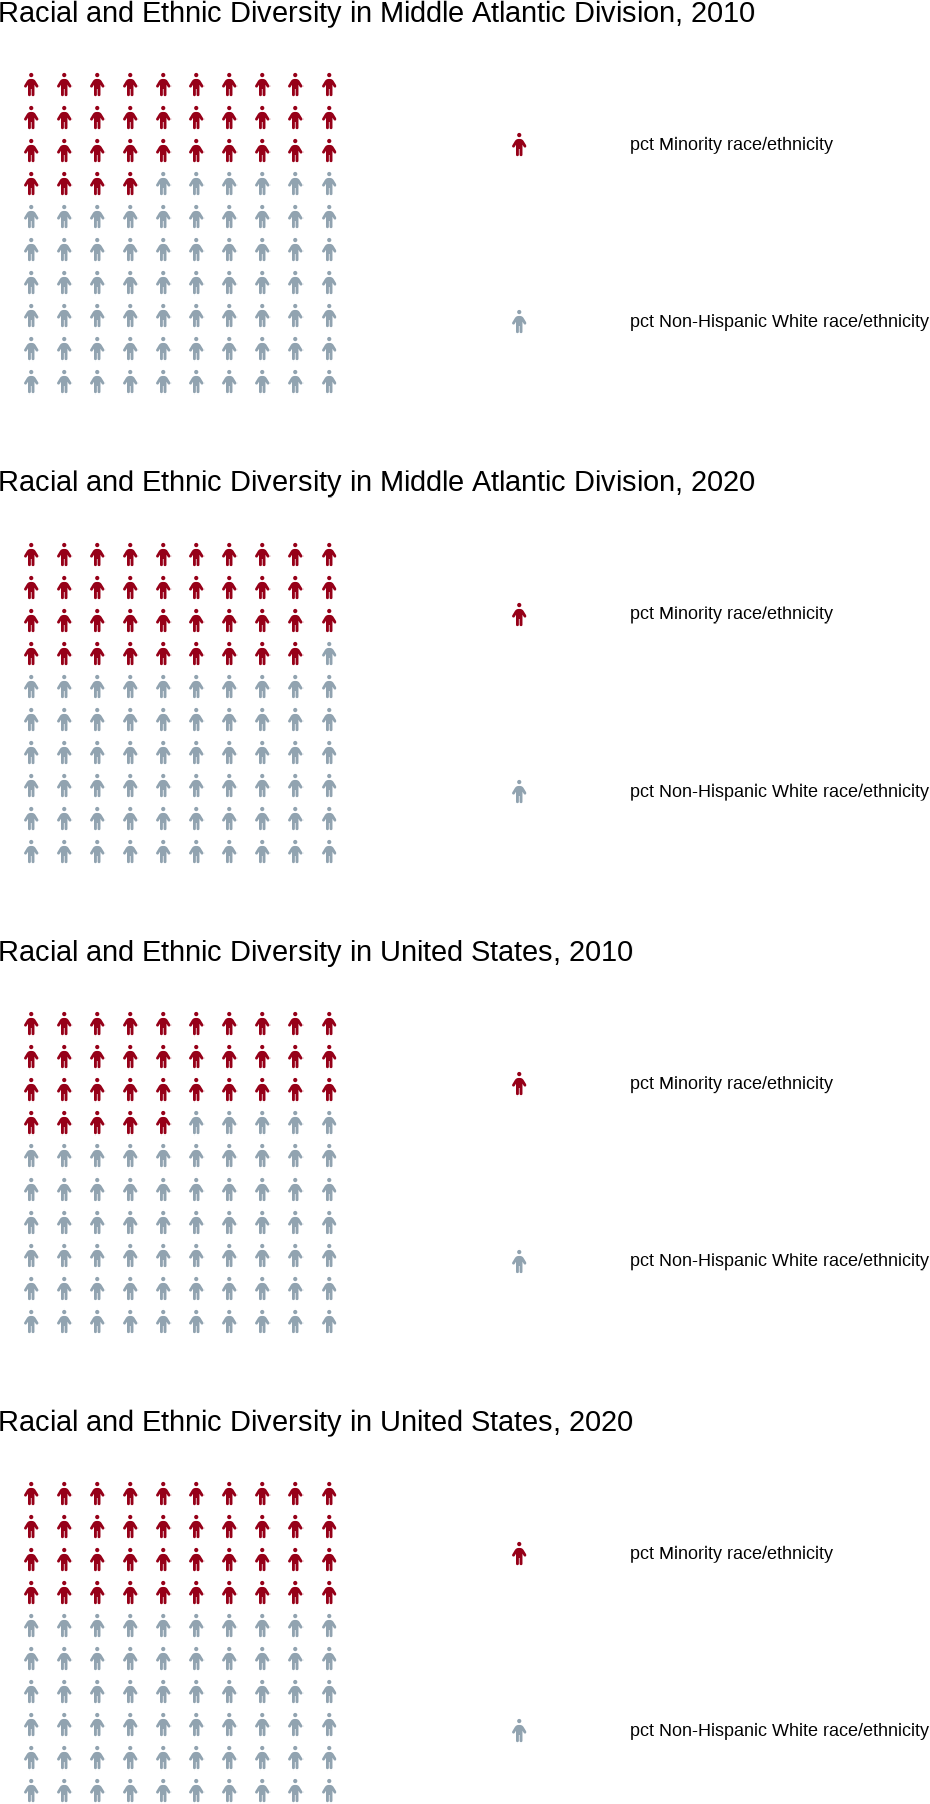
Racial and Ethnic diversity increased in the Middle Atlantic Division from 2010 to 2020 at similar rates to the national trends. This is likely influenced by the large cultural diversity within the cities in the division and their impact on national diversity.

Housing Type and Transportation Infographics
Mobile Housing rates decreased in the Middle Atlantic Division from 2010 to 2020 while Multi-Unit Housing increased. Mobile housing rates remained far below national percentage trends while Multi-Unit Housing rates remained above the national trends.

2010 SVI Flag to Population Ratio Map
In 2010, the Middle Atlantic Division’s social vulnerability index (SVI) flag counts relative to population sizes of 1,000 indicated high rates of vulnerability in urban Philadelphia County, PA, rural Northwestern PA, former factory and coal country in Luzerne County, PA, Southern NJ, the greater New York City area, and rural counties around the Adirondack Mountains in New York, including Hamilton County which lacks traffic lights throughout the entire county and has very limited cell phone service (New York State, n.d.; Russell, 2022; Wikipedia, n.d.).
2020 SVI Flag to Population Ratio Map
In 2020 there are some shifts in SVI with some counties such as Union County, NJ, Crawford County, PA, and Monroe County, NY experiencing lower levels of vulnerability compared to 2020. However the general spatial trends of areas of vulnerability persists.