NMTC and LIHTC Evaluation
Introduction
The differences-in-differences model (sometimes called diff-in-diff or DiD) is a regression model that studies the difference in trends over time between a treatment group and a control group. The DiD model’s most important assumption is that, without treatment, trends in the treatment group would be similar to trends in the control group. This is how the counterfactual and program effect are established and calculated. Figarri Kiesha’s DiD diagram (2022) visualizes this.

So why use the DiD model? Studying how two tax programs affect social vulnerability is complicated by many factors. The DiD model controls for observed and unobserved time-invariant characteristics, or factors that consistently influence the data over time (Gertler et. al, 2016, p. 134). Additionally, we have data that we can study before and after the inventions of the NMTC and LIHTC programs. The data also contains information for counties that were eligible for the tax credit programs but received no project funding. These counties serve as a similar control group and will help to create the counterfactual.
Dependent Variables
This report uses several DiD models to understand the impact of the tax credit programs on social vulnerability, median income, median home value, and the house price index. These four variables will serve as the dependent (or outcome) variables. We use these variables because they overlap with the tax credit programs’ purpose to invest in affordable housing to benefit low-income households and community development to benefit disadvantaged neighborhoods. It’s reasonable to expect that these investments could improve SVI and median income. Because the NMTC targets neighborhoods, we expect to see home value increase.
dep_vars %>%
  kbl() %>%
  kable_styling(bootstrap_options = c("striped", "hover"))
| Variable | Description |
|---|---|
| Social Vulnerability Index (SVI) | An index that measures 16 demographic and socioeconomic variables to understand a community’s risk to hazards |
| Median income | The average income at which half of residents earn below and half of residents earn above |
| Median home value | The average home price at which half of listings are listed below and half of listings are listed above |
| House Price Index (HPI) | An index that measures "average price changes in repeat sales or refinancings on the same properties" (FHFA, 2025) |
Independent Variables
The New Markets Tax Credit (NMTC) Program “incentivizes community development and economic growth through the use of tax credits that attract private investment to distressed communities” (U.S. Department of the Treasury, 2025). The data includes variables about project awards (in dollars), the number of projects, geography, and more. Because it includes geographic data, we can pair the NMTC data with other data, specifically from the American Community Survey.
The Low-Income Housing Tax Credit (LIHTC) Program allows authorized agencies to “issue tax credits for the acquisition, rehabilitation, or new construction of rental housing targeted to lower-income households” (U.S. Department of Housing and Urban Development, 2025). Like the NMTC, the LIHTC data includes variables about project awards (in dollars), the number of projects, and geography, which makes it useful for pairing with ACS data.
Library
# Load packages
library(here)         # relative filepaths for reproducibility
library(rio)          # read excel file from URL
library(tidyverse)    # data wrangling
library(stringi)      # string data wrangling
library(tidycensus)   # US census data
library(ggplot2)      # data visualization
library(scales)       # palette and number formatting
library(unhcrthemes)  # data visualization themes
library(ggrepel)      # data visualization formatting to avoid overlapping
library(rcompanion)   # data visualization of variable distribution
library(ggpubr)       # data visualization of variable distribution
library(moments)      # measures of skewness and kurtosis
library(tinytable)    # format regression tables
library(modelsummary) # format regression tables
Load Functions
import::here( "fips_census_regions",
              "load_svi_data",
              "merge_svi_data",
              "census_division",
              "slopegraph_plot",
              "census_pull",
             # notice the use of here::here() that points to the .R file
             # where all these R objects are created
             .from = here::here("analysis/project_data_steps_Jazzy.R"),
             .character_only = TRUE)
# Load API key, assign to TidyCensus Package
source(here::here("analysis/password.R"))
census_api_key(.census_api_key)
## To install your API key for use in future sessions, run this function with `install = TRUE`.
Data
# Load NMTC AND LIHTC data sets
svi_divisional_nmtc <- readRDS(here::here(paste0("data/wrangling/", str_replace_all(census_division, " ", "_"), "_svi_divisional_nmtc.rds")))

svi_national_nmtc <- readRDS(here::here(paste0("data/wrangling/", str_replace_all(census_division, " ", "_"), "_svi_national_nmtc.rds")))

svi_divisional_lihtc <- readRDS(here::here(paste0("data/wrangling/", str_replace_all(census_division, " ", "_"), "_svi_divisional_lihtc.rds")))

svi_national_lihtc <- readRDS(here::here(paste0("data/wrangling/", str_replace_all(census_division, " ", "_"), "_svi_national_lihtc.rds")))
House Price Index Data
hpi_df <- read.csv("https://r-class.github.io/paf-515-course-materials/data/raw/HPI/HPI_AT_BDL_tract.csv")

hpi_df_10_20 <- hpi_df %>%
  mutate(GEOID10 = str_pad(tract, 11, "left", pad=0)) %>%
  filter(year %in% c(2010, 2020))  %>%
 select(GEOID10, state_abbr, year, hpi) %>%
  pivot_wider(names_from = year, values_from = hpi) %>%
  mutate(housing_price_index10 = `2010`,
         housing_price_index20 = `2020`) %>%
  select(GEOID10, state_abbr, housing_price_index10, housing_price_index20)

# View data
hpi_df_10_20 %>% head() %>% kbl() %>% kable_styling() %>% scroll_box(width = "100%")
| GEOID10 | state_abbr | housing_price_index10 | housing_price_index20 |
|---|---|---|---|
| 01001020100 | AL | 132.35 | 152.78 |
| 01001020200 | AL | 123.78 | 123.37 |
| 01001020300 | AL | 158.57 | 167.01 |
| 01001020400 | AL | 165.11 | 179.60 |
| 01001020501 | AL | 172.55 | 180.96 |
| 01001020502 | AL | 158.75 | 164.25 |
# Drop state_abbr column for joining
hpi_df_10_20 <- hpi_df_10_20 %>% select(-state_abbr)
CBSA Crosswalk Data
msa_csa_crosswalk <- rio::import("https://r-class.github.io/paf-515-course-materials/data/raw/CSA_MSA_Crosswalk/qcew-county-msa-csa-crosswalk.xlsx", which=4)

msa_csa_crosswalk <- msa_csa_crosswalk %>%
  mutate(county_fips = str_pad(`County Code`, 5, "left", pad=0),
         cbsa = coalesce(`CSA Title`, `MSA Title`),
         cbsa_code = coalesce(`CSA Code`, `MSA Code`),
         county_title = `County Title`)  %>%
  select(county_fips, county_title, cbsa, cbsa_code)

msa_csa_crosswalk %>% head() %>% kbl() %>% kable_styling() %>% scroll_box(width = "100%")
| county_fips | county_title | cbsa | cbsa_code |
|---|---|---|---|
| 01001 | Autauga County, Alabama | Montgomery-Alexander City, AL CSA | CS388 |
| 01003 | Baldwin County, Alabama | Mobile-Daphne-Fairhope, AL CSA | CS380 |
| 01005 | Barbour County, Alabama | Eufaula, AL-GA MicroSA | C2164 |
| 01007 | Bibb County, Alabama | Birmingham-Hoover-Cullman, AL CSA | CS142 |
| 01009 | Blount County, Alabama | Birmingham-Hoover-Cullman, AL CSA | CS142 |
| 01015 | Calhoun County, Alabama | Anniston-Oxford, AL MSA | C1150 |
Census Data
states <- list(svi_national_nmtc$state %>% unique())
states
## [[1]]
##  [1] "AL" "AK" "AZ" "AR" "CA" "CO" "CT" "DE" "DC" "FL" "GA" "HI" "ID" "IL" "IN"
## [16] "IA" "KS" "KY" "LA" "ME" "MD" "MA" "MI" "MN" "MS" "MO" "MT" "NE" "NV" "NH"
## [31] "NJ" "NM" "NY" "NC" "ND" "OH" "OK" "OR" "PA" "RI" "SC" "SD" "TN" "TX" "UT"
## [46] "VT" "VA" "WA" "WV" "WI" "WY"
census_pull10 <- lapply(states, census_pull, yr = 2010)

census_pull10_df <- census_pull10[[1]] %>%
  # Drop margin of error column
  select(-moe) %>%
  # Add suffix to variable names
  mutate(variable = paste0(variable, "_10")) %>%
  # Pivot data frame
  pivot_wider(
    names_from = variable,
    values_from = c(estimate)
  )

census_pull10_df %>% head(10) %>% kbl() %>% kable_styling() %>% scroll_box(width = "100%")
| GEOID | NAME | Median_Income_10 | Median_Home_Value_10 |
|---|---|---|---|
| 01001020100 | Census Tract 201, Autauga County, Alabama | 31769 | 120700 |
| 01001020200 | Census Tract 202, Autauga County, Alabama | 19437 | 138500 |
| 01001020300 | Census Tract 203, Autauga County, Alabama | 24146 | 111300 |
| 01001020400 | Census Tract 204, Autauga County, Alabama | 27735 | 126300 |
| 01001020500 | Census Tract 205, Autauga County, Alabama | 35517 | 173000 |
| 01001020600 | Census Tract 206, Autauga County, Alabama | 24597 | 110700 |
| 01001020700 | Census Tract 207, Autauga County, Alabama | 22114 | 93800 |
| 01001020801 | Census Tract 208.01, Autauga County, Alabama | 30841 | 258000 |
| 01001020802 | Census Tract 208.02, Autauga County, Alabama | 29006 | 145100 |
| 01001020900 | Census Tract 209, Autauga County, Alabama | 24841 | 108000 |
census_pull19 <- lapply(states, census_pull, yr = 2019)

census_pull19_df <- census_pull19[[1]] %>%
  # Select columns
  select(GEOID, NAME, variable, estimate, moe) %>%
  # Create individual FIPS columns for state, county, and tract
  mutate(FIPS_st = substr(GEOID, 1, 2),
         FIPS_county = substr(GEOID, 3, 5),
         FIPS_tract = substr(GEOID, 6, 11)) %>%
# Los Angeles, CA Census Tract fixes
                      mutate(FIPS_tract2 = if_else((FIPS_county == "037" & FIPS_st == "06" & FIPS_tract == "137000"), "930401", FIPS_tract )) %>%
# Pima County, AZ Census Tract fixes
                      mutate(FIPS_tract2 = if_else((FIPS_county == "019" & FIPS_st == "04" & FIPS_tract == "002704"), "002701", FIPS_tract2 )) %>%
                      mutate(FIPS_tract2 = if_else((FIPS_county == "019" & FIPS_st == "04" & FIPS_tract == "002906"), "002903", FIPS_tract2 )) %>%
                      mutate(FIPS_tract2 = if_else((FIPS_county == "019" & FIPS_st == "04" & FIPS_tract == "004118"), "410501", FIPS_tract2 )) %>%
                      mutate(FIPS_tract2 = if_else((FIPS_county == "019" & FIPS_st == "04" & FIPS_tract == "004121"), "410502", FIPS_tract2 )) %>%
                      mutate(FIPS_tract2 = if_else((FIPS_county == "019" & FIPS_st == "04" & FIPS_tract == "004125"), "410503", FIPS_tract2 )) %>%
                      mutate(FIPS_tract2 = if_else((FIPS_county == "019" & FIPS_st == "04" & FIPS_tract == "005200"), "470400", FIPS_tract2 )) %>%
                      mutate(FIPS_tract2 = if_else((FIPS_county == "019" & FIPS_st == "04" & FIPS_tract == "005300"), "470500", FIPS_tract2 )) %>%
# Madison County, NY Census Tract fixes
                      mutate(FIPS_tract2 = if_else((FIPS_county == "053" & FIPS_st == "36" & FIPS_tract == "030101"), "940101", FIPS_tract2 )) %>%
                      mutate(FIPS_tract2 = if_else((FIPS_county == "053" & FIPS_st == "36" & FIPS_tract == "030102"), "940102", FIPS_tract2 )) %>%
                      mutate(FIPS_tract2 = if_else((FIPS_county == "053" & FIPS_st == "36" & FIPS_tract == "030103"), "940103", FIPS_tract2 )) %>%
                      mutate(FIPS_tract2 = if_else((FIPS_county == "053" & FIPS_st == "36" & FIPS_tract == "030200"), "940200", FIPS_tract2 )) %>%
                      mutate(FIPS_tract2 = if_else((FIPS_county == "053" & FIPS_st == "36" & FIPS_tract == "030300"), "940300", FIPS_tract2 )) %>%
                      mutate(FIPS_tract2 = if_else((FIPS_county == "053" & FIPS_st == "36" & FIPS_tract == "030401"), "940401", FIPS_tract2 )) %>%
                      mutate(FIPS_tract2 = if_else((FIPS_county == "053" & FIPS_st == "36" & FIPS_tract == "030403"), "940403", FIPS_tract2 )) %>%
                      mutate(FIPS_tract2 = if_else((FIPS_county == "053" & FIPS_st == "36" & FIPS_tract == "030600"), "940600", FIPS_tract2 )) %>%
                      mutate(FIPS_tract2 = if_else((FIPS_county == "053" & FIPS_st == "36" & FIPS_tract == "030402"), "940700", FIPS_tract2 )) %>%
# Oneida County, NY Census Tract fixes
                      mutate(FIPS_tract2 = if_else((FIPS_county == "065" & FIPS_st == "36" & FIPS_tract == "024800"), "940000", FIPS_tract2 )) %>%
                      mutate(FIPS_tract2 = if_else((FIPS_county == "065" & FIPS_st == "36" & FIPS_tract == "024700"), "940100", FIPS_tract2 )) %>%
                      mutate(FIPS_tract2 = if_else((FIPS_county == "065" & FIPS_st == "36" & FIPS_tract == "024900"), "940200", FIPS_tract2 )) %>%
                      # Move columns in data set
                      relocate(c(FIPS_st, FIPS_county, FIPS_tract, FIPS_tract2),.after = GEOID) %>%
                      # Create new GEOID column
                      mutate(GEOID = paste0(FIPS_st, FIPS_county, FIPS_tract2)) %>%
                      # Drop newly created FIPS columns and margin of error
                      select(-FIPS_st, -FIPS_county, -FIPS_tract, -FIPS_tract2, -moe) %>%
                      # Add suffix
                      mutate(variable = paste0(variable, "_19")) %>%
                      # Pivot data set
                      pivot_wider(
                        names_from = variable,
                        values_from = c(estimate)
                      )

census_pull19_df %>% head(10) %>% kbl() %>% kable_styling() %>% scroll_box(width = "100%")
| GEOID | NAME | Median_Income_19 | Median_Home_Value_19 |
|---|---|---|---|
| 01001020100 | Census Tract 201, Autauga County, Alabama | 25970 | 136100 |
| 01001020200 | Census Tract 202, Autauga County, Alabama | 20154 | 90500 |
| 01001020300 | Census Tract 203, Autauga County, Alabama | 27383 | 122600 |
| 01001020400 | Census Tract 204, Autauga County, Alabama | 34620 | 152700 |
| 01001020500 | Census Tract 205, Autauga County, Alabama | 41178 | 186900 |
| 01001020600 | Census Tract 206, Autauga County, Alabama | 21146 | 103600 |
| 01001020700 | Census Tract 207, Autauga County, Alabama | 20934 | 82400 |
| 01001020801 | Census Tract 208.01, Autauga County, Alabama | 31667 | 322900 |
| 01001020802 | Census Tract 208.02, Autauga County, Alabama | 33086 | 171500 |
| 01001020900 | Census Tract 209, Autauga County, Alabama | 32677 | 156900 |
inflation_adj = 1.16

# Join 2010 and 2019 Median Income and Home Value Data
census_pull_df <- left_join(census_pull10_df, census_pull19_df[c("GEOID", "Median_Income_19", "Median_Home_Value_19")], join_by("GEOID" == "GEOID"))

# Create new inflation adjusted columns for 2010 median income and median home value, find changes over time
census_pull_df <- census_pull_df %>%
                   mutate(Median_Income_10adj = Median_Income_10*inflation_adj,
                          Median_Home_Value_10adj = Median_Home_Value_10*inflation_adj,
                          Median_Income_Change = Median_Income_19 - Median_Income_10adj,
                          Median_Income_Change_pct = (Median_Income_19 - Median_Income_10adj)/Median_Income_10adj,
                          Median_Home_Value_Change = Median_Home_Value_19 - Median_Home_Value_10adj,
                          Median_Home_Value_Change_pct = (Median_Home_Value_19 - Median_Home_Value_10adj)/Median_Home_Value_10adj)

# View data
census_pull_df %>% head(10) %>% kbl() %>% kable_styling() %>% scroll_box(width = "100%")
| GEOID | NAME | Median_Income_10 | Median_Home_Value_10 | Median_Income_19 | Median_Home_Value_19 | Median_Income_10adj | Median_Home_Value_10adj | Median_Income_Change | Median_Income_Change_pct | Median_Home_Value_Change | Median_Home_Value_Change_pct |
|---|---|---|---|---|---|---|---|---|---|---|---|
| 01001020100 | Census Tract 201, Autauga County, Alabama | 31769 | 120700 | 25970 | 136100 | 36852.04 | 140012 | -10882.04 | -0.2952900 | -3912 | -0.0279405 |
| 01001020200 | Census Tract 202, Autauga County, Alabama | 19437 | 138500 | 20154 | 90500 | 22546.92 | 160660 | -2392.92 | -0.1061307 | -70160 | -0.4366986 |
| 01001020300 | Census Tract 203, Autauga County, Alabama | 24146 | 111300 | 27383 | 122600 | 28009.36 | 129108 | -626.36 | -0.0223625 | -6508 | -0.0504074 |
| 01001020400 | Census Tract 204, Autauga County, Alabama | 27735 | 126300 | 34620 | 152700 | 32172.60 | 146508 | 2447.40 | 0.0760709 | 6192 | 0.0422639 |
| 01001020500 | Census Tract 205, Autauga County, Alabama | 35517 | 173000 | 41178 | 186900 | 41199.72 | 200680 | -21.72 | -0.0005272 | -13780 | -0.0686665 |
| 01001020600 | Census Tract 206, Autauga County, Alabama | 24597 | 110700 | 21146 | 103600 | 28532.52 | 128412 | -7386.52 | -0.2588807 | -24812 | -0.1932218 |
| 01001020700 | Census Tract 207, Autauga County, Alabama | 22114 | 93800 | 20934 | 82400 | 25652.24 | 108808 | -4718.24 | -0.1839309 | -26408 | -0.2427027 |
| 01001020801 | Census Tract 208.01, Autauga County, Alabama | 30841 | 258000 | 31667 | 322900 | 35775.56 | 299280 | -4108.56 | -0.1148426 | 23620 | 0.0789227 |
| 01001020802 | Census Tract 208.02, Autauga County, Alabama | 29006 | 145100 | 33086 | 171500 | 33646.96 | 168316 | -560.96 | -0.0166719 | 3184 | 0.0189168 |
| 01001020900 | Census Tract 209, Autauga County, Alabama | 24841 | 108000 | 32677 | 156900 | 28815.56 | 125280 | 3861.44 | 0.1340054 | 31620 | 0.2523946 |
NMTC Data
svi_divisional_nmtc_df0 <- left_join(svi_divisional_nmtc, census_pull_df, join_by("GEOID_2010_trt" == "GEOID"))

svi_divisional_nmtc_df1 <- left_join(svi_divisional_nmtc_df0, hpi_df_10_20, join_by("GEOID_2010_trt" == "GEOID10")) %>%
                          unite("county_fips", FIPS_st, FIPS_county, sep = "")

svi_divisional_nmtc_df <- left_join(svi_divisional_nmtc_df1, msa_csa_crosswalk, join_by("county_fips" == "county_fips"))

svi_divisional_nmtc_df %>% head(10) %>% kbl() %>% kable_styling() %>% scroll_box(width = "100%")
| GEOID_2010_trt | county_fips | FIPS_tract | state | state_name | county | region_number | region | division_number | division | E_TOTPOP_10 | E_HU_10 | E_HH_10 | E_POV150_10 | ET_POVSTATUS_10 | EP_POV150_10 | EPL_POV150_10 | F_POV150_10 | E_UNEMP_10 | ET_EMPSTATUS_10 | EP_UNEMP_10 | EPL_UNEMP_10 | F_UNEMP_10 | E_HBURD_OWN_10 | ET_HOUSINGCOST_OWN_10 | EP_HBURD_OWN_10 | EPL_HBURD_OWN_10 | F_HBURD_OWN_10 | E_HBURD_RENT_10 | ET_HOUSINGCOST_RENT_10 | EP_HBURD_RENT_10 | EPL_HBURD_RENT_10 | F_HBURD_RENT_10 | E_HBURD_10 | ET_HOUSINGCOST_10 | EP_HBURD_10 | EPL_HBURD_10 | F_HBURD_10 | E_NOHSDP_10 | ET_EDSTATUS_10 | EP_NOHSDP_10 | EPL_NOHSDP_10 | F_NOHSDP_10 | E_UNINSUR_12 | ET_INSURSTATUS_12 | EP_UNINSUR_12 | EPL_UNINSUR_12 | F_UNINSUR_12 | E_AGE65_10 | EP_AGE65_10 | EPL_AGE65_10 | F_AGE65_10 | E_AGE17_10 | EP_AGE17_10 | EPL_AGE17_10 | F_AGE17_10 | E_DISABL_12 | ET_DISABLSTATUS_12 | EP_DISABL_12 | EPL_DISABL_12 | F_DISABL_12 | E_SNGPNT_10 | ET_FAMILIES_10 | EP_SNGPNT_10 | EPL_SNGPNT_10 | F_SNGPNT_10 | E_LIMENG_10 | ET_POPAGE5UP_10 | EP_LIMENG_10 | EPL_LIMENG_10 | F_LIMENG_10 | E_MINRTY_10 | ET_POPETHRACE_10 | EP_MINRTY_10 | EPL_MINRTY_10 | F_MINRTY_10 | E_STRHU_10 | E_MUNIT_10 | EP_MUNIT_10 | EPL_MUNIT_10 | F_MUNIT_10 | E_MOBILE_10 | EP_MOBILE_10 | EPL_MOBILE_10 | F_MOBILE_10 | E_CROWD_10 | ET_OCCUPANTS_10 | EP_CROWD_10 | EPL_CROWD_10 | F_CROWD_10 | E_NOVEH_10 | ET_KNOWNVEH_10 | EP_NOVEH_10 | EPL_NOVEH_10 | F_NOVEH_10 | E_GROUPQ_10 | ET_HHTYPE_10 | EP_GROUPQ_10 | EPL_GROUPQ_10 | F_GROUPQ_10 | SPL_THEME1_10 | RPL_THEME1_10 | F_THEME1_10 | SPL_THEME2_10 | RPL_THEME2_10 | F_THEME2_10 | SPL_THEME3_10 | RPL_THEME3_10 | F_THEME3_10 | SPL_THEME4_10 | RPL_THEME4_10 | F_THEME4_10 | SPL_THEMES_10 | RPL_THEMES_10 | F_TOTAL_10 | E_TOTPOP_20 | E_HU_20 | E_HH_20 | E_POV150_20 | ET_POVSTATUS_20 | EP_POV150_20 | EPL_POV150_20 | F_POV150_20 | E_UNEMP_20 | ET_EMPSTATUS_20 | EP_UNEMP_20 | EPL_UNEMP_20 | F_UNEMP_20 | E_HBURD_OWN_20 | ET_HOUSINGCOST_OWN_20 | EP_HBURD_OWN_20 | EPL_HBURD_OWN_20 | F_HBURD_OWN_20 | E_HBURD_RENT_20 | ET_HOUSINGCOST_RENT_20 | EP_HBURD_RENT_20 | EPL_HBURD_RENT_20 | F_HBURD_RENT_20 | E_HBURD_20 | ET_HOUSINGCOST_20 | EP_HBURD_20 | EPL_HBURD_20 | F_HBURD_20 | E_NOHSDP_20 | ET_EDSTATUS_20 | EP_NOHSDP_20 | EPL_NOHSDP_20 | F_NOHSDP_20 | E_UNINSUR_20 | ET_INSURSTATUS_20 | EP_UNINSUR_20 | EPL_UNINSUR_20 | F_UNINSUR_20 | E_AGE65_20 | EP_AGE65_20 | EPL_AGE65_20 | F_AGE65_20 | E_AGE17_20 | EP_AGE17_20 | EPL_AGE17_20 | F_AGE17_20 | E_DISABL_20 | ET_DISABLSTATUS_20 | EP_DISABL_20 | EPL_DISABL_20 | F_DISABL_20 | E_SNGPNT_20 | ET_FAMILIES_20 | EP_SNGPNT_20 | EPL_SNGPNT_20 | F_SNGPNT_20 | E_LIMENG_20 | ET_POPAGE5UP_20 | EP_LIMENG_20 | EPL_LIMENG_20 | F_LIMENG_20 | E_MINRTY_20 | ET_POPETHRACE_20 | EP_MINRTY_20 | EPL_MINRTY_20 | F_MINRTY_20 | E_STRHU_20 | E_MUNIT_20 | EP_MUNIT_20 | EPL_MUNIT_20 | F_MUNIT_20 | E_MOBILE_20 | EP_MOBILE_20 | EPL_MOBILE_20 | F_MOBILE_20 | E_CROWD_20 | ET_OCCUPANTS_20 | EP_CROWD_20 | EPL_CROWD_20 | F_CROWD_20 | E_NOVEH_20 | ET_KNOWNVEH_20 | EP_NOVEH_20 | EPL_NOVEH_20 | F_NOVEH_20 | E_GROUPQ_20 | ET_HHTYPE_20 | EP_GROUPQ_20 | EPL_GROUPQ_20 | F_GROUPQ_20 | SPL_THEME1_20 | RPL_THEME1_20 | F_THEME1_20 | SPL_THEME2_20 | RPL_THEME2_20 | F_THEME2_20 | SPL_THEME3_20 | RPL_THEME3_20 | F_THEME3_20 | SPL_THEME4_20 | RPL_THEME4_20 | F_THEME4_20 | SPL_THEMES_20 | RPL_THEMES_20 | F_TOTAL_20 | nmtc_eligibility | pre10_nmtc_project_cnt | pre10_nmtc_dollars | pre10_nmtc_dollars_formatted | post10_nmtc_project_cnt | post10_nmtc_dollars | post10_nmtc_dollars_formatted | nmtc_flag | NAME | Median_Income_10 | Median_Home_Value_10 | Median_Income_19 | Median_Home_Value_19 | Median_Income_10adj | Median_Home_Value_10adj | Median_Income_Change | Median_Income_Change_pct | Median_Home_Value_Change | Median_Home_Value_Change_pct | housing_price_index10 | housing_price_index20 | county_title | cbsa | cbsa_code |
|---|---|---|---|---|---|---|---|---|---|---|---|---|---|---|---|---|---|---|---|---|---|---|---|---|---|---|---|---|---|---|---|---|---|---|---|---|---|---|---|---|---|---|---|---|---|---|---|---|---|---|---|---|---|---|---|---|---|---|---|---|---|---|---|---|---|---|---|---|---|---|---|---|---|---|---|---|---|---|---|---|---|---|---|---|---|---|---|---|---|---|---|---|---|---|---|---|---|---|---|---|---|---|---|---|---|---|---|---|---|---|---|---|---|---|---|---|---|---|---|---|---|---|---|---|---|---|---|---|---|---|---|---|---|---|---|---|---|---|---|---|---|---|---|---|---|---|---|---|---|---|---|---|---|---|---|---|---|---|---|---|---|---|---|---|---|---|---|---|---|---|---|---|---|---|---|---|---|---|---|---|---|---|---|---|---|---|---|---|---|---|---|---|---|---|---|---|---|---|---|---|---|---|---|---|---|---|---|---|---|---|---|---|---|---|---|---|---|---|---|---|---|---|---|---|---|---|---|---|---|---|---|---|---|---|---|---|---|---|---|---|---|---|---|
| 02013000100 | 02013 | 000100 | AK | Alaska | Aleutians East Borough | 4 | West Region | 9 | Pacific Division | 3703 | 474 | 267 | 1212 | 3695 | 32.80108 | 0.7570 | 1 | 111 | 3163 | 3.509327 | 0.08691 | 0 | 25 | 158 | 15.82278 | 0.01337 | 0 | 17 | 109 | 15.59633 | 0.02605 | 0 | 42 | 267 | 15.73034 | 0.004754 | 0 | 1082 | 3017 | 35.863441 | 0.85420 | 1 | 2060 | 3112 | 66.195373 | 0.99990 | 1 | 127 | 3.429652 | 0.042400 | 0 | 315 | 8.506616 | 0.03961 | 0 | 182 | 2849 | 6.388206 | 0.077750 | 0 | 50 | 165 | 30.30303 | 0.8835 | 1 | 1070 | 3617 | 29.5825270 | 0.93700 | 1 | 3492 | 3703 | 94.30192 | 0.9141 | 1 | 474 | 8 | 1.687764 | 0.29250 | 0 | 42 | 8.8607595 | 0.8128 | 1 | 7 | 267 | 2.6217228 | 0.4003 | 0 | 77 | 267 | 28.8389513 | 0.96850 | 1 | 2969 | 3703 | 80.1782339 | 0.9940 | 1 | 2.702764 | 0.5611 | 3 | 1.980260 | 0.23800 | 2 | 0.9141 | 0.9047 | 1 | 3.46810 | 0.8902 | 3 | 9.065224 | 0.6397 | 9 | 3389 | 1199 | 988 | 698 | 3379 | 20.65700 | 0.5925 | 0 | 86 | 2414 | 3.562552 | 0.2665 | 0 | 67 | 607 | 11.037891 | 0.01803 | 0 | 74 | 381 | 19.42257 | 0.04067 | 0 | 141 | 988 | 14.27126 | 0.006988 | 0 | 354 | 2646 | 13.378685 | 0.61070 | 0 | 1345 | 3384 | 39.745863 | 0.99970 | 1 | 381 | 11.2422544 | 0.31390 | 0 | 443 | 13.07170 | 0.0988 | 0 | 339 | 2941.000 | 11.526692 | 0.386000 | 0 | 135 | 593.000 | 22.765599 | 0.7920 | 1 | 334 | 3276 | 10.1953602 | 0.72620 | 0 | 2939 | 3389.000 | 86.72175 | 0.8110 | 1 | 1199 | 38 | 3.169308 | 0.3474 | 0 | 69 | 5.754796 | 0.7806 | 1 | 30 | 988 | 3.0364372 | 0.36010 | 0 | 220 | 988.000 | 22.267207 | 0.9527 | 1 | 1035 | 3389 | 30.5399823 | 0.9843 | 1 | 2.476388 | 0.4947 | 1 | 2.316900 | 0.37850 | 1 | 0.8110 | 0.8038 | 1 | 3.42510 | 0.8683 | 3 | 9.029388 | 0.6419 | 6 | Yes | 0 | 0 | \$0 | 1 | 15762500 | \$15,762,500 | 1 | Census Tract 1, Aleutians East Borough, Alaska | 21138 | 121600 | 29177 | 119900 | 24520.08 | 141056 | 4656.92 | 0.1899227 | -21156 | -0.1499830 | NA | NA | NA | NA | NA |
| 02016000100 | 02016 | 000100 | AK | Alaska | Aleutians West Census Area | 4 | West Region | 9 | Pacific Division | 1774 | 1056 | 166 | 328 | 1231 | 26.64500 | 0.6553 | 0 | 15 | 1370 | 1.094890 | 0.01369 | 0 | 25 | 95 | 26.31579 | 0.09653 | 0 | 16 | 71 | 22.53521 | 0.05099 | 0 | 41 | 166 | 24.69880 | 0.029080 | 0 | 207 | 1330 | 15.563910 | 0.58390 | 0 | 484 | 973 | 49.743063 | 0.99520 | 1 | 53 | 2.987599 | 0.031800 | 0 | 182 | 10.259301 | 0.05188 | 0 | 147 | 747 | 19.678715 | 0.864200 | 1 | 19 | 96 | 19.79167 | 0.6606 | 0 | 79 | 1718 | 4.5983702 | 0.46890 | 0 | 1154 | 1774 | 65.05073 | 0.6522 | 0 | 1056 | 22 | 2.083333 | 0.31610 | 0 | 0 | 0.0000000 | 0.2497 | 0 | 10 | 166 | 6.0240964 | 0.6154 | 0 | 84 | 166 | 50.6024096 | 0.99320 | 1 | 1324 | 1774 | 74.6335964 | 0.9935 | 1 | 2.277170 | 0.4443 | 1 | 2.077380 | 0.27780 | 1 | 0.6522 | 0.6454 | 0 | 3.16790 | 0.7874 | 2 | 8.174650 | 0.5311 | 4 | 950 | 694 | 199 | 218 | 719 | 30.31989 | 0.7848 | 1 | 15 | 560 | 2.678571 | 0.1560 | 0 | 11 | 117 | 9.401709 | 0.01305 | 0 | 14 | 82 | 17.07317 | 0.03088 | 0 | 25 | 199 | 12.56281 | 0.003541 | 0 | 48 | 681 | 7.048458 | 0.37250 | 0 | 238 | 721 | 33.009709 | 0.99890 | 1 | 116 | 12.2105263 | 0.37310 | 0 | 195 | 20.52632 | 0.4153 | 0 | 113 | 526.000 | 21.482890 | 0.893100 | 1 | 31 | 98.000 | 31.632653 | 0.9318 | 1 | 17 | 900 | 1.8888889 | 0.29830 | 0 | 713 | 950.000 | 75.05263 | 0.6900 | 0 | 694 | 17 | 2.449568 | 0.3163 | 0 | 0 | 0.000000 | 0.2466 | 0 | 7 | 199 | 3.5175879 | 0.39980 | 0 | 68 | 199.000 | 34.170854 | 0.9826 | 1 | 274 | 950 | 28.8421053 | 0.9832 | 1 | 2.315741 | 0.4476 | 2 | 2.911600 | 0.70420 | 2 | 0.6900 | 0.6839 | 0 | 2.92850 | 0.6794 | 2 | 8.845841 | 0.6188 | 6 | Yes | 0 | 0 | \$0 | 0 | 0 | \$0 | 0 | Census Tract 1, Aleutians West Census Area, Alaska | 26600 | 103800 | 33125 | 71500 | 30856.00 | 120408 | 2269.00 | 0.0735351 | -48908 | -0.4061856 | NA | NA | NA | NA | NA |
| 02020000300 | 02020 | 000300 | AK | Alaska | Anchorage Municipality | 4 | West Region | 9 | Pacific Division | 6308 | 1834 | 1707 | 1137 | 5839 | 19.47251 | 0.4988 | 0 | 59 | 1024 | 5.761719 | 0.26830 | 0 | 11 | 11 | 100.00000 | 0.99780 | 1 | 609 | 1696 | 35.90802 | 0.17490 | 0 | 620 | 1707 | 36.32103 | 0.215100 | 0 | 85 | 2458 | 3.458096 | 0.12670 | 0 | 125 | 4961 | 2.519653 | 0.02643 | 0 | 0 | 0.000000 | 0.003301 | 0 | 2744 | 43.500317 | 0.99640 | 1 | 54 | 2007 | 2.690583 | 0.007821 | 0 | 301 | 1635 | 18.40979 | 0.6168 | 0 | 11 | 5308 | 0.2072344 | 0.06620 | 0 | 2167 | 6308 | 34.35320 | 0.3715 | 0 | 1834 | 24 | 1.308615 | 0.27080 | 0 | 0 | 0.0000000 | 0.2497 | 0 | 10 | 1707 | 0.5858231 | 0.1573 | 0 | 10 | 1707 | 0.5858231 | 0.07765 | 0 | 469 | 6308 | 7.4350032 | 0.9359 | 1 | 1.135330 | 0.1355 | 0 | 1.690522 | 0.13070 | 1 | 0.3715 | 0.3677 | 0 | 1.69135 | 0.1520 | 1 | 4.888702 | 0.1113 | 2 | 8256 | 1834 | 1731 | 1603 | 6583 | 24.35060 | 0.6772 | 0 | 95 | 1105 | 8.597285 | 0.8029 | 1 | 7 | 16 | 43.750000 | 0.91050 | 1 | 1127 | 1715 | 65.71429 | 0.88900 | 1 | 1134 | 1731 | 65.51127 | 0.985700 | 1 | 148 | 3181 | 4.652625 | 0.23830 | 0 | 80 | 5243 | 1.525844 | 0.08775 | 0 | 119 | 1.4413760 | 0.00975 | 0 | 3086 | 37.37888 | 0.9880 | 1 | 193 | 2171.088 | 8.889551 | 0.188800 | 0 | 136 | 1429.970 | 9.510687 | 0.3216 | 0 | 0 | 7040 | 0.0000000 | 0.02391 | 0 | 3808 | 8256.294 | 46.12239 | 0.4209 | 0 | 1834 | 127 | 6.924755 | 0.4701 | 0 | 0 | 0.000000 | 0.2466 | 0 | 13 | 1731 | 0.7510110 | 0.12710 | 0 | 179 | 1731.395 | 10.338487 | 0.7913 | 1 | 1673 | 8256 | 20.2640504 | 0.9768 | 1 | 2.791850 | 0.5891 | 2 | 1.532060 | 0.07776 | 1 | 0.4209 | 0.4172 | 0 | 2.61190 | 0.5330 | 2 | 7.356710 | 0.4139 | 5 | Yes | 0 | 0 | \$0 | 0 | 0 | \$0 | 0 | Census Tract 3, Anchorage Municipality, Alaska | 32404 | NA | 31620 | NA | 37588.64 | NA | -5968.64 | -0.1587884 | NA | NA | NA | NA | Anchorage Municipality, Alaska | Anchorage, AK MSA | C1126 |
| 02020000400 | 02020 | 000400 | AK | Alaska | Anchorage Municipality | 4 | West Region | 9 | Pacific Division | 5991 | 1360 | 1246 | 628 | 4602 | 13.64624 | 0.3404 | 0 | 117 | 924 | 12.662338 | 0.81630 | 1 | 0 | 12 | 0.00000 | 0.00240 | 0 | 761 | 1234 | 61.66937 | 0.78730 | 1 | 761 | 1246 | 61.07544 | 0.929600 | 1 | 24 | 1995 | 1.203008 | 0.03078 | 0 | 55 | 4075 | 1.349693 | 0.01061 | 0 | 0 | 0.000000 | 0.003301 | 0 | 2117 | 35.336338 | 0.93430 | 1 | 86 | 1820 | 4.725275 | 0.029420 | 0 | 138 | 1246 | 11.07544 | 0.3314 | 0 | 14 | 5099 | 0.2745636 | 0.07606 | 0 | 1539 | 5991 | 25.68853 | 0.2688 | 0 | 1360 | 0 | 0.000000 | 0.09395 | 0 | 10 | 0.7352941 | 0.5653 | 0 | 38 | 1246 | 3.0497592 | 0.4365 | 0 | 21 | 1246 | 1.6853933 | 0.19700 | 0 | 1389 | 5991 | 23.1847772 | 0.9762 | 1 | 2.127690 | 0.4021 | 2 | 1.374481 | 0.05613 | 1 | 0.2688 | 0.2660 | 0 | 2.26895 | 0.3836 | 1 | 6.039921 | 0.2480 | 4 | 5090 | 1440 | 1377 | 657 | 4243 | 15.48433 | 0.4416 | 0 | 82 | 1435 | 5.714286 | 0.5455 | 0 | 0 | 0 | NaN | NA | NA | 912 | 1377 | 66.23094 | 0.89700 | 1 | 912 | 1377 | 66.23094 | 0.987300 | 1 | 28 | 1928 | 1.452282 | 0.05471 | 0 | 82 | 3349 | 2.448492 | 0.16300 | 0 | 12 | 0.2357564 | 0.00585 | 0 | 1446 | 28.40864 | 0.8460 | 1 | 68 | 1902.717 | 3.573837 | 0.008563 | 0 | 56 | 1032.000 | 5.426357 | 0.1342 | 0 | 9 | 4411 | 0.2040354 | 0.06983 | 0 | 2444 | 5089.955 | 48.01614 | 0.4425 | 0 | 1440 | 38 | 2.638889 | 0.3255 | 0 | 0 | 0.000000 | 0.2466 | 0 | 7 | 1377 | 0.5083515 | 0.09514 | 0 | 92 | 1377.000 | 6.681191 | 0.6436 | 0 | 820 | 5090 | 16.1100196 | 0.9730 | 1 | 2.192110 | 0.4140 | 1 | 1.064443 | 0.02264 | 1 | 0.4425 | 0.4386 | 0 | 2.28384 | 0.3878 | 1 | 5.982893 | 0.2198 | 3 | Yes | 0 | 0 | \$0 | 0 | 0 | \$0 | 0 | Census Tract 4, Anchorage Municipality, Alaska | 23868 | NA | 30710 | NA | 27686.88 | NA | 3023.12 | 0.1091896 | NA | NA | NA | NA | Anchorage Municipality, Alaska | Anchorage, AK MSA | C1126 |
| 02020000500 | 02020 | 000500 | AK | Alaska | Anchorage Municipality | 4 | West Region | 9 | Pacific Division | 1872 | 979 | 956 | 384 | 1872 | 20.51282 | 0.5238 | 0 | 30 | 957 | 3.134796 | 0.06633 | 0 | 56 | 149 | 37.58389 | 0.39630 | 0 | 321 | 807 | 39.77695 | 0.23920 | 0 | 377 | 956 | 39.43515 | 0.311800 | 0 | 190 | 1139 | 16.681299 | 0.60890 | 0 | 314 | 2109 | 14.888573 | 0.48950 | 0 | 221 | 11.805556 | 0.574800 | 0 | 434 | 23.183761 | 0.43040 | 0 | 307 | 1475 | 20.813559 | 0.894900 | 1 | 91 | 385 | 23.63636 | 0.7603 | 1 | 129 | 1793 | 7.1946458 | 0.58420 | 0 | 1048 | 1872 | 55.98291 | 0.5787 | 0 | 979 | 578 | 59.039837 | 0.95260 | 1 | 0 | 0.0000000 | 0.2497 | 0 | 22 | 956 | 2.3012552 | 0.3729 | 0 | 78 | 956 | 8.1589958 | 0.68640 | 0 | 0 | 1872 | 0.0000000 | 0.3743 | 0 | 2.000330 | 0.3676 | 0 | 3.244600 | 0.82880 | 2 | 0.5787 | 0.5727 | 0 | 2.63590 | 0.5502 | 1 | 8.459530 | 0.5669 | 3 | 2039 | 1074 | 985 | 624 | 2039 | 30.60324 | 0.7906 | 1 | 119 | 1125 | 10.577778 | 0.8901 | 1 | 42 | 138 | 30.434783 | 0.56020 | 0 | 361 | 847 | 42.62102 | 0.32940 | 0 | 403 | 985 | 40.91371 | 0.614800 | 0 | 61 | 1468 | 4.155313 | 0.20970 | 0 | 350 | 1966 | 17.802645 | 0.95510 | 1 | 200 | 9.8087298 | 0.22920 | 0 | 322 | 15.79205 | 0.1707 | 0 | 233 | 1644.283 | 14.170309 | 0.581400 | 0 | 143 | 338.000 | 42.307692 | 0.9859 | 1 | 48 | 1920 | 2.5000000 | 0.35480 | 0 | 1060 | 2039.045 | 51.98512 | 0.4840 | 0 | 1074 | 642 | 59.776536 | 0.9485 | 1 | 0 | 0.000000 | 0.2466 | 0 | 39 | 985 | 3.9593909 | 0.43720 | 0 | 230 | 985.000 | 23.350254 | 0.9573 | 1 | 0 | 2039 | 0.0000000 | 0.1370 | 0 | 3.460300 | 0.7607 | 3 | 2.322000 | 0.38140 | 1 | 0.4840 | 0.4797 | 0 | 2.72660 | 0.5866 | 2 | 8.992900 | 0.6375 | 6 | Yes | 0 | 0 | \$0 | 0 | 0 | \$0 | 0 | Census Tract 5, Anchorage Municipality, Alaska | 28705 | 325000 | 29432 | 378600 | 33297.80 | 377000 | -3865.80 | -0.1160978 | 1600 | 0.0042440 | 149.51 | 185.49 | Anchorage Municipality, Alaska | Anchorage, AK MSA | C1126 |
| 02020000701 | 02020 | 000701 | AK | Alaska | Anchorage Municipality | 4 | West Region | 9 | Pacific Division | 5432 | 2076 | 1969 | 1206 | 5418 | 22.25914 | 0.5643 | 0 | 264 | 2765 | 9.547920 | 0.62650 | 0 | 354 | 1051 | 33.68221 | 0.26640 | 0 | 362 | 918 | 39.43355 | 0.23330 | 0 | 716 | 1969 | 36.36364 | 0.216100 | 0 | 411 | 3280 | 12.530488 | 0.50270 | 0 | 1108 | 5795 | 19.119931 | 0.64920 | 0 | 354 | 6.516937 | 0.200300 | 0 | 1479 | 27.227540 | 0.65230 | 0 | 567 | 4056 | 13.979290 | 0.607400 | 0 | 415 | 1255 | 33.06773 | 0.9178 | 1 | 73 | 4960 | 1.4717742 | 0.22780 | 0 | 3080 | 5432 | 56.70103 | 0.5848 | 0 | 2076 | 273 | 13.150289 | 0.63880 | 0 | 335 | 16.1368015 | 0.8980 | 1 | 166 | 1969 | 8.4306755 | 0.7014 | 0 | 202 | 1969 | 10.2590147 | 0.76450 | 1 | 0 | 5432 | 0.0000000 | 0.3743 | 0 | 2.558800 | 0.5224 | 0 | 2.605600 | 0.53860 | 1 | 0.5848 | 0.5788 | 0 | 3.37700 | 0.8627 | 2 | 9.126200 | 0.6476 | 3 | 6784 | 2585 | 2265 | 1300 | 6719 | 19.34812 | 0.5567 | 0 | 196 | 3597 | 5.448985 | 0.5123 | 0 | 356 | 1275 | 27.921569 | 0.45790 | 0 | 443 | 990 | 44.74747 | 0.37870 | 0 | 799 | 2265 | 35.27594 | 0.419800 | 0 | 363 | 3964 | 9.157417 | 0.46990 | 0 | 651 | 6607 | 9.853186 | 0.76060 | 1 | 437 | 6.4416274 | 0.06927 | 0 | 2252 | 33.19575 | 0.9548 | 1 | 945 | 4355.000 | 21.699196 | 0.897900 | 1 | 179 | 1612.000 | 11.104218 | 0.3936 | 0 | 481 | 6172 | 7.7932599 | 0.65010 | 0 | 4356 | 6784.000 | 64.20991 | 0.5963 | 0 | 2585 | 356 | 13.771760 | 0.6278 | 0 | 424 | 16.402321 | 0.9130 | 1 | 195 | 2265 | 8.6092715 | 0.68030 | 0 | 250 | 2265.000 | 11.037528 | 0.8145 | 1 | 7 | 6784 | 0.1031840 | 0.3090 | 0 | 2.719300 | 0.5684 | 1 | 2.965670 | 0.73150 | 2 | 0.5963 | 0.5911 | 0 | 3.34460 | 0.8443 | 2 | 9.625870 | 0.7156 | 5 | Yes | 0 | 0 | \$0 | 0 | 0 | \$0 | 0 | Census Tract 7.01, Anchorage Municipality, Alaska | 30261 | 212800 | 35306 | 230800 | 35102.76 | 246848 | 203.24 | 0.0057899 | -16048 | -0.0650117 | 196.20 | 222.97 | Anchorage Municipality, Alaska | Anchorage, AK MSA | C1126 |
| 02020000702 | 02020 | 000702 | AK | Alaska | Anchorage Municipality | 4 | West Region | 9 | Pacific Division | 5312 | 1972 | 1853 | 1154 | 5242 | 22.01450 | 0.5594 | 0 | 121 | 2647 | 4.571213 | 0.16150 | 0 | 229 | 784 | 29.20918 | 0.15100 | 0 | 418 | 1069 | 39.10196 | 0.22630 | 0 | 647 | 1853 | 34.91635 | 0.176500 | 0 | 172 | 2799 | 6.145052 | 0.25580 | 0 | 941 | 5126 | 18.357394 | 0.62460 | 0 | 202 | 3.802711 | 0.053090 | 0 | 1602 | 30.158133 | 0.78390 | 1 | 390 | 3602 | 10.827318 | 0.374000 | 0 | 279 | 1344 | 20.75893 | 0.6878 | 0 | 84 | 4700 | 1.7872340 | 0.26170 | 0 | 2129 | 5312 | 40.07907 | 0.4352 | 0 | 1972 | 250 | 12.677485 | 0.62970 | 0 | 48 | 2.4340771 | 0.6783 | 0 | 142 | 1853 | 7.6632488 | 0.6768 | 0 | 80 | 1853 | 4.3173233 | 0.45840 | 0 | 29 | 5312 | 0.5459337 | 0.7587 | 1 | 1.777800 | 0.3048 | 0 | 2.160490 | 0.31610 | 1 | 0.4352 | 0.4308 | 0 | 3.20190 | 0.8004 | 1 | 7.575390 | 0.4514 | 2 | 6391 | 2512 | 2317 | 1253 | 6298 | 19.89520 | 0.5724 | 0 | 101 | 2893 | 3.491186 | 0.2572 | 0 | 404 | 1230 | 32.845529 | 0.65310 | 0 | 524 | 1087 | 48.20607 | 0.46800 | 0 | 928 | 2317 | 40.05179 | 0.586300 | 0 | 431 | 3563 | 12.096548 | 0.57540 | 0 | 433 | 6087 | 7.113521 | 0.60170 | 0 | 634 | 9.9202003 | 0.23630 | 0 | 1892 | 29.60413 | 0.8823 | 1 | 1004 | 4195.000 | 23.933254 | 0.936100 | 1 | 351 | 1366.000 | 25.695461 | 0.8500 | 1 | 129 | 5974 | 2.1593572 | 0.32410 | 0 | 3992 | 6391.000 | 62.46284 | 0.5804 | 0 | 2512 | 548 | 21.815287 | 0.7513 | 1 | 200 | 7.961783 | 0.8180 | 1 | 220 | 2317 | 9.4950367 | 0.71030 | 0 | 120 | 2317.000 | 5.179111 | 0.5520 | 0 | 48 | 6391 | 0.7510562 | 0.6479 | 0 | 2.593000 | 0.5336 | 0 | 3.228800 | 0.84110 | 3 | 0.5804 | 0.5753 | 0 | 3.47950 | 0.8832 | 2 | 9.881700 | 0.7464 | 5 | Yes | 0 | 0 | \$0 | 0 | 0 | \$0 | 0 | Census Tract 7.02, Anchorage Municipality, Alaska | 30132 | 265800 | 27486 | 280300 | 34953.12 | 308328 | -7467.12 | -0.2136324 | -28028 | -0.0909032 | 192.20 | 212.03 | Anchorage Municipality, Alaska | Anchorage, AK MSA | C1126 |
| 02020000703 | 02020 | 000703 | AK | Alaska | Anchorage Municipality | 4 | West Region | 9 | Pacific Division | 5309 | 2312 | 2051 | 1208 | 5217 | 23.15507 | 0.5826 | 0 | 440 | 2750 | 16.000000 | 0.91910 | 1 | 269 | 929 | 28.95587 | 0.14470 | 0 | 613 | 1122 | 54.63458 | 0.61220 | 0 | 882 | 2051 | 43.00341 | 0.440600 | 0 | 480 | 3244 | 14.796548 | 0.56470 | 0 | 1399 | 5075 | 27.566502 | 0.85540 | 1 | 526 | 9.907704 | 0.446600 | 0 | 1355 | 25.522697 | 0.56000 | 0 | 1039 | 3732 | 27.840300 | 0.976800 | 1 | 304 | 1256 | 24.20382 | 0.7732 | 1 | 292 | 4943 | 5.9073437 | 0.53390 | 0 | 3146 | 5309 | 59.25786 | 0.6070 | 0 | 2312 | 514 | 22.231834 | 0.77020 | 1 | 235 | 10.1643599 | 0.8305 | 1 | 151 | 2051 | 7.3622623 | 0.6657 | 0 | 156 | 2051 | 7.6060458 | 0.66140 | 0 | 32 | 5309 | 0.6027500 | 0.7607 | 1 | 3.362400 | 0.7239 | 2 | 3.290500 | 0.84540 | 2 | 0.6070 | 0.6007 | 0 | 3.68850 | 0.9360 | 3 | 10.948400 | 0.8380 | 7 | 6007 | 2397 | 2191 | 1596 | 5859 | 27.24014 | 0.7337 | 0 | 231 | 3303 | 6.993642 | 0.6809 | 0 | 321 | 1072 | 29.944030 | 0.54100 | 0 | 571 | 1120 | 50.98214 | 0.54040 | 0 | 892 | 2192 | 40.69343 | 0.608200 | 0 | 293 | 3692 | 7.936078 | 0.41630 | 0 | 766 | 5779 | 13.254888 | 0.87670 | 1 | 739 | 12.3023140 | 0.37940 | 0 | 1707 | 28.41685 | 0.8466 | 1 | 625 | 4057.618 | 15.403126 | 0.662900 | 0 | 387 | 1378.067 | 28.082823 | 0.8878 | 1 | 126 | 5449 | 2.3123509 | 0.33780 | 0 | 3959 | 6006.510 | 65.91182 | 0.6115 | 0 | 2397 | 315 | 13.141427 | 0.6161 | 0 | 303 | 12.640801 | 0.8788 | 1 | 273 | 2191 | 12.4600639 | 0.78630 | 1 | 240 | 2191.439 | 10.951706 | 0.8114 | 1 | 201 | 6007 | 3.3460962 | 0.8922 | 1 | 3.315800 | 0.7254 | 1 | 3.114500 | 0.79680 | 2 | 0.6115 | 0.6061 | 0 | 3.98480 | 0.9711 | 4 | 11.026600 | 0.8725 | 7 | Yes | 0 | 0 | \$0 | 0 | 0 | \$0 | 0 | Census Tract 7.03, Anchorage Municipality, Alaska | 19589 | 147100 | 26957 | 194200 | 22723.24 | 170636 | 4233.76 | 0.1863185 | 23564 | 0.1380951 | 138.68 | 150.83 | Anchorage Municipality, Alaska | Anchorage, AK MSA | C1126 |
| 02020000801 | 02020 | 000801 | AK | Alaska | Anchorage Municipality | 4 | West Region | 9 | Pacific Division | 6878 | 2593 | 2380 | 1901 | 6821 | 27.86981 | 0.6792 | 0 | 514 | 3678 | 13.974986 | 0.86730 | 1 | 415 | 976 | 42.52049 | 0.57230 | 0 | 595 | 1404 | 42.37892 | 0.29620 | 0 | 1010 | 2380 | 42.43697 | 0.418100 | 0 | 383 | 3752 | 10.207889 | 0.42440 | 0 | 1608 | 7420 | 21.671159 | 0.72520 | 0 | 378 | 5.495784 | 0.132500 | 0 | 2001 | 29.092759 | 0.74220 | 0 | 879 | 4943 | 17.782723 | 0.804800 | 1 | 535 | 1648 | 32.46359 | 0.9101 | 1 | 328 | 6158 | 5.3264047 | 0.50640 | 0 | 4037 | 6878 | 58.69439 | 0.6022 | 0 | 2593 | 323 | 12.456614 | 0.62550 | 0 | 122 | 4.7049749 | 0.7403 | 0 | 246 | 2380 | 10.3361345 | 0.7506 | 1 | 250 | 2380 | 10.5042017 | 0.76960 | 1 | 127 | 6878 | 1.8464670 | 0.8242 | 1 | 3.114200 | 0.6623 | 1 | 3.096000 | 0.76840 | 2 | 0.6022 | 0.5960 | 0 | 3.71020 | 0.9397 | 3 | 10.522600 | 0.7937 | 6 | 8039 | 2575 | 2349 | 1877 | 7913 | 23.72046 | 0.6629 | 0 | 224 | 3708 | 6.040992 | 0.5815 | 0 | 364 | 1245 | 29.236948 | 0.51410 | 0 | 332 | 1104 | 30.07246 | 0.11540 | 0 | 696 | 2349 | 29.62963 | 0.234900 | 0 | 631 | 4356 | 14.485767 | 0.63730 | 0 | 1269 | 7749 | 16.376307 | 0.93800 | 1 | 569 | 7.0779948 | 0.09286 | 0 | 2750 | 34.20823 | 0.9664 | 1 | 925 | 5009.000 | 18.466760 | 0.806400 | 1 | 342 | 1360.000 | 25.147059 | 0.8398 | 1 | 178 | 7027 | 2.5330867 | 0.35840 | 0 | 6353 | 8039.000 | 79.02724 | 0.7276 | 0 | 2575 | 438 | 17.009709 | 0.6842 | 0 | 228 | 8.854369 | 0.8322 | 1 | 342 | 2349 | 14.5593870 | 0.82720 | 1 | 262 | 2349.000 | 11.153682 | 0.8169 | 1 | 101 | 8039 | 1.2563752 | 0.7476 | 0 | 3.054600 | 0.6607 | 1 | 3.063860 | 0.77520 | 3 | 0.7276 | 0.7212 | 0 | 3.90810 | 0.9647 | 3 | 10.754160 | 0.8443 | 7 | Yes | 0 | 0 | \$0 | 0 | 0 | \$0 | 0 | Census Tract 8.01, Anchorage Municipality, Alaska | 24433 | 214200 | 28895 | 217000 | 28342.28 | 248472 | 552.72 | 0.0195016 | -31472 | -0.1266622 | 175.52 | 189.05 | Anchorage Municipality, Alaska | Anchorage, AK MSA | C1126 |
| 02020000802 | 02020 | 000802 | AK | Alaska | Anchorage Municipality | 4 | West Region | 9 | Pacific Division | 4412 | 1955 | 1860 | 927 | 4412 | 21.01088 | 0.5341 | 0 | 366 | 2358 | 15.521629 | 0.90830 | 1 | 329 | 993 | 33.13192 | 0.24940 | 0 | 427 | 867 | 49.25029 | 0.46580 | 0 | 756 | 1860 | 40.64516 | 0.351500 | 0 | 284 | 2541 | 11.176702 | 0.45970 | 0 | 944 | 4351 | 21.696162 | 0.72640 | 0 | 291 | 6.595648 | 0.206200 | 0 | 1116 | 25.294651 | 0.54610 | 0 | 456 | 3183 | 14.326107 | 0.630400 | 0 | 365 | 1034 | 35.29981 | 0.9397 | 1 | 147 | 4065 | 3.6162362 | 0.41080 | 0 | 2063 | 4412 | 46.75884 | 0.4982 | 0 | 1955 | 526 | 26.905371 | 0.81460 | 1 | 235 | 12.0204604 | 0.8530 | 1 | 101 | 1860 | 5.4301075 | 0.5881 | 0 | 144 | 1860 | 7.7419355 | 0.66870 | 0 | 0 | 4412 | 0.0000000 | 0.3743 | 0 | 2.980000 | 0.6306 | 1 | 2.733200 | 0.60110 | 1 | 0.4982 | 0.4931 | 0 | 3.29870 | 0.8370 | 2 | 9.510100 | 0.6929 | 4 | 4596 | 1925 | 1698 | 1372 | 4591 | 29.88456 | 0.7781 | 1 | 244 | 2652 | 9.200603 | 0.8347 | 1 | 173 | 857 | 20.186698 | 0.15430 | 0 | 314 | 841 | 37.33650 | 0.21580 | 0 | 487 | 1698 | 28.68080 | 0.205800 | 0 | 329 | 2968 | 11.084906 | 0.54380 | 0 | 851 | 4533 | 18.773439 | 0.96420 | 1 | 366 | 7.9634465 | 0.13400 | 0 | 1030 | 22.41079 | 0.5367 | 0 | 416 | 3503.000 | 11.875535 | 0.412100 | 0 | 383 | 1001.000 | 38.261738 | 0.9747 | 1 | 189 | 4158 | 4.5454545 | 0.50160 | 0 | 2768 | 4596.000 | 60.22628 | 0.5606 | 0 | 1925 | 621 | 32.259740 | 0.8439 | 1 | 175 | 9.090909 | 0.8354 | 1 | 129 | 1698 | 7.5971731 | 0.64450 | 0 | 66 | 1698.000 | 3.886926 | 0.4438 | 0 | 33 | 4596 | 0.7180157 | 0.6406 | 0 | 3.326600 | 0.7282 | 3 | 2.559100 | 0.51470 | 1 | 0.5606 | 0.5556 | 0 | 3.40820 | 0.8630 | 2 | 9.854500 | 0.7420 | 6 | Yes | 0 | 0 | \$0 | 0 | 0 | \$0 | 0 | Census Tract 8.02, Anchorage Municipality, Alaska | 26412 | 126100 | 30241 | 141400 | 30637.92 | 146276 | -396.92 | -0.0129552 | -4876 | -0.0333342 | 153.74 | 179.71 | Anchorage Municipality, Alaska | Anchorage, AK MSA | C1126 |
svi_national_nmtc_df0 <- left_join(svi_national_nmtc, census_pull_df, join_by("GEOID_2010_trt" == "GEOID"))

svi_national_nmtc_df1 <- left_join(svi_national_nmtc_df0, hpi_df_10_20, join_by("GEOID_2010_trt" == "GEOID10")) %>%
                          unite("county_fips", FIPS_st, FIPS_county, sep = "")

svi_national_nmtc_df <- left_join(svi_national_nmtc_df1, msa_csa_crosswalk, join_by("county_fips" == "county_fips"))

svi_national_nmtc_df %>% head(10) %>% kbl() %>% kable_styling() %>% scroll_box(width = "100%")
| GEOID_2010_trt | county_fips | FIPS_tract | state | state_name | county | region_number | region | division_number | division | E_TOTPOP_10 | E_HU_10 | E_HH_10 | E_POV150_10 | ET_POVSTATUS_10 | EP_POV150_10 | EPL_POV150_10 | F_POV150_10 | E_UNEMP_10 | ET_EMPSTATUS_10 | EP_UNEMP_10 | EPL_UNEMP_10 | F_UNEMP_10 | E_HBURD_OWN_10 | ET_HOUSINGCOST_OWN_10 | EP_HBURD_OWN_10 | EPL_HBURD_OWN_10 | F_HBURD_OWN_10 | E_HBURD_RENT_10 | ET_HOUSINGCOST_RENT_10 | EP_HBURD_RENT_10 | EPL_HBURD_RENT_10 | F_HBURD_RENT_10 | E_HBURD_10 | ET_HOUSINGCOST_10 | EP_HBURD_10 | EPL_HBURD_10 | F_HBURD_10 | E_NOHSDP_10 | ET_EDSTATUS_10 | EP_NOHSDP_10 | EPL_NOHSDP_10 | F_NOHSDP_10 | E_UNINSUR_12 | ET_INSURSTATUS_12 | EP_UNINSUR_12 | EPL_UNINSUR_12 | F_UNINSUR_12 | E_AGE65_10 | EP_AGE65_10 | EPL_AGE65_10 | F_AGE65_10 | E_AGE17_10 | EP_AGE17_10 | EPL_AGE17_10 | F_AGE17_10 | E_DISABL_12 | ET_DISABLSTATUS_12 | EP_DISABL_12 | EPL_DISABL_12 | F_DISABL_12 | E_SNGPNT_10 | ET_FAMILIES_10 | EP_SNGPNT_10 | EPL_SNGPNT_10 | F_SNGPNT_10 | E_LIMENG_10 | ET_POPAGE5UP_10 | EP_LIMENG_10 | EPL_LIMENG_10 | F_LIMENG_10 | E_MINRTY_10 | ET_POPETHRACE_10 | EP_MINRTY_10 | EPL_MINRTY_10 | F_MINRTY_10 | E_STRHU_10 | E_MUNIT_10 | EP_MUNIT_10 | EPL_MUNIT_10 | F_MUNIT_10 | E_MOBILE_10 | EP_MOBILE_10 | EPL_MOBILE_10 | F_MOBILE_10 | E_CROWD_10 | ET_OCCUPANTS_10 | EP_CROWD_10 | EPL_CROWD_10 | F_CROWD_10 | E_NOVEH_10 | ET_KNOWNVEH_10 | EP_NOVEH_10 | EPL_NOVEH_10 | F_NOVEH_10 | E_GROUPQ_10 | ET_HHTYPE_10 | EP_GROUPQ_10 | EPL_GROUPQ_10 | F_GROUPQ_10 | SPL_THEME1_10 | RPL_THEME1_10 | F_THEME1_10 | SPL_THEME2_10 | RPL_THEME2_10 | F_THEME2_10 | SPL_THEME3_10 | RPL_THEME3_10 | F_THEME3_10 | SPL_THEME4_10 | RPL_THEME4_10 | F_THEME4_10 | SPL_THEMES_10 | RPL_THEMES_10 | F_TOTAL_10 | E_TOTPOP_20 | E_HU_20 | E_HH_20 | E_POV150_20 | ET_POVSTATUS_20 | EP_POV150_20 | EPL_POV150_20 | F_POV150_20 | E_UNEMP_20 | ET_EMPSTATUS_20 | EP_UNEMP_20 | EPL_UNEMP_20 | F_UNEMP_20 | E_HBURD_OWN_20 | ET_HOUSINGCOST_OWN_20 | EP_HBURD_OWN_20 | EPL_HBURD_OWN_20 | F_HBURD_OWN_20 | E_HBURD_RENT_20 | ET_HOUSINGCOST_RENT_20 | EP_HBURD_RENT_20 | EPL_HBURD_RENT_20 | F_HBURD_RENT_20 | E_HBURD_20 | ET_HOUSINGCOST_20 | EP_HBURD_20 | EPL_HBURD_20 | F_HBURD_20 | E_NOHSDP_20 | ET_EDSTATUS_20 | EP_NOHSDP_20 | EPL_NOHSDP_20 | F_NOHSDP_20 | E_UNINSUR_20 | ET_INSURSTATUS_20 | EP_UNINSUR_20 | EPL_UNINSUR_20 | F_UNINSUR_20 | E_AGE65_20 | EP_AGE65_20 | EPL_AGE65_20 | F_AGE65_20 | E_AGE17_20 | EP_AGE17_20 | EPL_AGE17_20 | F_AGE17_20 | E_DISABL_20 | ET_DISABLSTATUS_20 | EP_DISABL_20 | EPL_DISABL_20 | F_DISABL_20 | E_SNGPNT_20 | ET_FAMILIES_20 | EP_SNGPNT_20 | EPL_SNGPNT_20 | F_SNGPNT_20 | E_LIMENG_20 | ET_POPAGE5UP_20 | EP_LIMENG_20 | EPL_LIMENG_20 | F_LIMENG_20 | E_MINRTY_20 | ET_POPETHRACE_20 | EP_MINRTY_20 | EPL_MINRTY_20 | F_MINRTY_20 | E_STRHU_20 | E_MUNIT_20 | EP_MUNIT_20 | EPL_MUNIT_20 | F_MUNIT_20 | E_MOBILE_20 | EP_MOBILE_20 | EPL_MOBILE_20 | F_MOBILE_20 | E_CROWD_20 | ET_OCCUPANTS_20 | EP_CROWD_20 | EPL_CROWD_20 | F_CROWD_20 | E_NOVEH_20 | ET_KNOWNVEH_20 | EP_NOVEH_20 | EPL_NOVEH_20 | F_NOVEH_20 | E_GROUPQ_20 | ET_HHTYPE_20 | EP_GROUPQ_20 | EPL_GROUPQ_20 | F_GROUPQ_20 | SPL_THEME1_20 | RPL_THEME1_20 | F_THEME1_20 | SPL_THEME2_20 | RPL_THEME2_20 | F_THEME2_20 | SPL_THEME3_20 | RPL_THEME3_20 | F_THEME3_20 | SPL_THEME4_20 | RPL_THEME4_20 | F_THEME4_20 | SPL_THEMES_20 | RPL_THEMES_20 | F_TOTAL_20 | nmtc_eligibility | pre10_nmtc_project_cnt | pre10_nmtc_dollars | pre10_nmtc_dollars_formatted | post10_nmtc_project_cnt | post10_nmtc_dollars | post10_nmtc_dollars_formatted | nmtc_flag | NAME | Median_Income_10 | Median_Home_Value_10 | Median_Income_19 | Median_Home_Value_19 | Median_Income_10adj | Median_Home_Value_10adj | Median_Income_Change | Median_Income_Change_pct | Median_Home_Value_Change | Median_Home_Value_Change_pct | housing_price_index10 | housing_price_index20 | county_title | cbsa | cbsa_code |
|---|---|---|---|---|---|---|---|---|---|---|---|---|---|---|---|---|---|---|---|---|---|---|---|---|---|---|---|---|---|---|---|---|---|---|---|---|---|---|---|---|---|---|---|---|---|---|---|---|---|---|---|---|---|---|---|---|---|---|---|---|---|---|---|---|---|---|---|---|---|---|---|---|---|---|---|---|---|---|---|---|---|---|---|---|---|---|---|---|---|---|---|---|---|---|---|---|---|---|---|---|---|---|---|---|---|---|---|---|---|---|---|---|---|---|---|---|---|---|---|---|---|---|---|---|---|---|---|---|---|---|---|---|---|---|---|---|---|---|---|---|---|---|---|---|---|---|---|---|---|---|---|---|---|---|---|---|---|---|---|---|---|---|---|---|---|---|---|---|---|---|---|---|---|---|---|---|---|---|---|---|---|---|---|---|---|---|---|---|---|---|---|---|---|---|---|---|---|---|---|---|---|---|---|---|---|---|---|---|---|---|---|---|---|---|---|---|---|---|---|---|---|---|---|---|---|---|---|---|---|---|---|---|---|---|---|---|---|---|---|---|---|---|---|
| 01001020200 | 01001 | 020200 | AL | Alabama | Autauga County | 3 | South Region | 6 | East South Central Division | 2020 | 816 | 730 | 495 | 1992 | 24.84940 | 0.5954 | 0 | 68 | 834 | 8.153477 | 0.57540 | 0 | 49 | 439 | 11.16173 | 0.02067 | 0 | 105 | 291 | 36.08247 | 0.30190 | 0 | 154 | 730 | 21.09589 | 0.09312 | 0 | 339 | 1265 | 26.798419 | 0.8392 | 1 | 313 | 2012 | 15.55666 | 0.6000 | 0 | 204 | 10.09901 | 0.3419 | 0 | 597 | 29.55446 | 0.8192 | 1 | 359 | 1515 | 23.69637 | 0.8791 | 1 | 132 | 456 | 28.947368 | 0.8351 | 1 | 15 | 1890 | 0.7936508 | 0.40130 | 0 | 1243 | 2020 | 61.534653 | 0.77810 | 1 | 816 | 0 | 0.0000000 | 0.1224 | 0 | 34 | 4.1666667 | 0.6664 | 0 | 13 | 730 | 1.780822 | 0.5406 | 0 | 115 | 730 | 15.7534247 | 0.83820 | 1 | 0 | 2020 | 0.0000 | 0.3640 | 0 | 2.70312 | 0.5665 | 1 | 3.27660 | 0.8614 | 3 | 0.77810 | 0.7709 | 1 | 2.53160 | 0.5047 | 1 | 9.28942 | 0.6832 | 6 | 1757 | 720 | 573 | 384 | 1511 | 25.413633 | 0.6427 | 0 | 29 | 717 | 4.044630 | 0.41320 | 0 | 33 | 392 | 8.418367 | 0.03542 | 0 | 116 | 181 | 64.08840 | 0.9086 | 1 | 149 | 573 | 26.00349 | 0.40410 | 0 | 139 | 1313 | 10.586443 | 0.5601 | 0 | 91 | 1533 | 5.936073 | 0.4343 | 0 | 284 | 16.163916 | 0.5169 | 0 | 325 | 18.49744 | 0.28510 | 0 | 164 | 1208.000 | 13.576159 | 0.4127 | 0 | 42 | 359.0000 | 11.6991643 | 0.39980 | 0 | 0 | 1651 | 0.0000000 | 0.09479 | 0 | 1116 | 1757.000 | 63.5173591 | 0.759100 | 1 | 720 | 3 | 0.4166667 | 0.2470 | 0 | 5 | 0.6944444 | 0.5106 | 0 | 9 | 573 | 1.5706806 | 0.46880 | 0 | 57 | 573.000 | 9.947644 | 0.7317 | 0 | 212 | 1757 | 12.0660216 | 0.9549 | 1 | 2.45440 | 0.4888 | 0 | 1.70929 | 0.10250 | 0 | 0.759100 | 0.752700 | 1 | 2.91300 | 0.6862 | 1 | 7.835790 | 0.4802 | 2 | Yes | 0 | 0 | \$0 | 0 | 0 | \$0 | 0 | Census Tract 202, Autauga County, Alabama | 19437 | 138500 | 20154 | 90500 | 22546.92 | 160660 | -2392.92 | -0.1061307 | -70160 | -0.4366986 | 123.78 | 123.37 | Autauga County, Alabama | Montgomery-Alexander City, AL CSA | CS388 |
| 01001020700 | 01001 | 020700 | AL | Alabama | Autauga County | 3 | South Region | 6 | East South Central Division | 2664 | 1254 | 1139 | 710 | 2664 | 26.65165 | 0.6328 | 0 | 29 | 1310 | 2.213741 | 0.05255 | 0 | 134 | 710 | 18.87324 | 0.13890 | 0 | 187 | 429 | 43.58974 | 0.47090 | 0 | 321 | 1139 | 28.18262 | 0.28130 | 0 | 396 | 1852 | 21.382289 | 0.7478 | 0 | 345 | 2878 | 11.98749 | 0.4459 | 0 | 389 | 14.60210 | 0.6417 | 0 | 599 | 22.48499 | 0.4007 | 0 | 510 | 2168 | 23.52399 | 0.8752 | 1 | 228 | 712 | 32.022472 | 0.8712 | 1 | 0 | 2480 | 0.0000000 | 0.09298 | 0 | 694 | 2664 | 26.051051 | 0.51380 | 0 | 1254 | 8 | 0.6379585 | 0.2931 | 0 | 460 | 36.6826156 | 0.9714 | 1 | 0 | 1139 | 0.000000 | 0.1238 | 0 | 125 | 1139 | 10.9745391 | 0.74770 | 0 | 0 | 2664 | 0.0000 | 0.3640 | 0 | 2.16035 | 0.4069 | 0 | 2.88178 | 0.6997 | 2 | 0.51380 | 0.5090 | 0 | 2.50000 | 0.4882 | 1 | 8.05593 | 0.5185 | 3 | 3562 | 1313 | 1248 | 1370 | 3528 | 38.832200 | 0.8512 | 1 | 128 | 1562 | 8.194622 | 0.79350 | 1 | 168 | 844 | 19.905213 | 0.44510 | 0 | 237 | 404 | 58.66337 | 0.8359 | 1 | 405 | 1248 | 32.45192 | 0.60420 | 0 | 396 | 2211 | 17.910448 | 0.7857 | 1 | 444 | 3547 | 12.517620 | 0.7758 | 1 | 355 | 9.966311 | 0.1800 | 0 | 954 | 26.78271 | 0.79230 | 1 | 629 | 2593.000 | 24.257617 | 0.8730 | 1 | 171 | 797.0000 | 21.4554580 | 0.71860 | 0 | 0 | 3211 | 0.0000000 | 0.09479 | 0 | 1009 | 3562.000 | 28.3267827 | 0.466800 | 0 | 1313 | 14 | 1.0662605 | 0.3165 | 0 | 443 | 33.7395278 | 0.9663 | 1 | 73 | 1248 | 5.8493590 | 0.82110 | 1 | 17 | 1248.000 | 1.362180 | 0.1554 | 0 | 112 | 3562 | 3.1443010 | 0.8514 | 1 | 3.81040 | 0.8569 | 4 | 2.65869 | 0.58470 | 2 | 0.466800 | 0.462900 | 0 | 3.11070 | 0.7714 | 3 | 10.046590 | 0.7851 | 9 | Yes | 0 | 0 | \$0 | 0 | 0 | \$0 | 0 | Census Tract 207, Autauga County, Alabama | 22114 | 93800 | 20934 | 82400 | 25652.24 | 108808 | -4718.24 | -0.1839309 | -26408 | -0.2427027 | 95.94 | 108.47 | Autauga County, Alabama | Montgomery-Alexander City, AL CSA | CS388 |
| 01001021100 | 01001 | 021100 | AL | Alabama | Autauga County | 3 | South Region | 6 | East South Central Division | 3298 | 1502 | 1323 | 860 | 3298 | 26.07641 | 0.6211 | 0 | 297 | 1605 | 18.504673 | 0.94340 | 1 | 250 | 1016 | 24.60630 | 0.32070 | 0 | 74 | 307 | 24.10423 | 0.11920 | 0 | 324 | 1323 | 24.48980 | 0.17380 | 0 | 710 | 2231 | 31.824294 | 0.8976 | 1 | 654 | 3565 | 18.34502 | 0.7018 | 0 | 411 | 12.46210 | 0.5001 | 0 | 738 | 22.37720 | 0.3934 | 0 | 936 | 2861 | 32.71583 | 0.9807 | 1 | 138 | 825 | 16.727273 | 0.5715 | 0 | 9 | 3155 | 0.2852615 | 0.25010 | 0 | 1979 | 3298 | 60.006064 | 0.77030 | 1 | 1502 | 14 | 0.9320905 | 0.3234 | 0 | 659 | 43.8748336 | 0.9849 | 1 | 44 | 1323 | 3.325775 | 0.7062 | 0 | 137 | 1323 | 10.3552532 | 0.73130 | 0 | 0 | 3298 | 0.0000 | 0.3640 | 0 | 3.33770 | 0.7351 | 2 | 2.69580 | 0.6028 | 1 | 0.77030 | 0.7631 | 1 | 3.10980 | 0.7827 | 1 | 9.91360 | 0.7557 | 5 | 3499 | 1825 | 1462 | 1760 | 3499 | 50.300086 | 0.9396 | 1 | 42 | 966 | 4.347826 | 0.45390 | 0 | 426 | 1274 | 33.437991 | 0.85200 | 1 | 52 | 188 | 27.65957 | 0.1824 | 0 | 478 | 1462 | 32.69494 | 0.61110 | 0 | 422 | 2488 | 16.961415 | 0.7638 | 1 | 497 | 3499 | 14.204058 | 0.8246 | 1 | 853 | 24.378394 | 0.8688 | 1 | 808 | 23.09231 | 0.58290 | 0 | 908 | 2691.100 | 33.740844 | 0.9808 | 1 | 179 | 811.6985 | 22.0525243 | 0.73230 | 0 | 8 | 3248 | 0.2463054 | 0.26220 | 0 | 1986 | 3498.713 | 56.7637257 | 0.717500 | 0 | 1825 | 29 | 1.5890411 | 0.3551 | 0 | 576 | 31.5616438 | 0.9594 | 1 | 88 | 1462 | 6.0191518 | 0.82690 | 1 | 148 | 1461.993 | 10.123166 | 0.7364 | 0 | 38 | 3499 | 1.0860246 | 0.7013 | 0 | 3.59300 | 0.8073 | 3 | 3.42700 | 0.91560 | 2 | 0.717500 | 0.711400 | 0 | 3.57910 | 0.9216 | 2 | 11.316600 | 0.9150 | 7 | Yes | 0 | 0 | \$0 | 0 | 0 | \$0 | 0 | Census Tract 211, Autauga County, Alabama | 17997 | 74000 | 20620 | 88600 | 20876.52 | 85840 | -256.52 | -0.0122875 | 2760 | 0.0321528 | 134.13 | 145.41 | Autauga County, Alabama | Montgomery-Alexander City, AL CSA | CS388 |
| 01003010200 | 01003 | 010200 | AL | Alabama | Baldwin County | 3 | South Region | 6 | East South Central Division | 2612 | 1220 | 1074 | 338 | 2605 | 12.97505 | 0.2907 | 0 | 44 | 1193 | 3.688181 | 0.14720 | 0 | 172 | 928 | 18.53448 | 0.13090 | 0 | 31 | 146 | 21.23288 | 0.09299 | 0 | 203 | 1074 | 18.90130 | 0.05657 | 0 | 455 | 1872 | 24.305556 | 0.8016 | 1 | 456 | 2730 | 16.70330 | 0.6445 | 0 | 401 | 15.35222 | 0.6847 | 0 | 563 | 21.55436 | 0.3406 | 0 | 410 | 2038 | 20.11776 | 0.7755 | 1 | 64 | 779 | 8.215661 | 0.2181 | 0 | 0 | 2510 | 0.0000000 | 0.09298 | 0 | 329 | 2612 | 12.595712 | 0.31130 | 0 | 1220 | 38 | 3.1147541 | 0.4648 | 0 | 385 | 31.5573770 | 0.9545 | 1 | 20 | 1074 | 1.862197 | 0.5509 | 0 | 43 | 1074 | 4.0037244 | 0.40880 | 0 | 0 | 2612 | 0.0000 | 0.3640 | 0 | 1.94057 | 0.3398 | 1 | 2.11188 | 0.2802 | 1 | 0.31130 | 0.3084 | 0 | 2.74300 | 0.6129 | 1 | 7.10675 | 0.3771 | 3 | 2928 | 1312 | 1176 | 884 | 2928 | 30.191257 | 0.7334 | 0 | 29 | 1459 | 1.987663 | 0.13560 | 0 | 71 | 830 | 8.554217 | 0.03726 | 0 | 134 | 346 | 38.72832 | 0.3964 | 0 | 205 | 1176 | 17.43197 | 0.12010 | 0 | 294 | 2052 | 14.327485 | 0.6940 | 0 | 219 | 2925 | 7.487179 | 0.5423 | 0 | 556 | 18.989071 | 0.6705 | 0 | 699 | 23.87295 | 0.63390 | 0 | 489 | 2226.455 | 21.963167 | 0.8122 | 1 | 191 | 783.8820 | 24.3659136 | 0.77990 | 1 | 0 | 2710 | 0.0000000 | 0.09479 | 0 | 398 | 2927.519 | 13.5951280 | 0.251100 | 0 | 1312 | 13 | 0.9908537 | 0.3111 | 0 | 400 | 30.4878049 | 0.9557 | 1 | 6 | 1176 | 0.5102041 | 0.25900 | 0 | 81 | 1176.202 | 6.886570 | 0.6115 | 0 | 7 | 2928 | 0.2390710 | 0.4961 | 0 | 2.22540 | 0.4183 | 0 | 2.99129 | 0.76340 | 2 | 0.251100 | 0.249000 | 0 | 2.63340 | 0.5496 | 1 | 8.101190 | 0.5207 | 3 | Yes | 0 | 0 | \$0 | 1 | 408000 | \$408,000 | 1 | Census Tract 102, Baldwin County, Alabama | 23862 | 103200 | 26085 | 136900 | 27679.92 | 119712 | -1594.92 | -0.0576201 | 17188 | 0.1435779 | 128.38 | 166.27 | Baldwin County, Alabama | Mobile-Daphne-Fairhope, AL CSA | CS380 |
| 01003010500 | 01003 | 010500 | AL | Alabama | Baldwin County | 3 | South Region | 6 | East South Central Division | 4230 | 1779 | 1425 | 498 | 3443 | 14.46413 | 0.3337 | 0 | 166 | 1625 | 10.215385 | 0.71790 | 0 | 151 | 1069 | 14.12535 | 0.04638 | 0 | 196 | 356 | 55.05618 | 0.73830 | 0 | 347 | 1425 | 24.35088 | 0.17010 | 0 | 707 | 2945 | 24.006791 | 0.7967 | 1 | 528 | 4001 | 13.19670 | 0.5005 | 0 | 619 | 14.63357 | 0.6436 | 0 | 790 | 18.67612 | 0.1937 | 0 | 536 | 3096 | 17.31266 | 0.6572 | 0 | 165 | 920 | 17.934783 | 0.6102 | 0 | 20 | 4021 | 0.4973887 | 0.32320 | 0 | 754 | 4230 | 17.825059 | 0.40230 | 0 | 1779 | 97 | 5.4525014 | 0.5525 | 0 | 8 | 0.4496908 | 0.4600 | 0 | 63 | 1425 | 4.421053 | 0.7762 | 1 | 90 | 1425 | 6.3157895 | 0.56910 | 0 | 787 | 4230 | 18.6052 | 0.9649 | 1 | 2.51890 | 0.5121 | 1 | 2.42790 | 0.4539 | 0 | 0.40230 | 0.3986 | 0 | 3.32270 | 0.8628 | 2 | 8.67180 | 0.6054 | 3 | 5877 | 1975 | 1836 | 820 | 5244 | 15.636918 | 0.3902 | 0 | 90 | 2583 | 3.484321 | 0.33610 | 0 | 159 | 1345 | 11.821561 | 0.10530 | 0 | 139 | 491 | 28.30957 | 0.1924 | 0 | 298 | 1836 | 16.23094 | 0.09053 | 0 | 570 | 4248 | 13.418079 | 0.6669 | 0 | 353 | 5247 | 6.727654 | 0.4924 | 0 | 1109 | 18.870172 | 0.6645 | 0 | 1144 | 19.46571 | 0.34110 | 0 | 717 | 4102.545 | 17.476956 | 0.6332 | 0 | 103 | 1286.1180 | 8.0085961 | 0.23410 | 0 | 0 | 5639 | 0.0000000 | 0.09479 | 0 | 868 | 5877.481 | 14.7682323 | 0.270900 | 0 | 1975 | 26 | 1.3164557 | 0.3359 | 0 | 45 | 2.2784810 | 0.6271 | 0 | 9 | 1836 | 0.4901961 | 0.25400 | 0 | 116 | 1835.798 | 6.318779 | 0.5811 | 0 | 633 | 5877 | 10.7708014 | 0.9507 | 1 | 1.97613 | 0.3410 | 0 | 1.96769 | 0.19610 | 0 | 0.270900 | 0.268600 | 0 | 2.74880 | 0.6077 | 1 | 6.963520 | 0.3406 | 1 | Yes | 0 | 0 | \$0 | 0 | 0 | \$0 | 0 | Census Tract 105, Baldwin County, Alabama | 21585 | 121100 | 28301 | 148500 | 25038.60 | 140476 | 3262.40 | 0.1302948 | 8024 | 0.0571201 | 191.57 | 213.49 | Baldwin County, Alabama | Mobile-Daphne-Fairhope, AL CSA | CS380 |
| 01003010600 | 01003 | 010600 | AL | Alabama | Baldwin County | 3 | South Region | 6 | East South Central Division | 3724 | 1440 | 1147 | 1973 | 3724 | 52.98067 | 0.9342 | 1 | 142 | 1439 | 9.867964 | 0.69680 | 0 | 235 | 688 | 34.15698 | 0.62950 | 0 | 187 | 459 | 40.74074 | 0.40290 | 0 | 422 | 1147 | 36.79163 | 0.55150 | 0 | 497 | 1876 | 26.492537 | 0.8354 | 1 | 511 | 3661 | 13.95794 | 0.5334 | 0 | 246 | 6.60580 | 0.1481 | 0 | 1256 | 33.72718 | 0.9305 | 1 | 496 | 2522 | 19.66693 | 0.7587 | 1 | 274 | 838 | 32.696897 | 0.8779 | 1 | 32 | 3479 | 0.9198045 | 0.42810 | 0 | 2606 | 3724 | 69.978518 | 0.81840 | 1 | 1440 | 21 | 1.4583333 | 0.3683 | 0 | 321 | 22.2916667 | 0.9036 | 1 | 97 | 1147 | 8.456844 | 0.8956 | 1 | 167 | 1147 | 14.5597210 | 0.82090 | 1 | 0 | 3724 | 0.0000 | 0.3640 | 0 | 3.55130 | 0.7859 | 2 | 3.14330 | 0.8145 | 3 | 0.81840 | 0.8108 | 1 | 3.35240 | 0.8725 | 3 | 10.86540 | 0.8550 | 9 | 4115 | 1534 | 1268 | 1676 | 3997 | 41.931449 | 0.8814 | 1 | 294 | 1809 | 16.252073 | 0.96740 | 1 | 341 | 814 | 41.891892 | 0.94320 | 1 | 204 | 454 | 44.93392 | 0.5438 | 0 | 545 | 1268 | 42.98107 | 0.83620 | 1 | 624 | 2425 | 25.731959 | 0.9002 | 1 | 994 | 4115 | 24.155529 | 0.9602 | 1 | 642 | 15.601458 | 0.4841 | 0 | 1126 | 27.36331 | 0.81750 | 1 | 568 | 2989.000 | 19.003011 | 0.7045 | 0 | 212 | 715.0000 | 29.6503497 | 0.85920 | 1 | 56 | 3825 | 1.4640523 | 0.53120 | 0 | 2715 | 4115.000 | 65.9781288 | 0.773200 | 1 | 1534 | 0 | 0.0000000 | 0.1079 | 0 | 529 | 34.4850065 | 0.9685 | 1 | 101 | 1268 | 7.9652997 | 0.87950 | 1 | 89 | 1268.000 | 7.018927 | 0.6184 | 0 | 17 | 4115 | 0.4131227 | 0.5707 | 0 | 4.54540 | 0.9754 | 5 | 3.39650 | 0.90810 | 2 | 0.773200 | 0.766700 | 1 | 3.14500 | 0.7858 | 2 | 11.860100 | 0.9520 | 10 | Yes | 0 | 0 | \$0 | 1 | 8000000 | \$8,000,000 | 1 | Census Tract 106, Baldwin County, Alabama | 17788 | 81600 | 16453 | 104700 | 20634.08 | 94656 | -4181.08 | -0.2026298 | 10044 | 0.1061105 | NA | NA | Baldwin County, Alabama | Mobile-Daphne-Fairhope, AL CSA | CS380 |
| 01003011000 | 01003 | 011000 | AL | Alabama | Baldwin County | 3 | South Region | 6 | East South Central Division | 3758 | 2012 | 1576 | 1053 | 3758 | 28.02022 | 0.6597 | 0 | 66 | 1707 | 3.866432 | 0.16250 | 0 | 293 | 1297 | 22.59059 | 0.25080 | 0 | 83 | 279 | 29.74910 | 0.19030 | 0 | 376 | 1576 | 23.85787 | 0.15710 | 0 | 744 | 2723 | 27.322806 | 0.8465 | 1 | 996 | 4137 | 24.07542 | 0.8462 | 1 | 713 | 18.97286 | 0.8429 | 1 | 804 | 21.39436 | 0.3306 | 0 | 763 | 3295 | 23.15630 | 0.8670 | 1 | 155 | 1145 | 13.537118 | 0.4538 | 0 | 50 | 3475 | 1.4388489 | 0.51460 | 0 | 516 | 3758 | 13.730708 | 0.33300 | 0 | 2012 | 0 | 0.0000000 | 0.1224 | 0 | 606 | 30.1192843 | 0.9484 | 1 | 42 | 1576 | 2.664975 | 0.6476 | 0 | 96 | 1576 | 6.0913706 | 0.55620 | 0 | 0 | 3758 | 0.0000 | 0.3640 | 0 | 2.67200 | 0.5579 | 2 | 3.00890 | 0.7581 | 2 | 0.33300 | 0.3299 | 0 | 2.63860 | 0.5614 | 1 | 8.65250 | 0.6030 | 5 | 4921 | 1979 | 1732 | 1539 | 4908 | 31.356968 | 0.7523 | 1 | 150 | 2105 | 7.125891 | 0.72850 | 0 | 214 | 1471 | 14.547927 | 0.20260 | 0 | 59 | 261 | 22.60536 | 0.1167 | 0 | 273 | 1732 | 15.76212 | 0.07981 | 0 | 936 | 3332 | 28.091237 | 0.9206 | 1 | 861 | 4921 | 17.496444 | 0.8930 | 1 | 1039 | 21.113595 | 0.7653 | 1 | 1183 | 24.03983 | 0.64410 | 0 | 585 | 3738.000 | 15.650080 | 0.5371 | 0 | 81 | 1151.0000 | 7.0373588 | 0.19000 | 0 | 101 | 4546 | 2.2217334 | 0.61440 | 0 | 1244 | 4921.000 | 25.2794148 | 0.427800 | 0 | 1979 | 0 | 0.0000000 | 0.1079 | 0 | 527 | 26.6296109 | 0.9393 | 1 | 83 | 1732 | 4.7921478 | 0.77460 | 1 | 151 | 1732.000 | 8.718245 | 0.6904 | 0 | 20 | 4921 | 0.4064215 | 0.5688 | 0 | 3.37421 | 0.7528 | 3 | 2.75090 | 0.63780 | 1 | 0.427800 | 0.424200 | 0 | 3.08100 | 0.7597 | 2 | 9.633910 | 0.7366 | 6 | Yes | 0 | 0 | \$0 | 0 | 0 | \$0 | 0 | Census Tract 110, Baldwin County, Alabama | 19340 | 126400 | 23679 | 158700 | 22434.40 | 146624 | 1244.60 | 0.0554773 | 12076 | 0.0823603 | 129.69 | 188.85 | Baldwin County, Alabama | Mobile-Daphne-Fairhope, AL CSA | CS380 |
| 01003011406 | 01003 | 011406 | AL | Alabama | Baldwin County | 3 | South Region | 6 | East South Central Division | 3317 | 6418 | 1307 | 583 | 3317 | 17.57612 | 0.4181 | 0 | 70 | 1789 | 3.912800 | 0.16690 | 0 | 221 | 685 | 32.26277 | 0.57540 | 0 | 284 | 622 | 45.65916 | 0.52130 | 0 | 505 | 1307 | 38.63810 | 0.60430 | 0 | 168 | 2255 | 7.450111 | 0.2800 | 0 | 919 | 3677 | 24.99320 | 0.8623 | 1 | 452 | 13.62677 | 0.5791 | 0 | 673 | 20.28942 | 0.2668 | 0 | 366 | 2769 | 13.21777 | 0.4276 | 0 | 96 | 887 | 10.822999 | 0.3359 | 0 | 180 | 3066 | 5.8708415 | 0.77920 | 1 | 473 | 3317 | 14.259873 | 0.34330 | 0 | 6418 | 3976 | 61.9507635 | 0.9655 | 1 | 384 | 5.9831723 | 0.7063 | 0 | 17 | 1307 | 1.300689 | 0.4632 | 0 | 10 | 1307 | 0.7651109 | 0.08684 | 0 | 0 | 3317 | 0.0000 | 0.3640 | 0 | 2.33160 | 0.4577 | 1 | 2.38860 | 0.4323 | 1 | 0.34330 | 0.3401 | 0 | 2.58584 | 0.5335 | 1 | 7.64934 | 0.4576 | 3 | 3226 | 7850 | 1797 | 228 | 3215 | 7.091757 | 0.1241 | 0 | 72 | 2055 | 3.503650 | 0.33910 | 0 | 302 | 1139 | 26.514486 | 0.69300 | 0 | 230 | 658 | 34.95441 | 0.3131 | 0 | 532 | 1797 | 29.60490 | 0.52020 | 0 | 128 | 2726 | 4.695525 | 0.2384 | 0 | 530 | 3226 | 16.429014 | 0.8749 | 1 | 790 | 24.488531 | 0.8715 | 1 | 342 | 10.60136 | 0.05624 | 0 | 280 | 2884.000 | 9.708738 | 0.1832 | 0 | 58 | 792.0000 | 7.3232323 | 0.20270 | 0 | 15 | 3107 | 0.4827808 | 0.34070 | 0 | 15 | 3226.000 | 0.4649721 | 0.002512 | 0 | 7850 | 5394 | 68.7133758 | 0.9706 | 1 | 274 | 3.4904459 | 0.6697 | 0 | 23 | 1797 | 1.2799110 | 0.41980 | 0 | 26 | 1797.000 | 1.446856 | 0.1647 | 0 | 0 | 3226 | 0.0000000 | 0.1831 | 0 | 2.09670 | 0.3785 | 1 | 1.65434 | 0.08785 | 1 | 0.002512 | 0.002491 | 0 | 2.40790 | 0.4381 | 1 | 6.161452 | 0.2215 | 3 | Yes | 0 | 0 | \$0 | 0 | 0 | \$0 | 0 | Census Tract 114.06, Baldwin County, Alabama | 29838 | 252000 | 32201 | 224200 | 34612.08 | 292320 | -2411.08 | -0.0696601 | -68120 | -0.2330323 | NA | NA | Baldwin County, Alabama | Mobile-Daphne-Fairhope, AL CSA | CS380 |
| 01003011407 | 01003 | 011407 | AL | Alabama | Baldwin County | 3 | South Region | 6 | East South Central Division | 5187 | 6687 | 2066 | 1404 | 5172 | 27.14617 | 0.6423 | 0 | 172 | 1935 | 8.888889 | 0.63280 | 0 | 482 | 1433 | 33.63573 | 0.61530 | 0 | 367 | 633 | 57.97788 | 0.79510 | 1 | 849 | 2066 | 41.09390 | 0.67110 | 0 | 278 | 3618 | 7.683803 | 0.2906 | 0 | 1027 | 4945 | 20.76845 | 0.7735 | 1 | 1398 | 26.95200 | 0.9629 | 1 | 1263 | 24.34933 | 0.5302 | 0 | 596 | 3792 | 15.71730 | 0.5759 | 0 | 158 | 1633 | 9.675444 | 0.2833 | 0 | 29 | 4867 | 0.5958496 | 0.35240 | 0 | 170 | 5187 | 3.277424 | 0.07984 | 0 | 6687 | 2772 | 41.4535666 | 0.9251 | 1 | 197 | 2.9460147 | 0.6326 | 0 | 90 | 2066 | 4.356244 | 0.7729 | 1 | 0 | 2066 | 0.0000000 | 0.02586 | 0 | 0 | 5187 | 0.0000 | 0.3640 | 0 | 3.01030 | 0.6516 | 1 | 2.70470 | 0.6077 | 1 | 0.07984 | 0.0791 | 0 | 2.72046 | 0.6014 | 2 | 8.51530 | 0.5852 | 4 | 5608 | 7576 | 2543 | 1058 | 5602 | 18.886112 | 0.4835 | 0 | 32 | 2631 | 1.216268 | 0.05882 | 0 | 581 | 1979 | 29.358262 | 0.77080 | 1 | 309 | 564 | 54.78723 | 0.7671 | 1 | 890 | 2543 | 34.99803 | 0.67250 | 0 | 230 | 4433 | 5.188360 | 0.2698 | 0 | 776 | 5602 | 13.852196 | 0.8156 | 1 | 1527 | 27.228959 | 0.9205 | 1 | 567 | 10.11056 | 0.05099 | 0 | 615 | 5035.000 | 12.214498 | 0.3295 | 0 | 16 | 1746.0000 | 0.9163803 | 0.01566 | 0 | 0 | 5573 | 0.0000000 | 0.09479 | 0 | 441 | 5608.000 | 7.8637660 | 0.140300 | 0 | 7576 | 3055 | 40.3247096 | 0.9148 | 1 | 72 | 0.9503696 | 0.5383 | 0 | 0 | 2543 | 0.0000000 | 0.09796 | 0 | 125 | 2543.000 | 4.915454 | 0.4934 | 0 | 6 | 5608 | 0.1069900 | 0.4054 | 0 | 2.30022 | 0.4418 | 1 | 1.41144 | 0.04295 | 1 | 0.140300 | 0.139100 | 0 | 2.44986 | 0.4589 | 1 | 6.301820 | 0.2416 | 3 | Yes | 0 | 0 | \$0 | 0 | 0 | \$0 | 0 | Census Tract 114.07, Baldwin County, Alabama | 22317 | 292600 | 28418 | 241100 | 25887.72 | 339416 | 2530.28 | 0.0977406 | -98316 | -0.2896622 | NA | NA | Baldwin County, Alabama | Mobile-Daphne-Fairhope, AL CSA | CS380 |
| 01003011502 | 01003 | 011502 | AL | Alabama | Baldwin County | 3 | South Region | 6 | East South Central Division | 9234 | 4606 | 3702 | 3160 | 9213 | 34.29936 | 0.7632 | 1 | 282 | 4002 | 7.046477 | 0.47570 | 0 | 526 | 2158 | 24.37442 | 0.31260 | 0 | 582 | 1544 | 37.69430 | 0.33410 | 0 | 1108 | 3702 | 29.92977 | 0.33740 | 0 | 997 | 6176 | 16.143135 | 0.6201 | 0 | 2074 | 10111 | 20.51231 | 0.7670 | 1 | 1450 | 15.70284 | 0.7043 | 0 | 2491 | 26.97639 | 0.6984 | 0 | 1542 | 7577 | 20.35106 | 0.7842 | 1 | 684 | 2718 | 25.165563 | 0.7767 | 1 | 532 | 8697 | 6.1170519 | 0.78590 | 1 | 3275 | 9234 | 35.466753 | 0.60970 | 0 | 4606 | 214 | 4.6461138 | 0.5268 | 0 | 828 | 17.9765523 | 0.8689 | 1 | 89 | 3702 | 2.404106 | 0.6192 | 0 | 293 | 3702 | 7.9146407 | 0.64700 | 0 | 0 | 9234 | 0.0000 | 0.3640 | 0 | 2.96340 | 0.6387 | 2 | 3.74950 | 0.9623 | 3 | 0.60970 | 0.6040 | 0 | 3.02590 | 0.7475 | 1 | 10.34850 | 0.8024 | 6 | 14165 | 6867 | 6002 | 2853 | 14165 | 20.141193 | 0.5175 | 0 | 313 | 7047 | 4.441606 | 0.46620 | 0 | 1181 | 4164 | 28.362152 | 0.74500 | 0 | 887 | 1838 | 48.25898 | 0.6211 | 0 | 2068 | 6002 | 34.45518 | 0.65900 | 0 | 1667 | 10750 | 15.506977 | 0.7286 | 0 | 2527 | 14165 | 17.839746 | 0.8980 | 1 | 3082 | 21.757854 | 0.7907 | 1 | 2506 | 17.69149 | 0.24240 | 0 | 3004 | 11659.000 | 25.765503 | 0.9038 | 1 | 407 | 3482.0000 | 11.6886847 | 0.39940 | 0 | 364 | 13519 | 2.6925068 | 0.65290 | 0 | 2755 | 14165.000 | 19.4493470 | 0.346300 | 0 | 6867 | 441 | 6.4220183 | 0.5555 | 0 | 526 | 7.6598223 | 0.7585 | 1 | 93 | 6002 | 1.5494835 | 0.46540 | 0 | 184 | 6002.000 | 3.065645 | 0.3373 | 0 | 0 | 14165 | 0.0000000 | 0.1831 | 0 | 3.26930 | 0.7261 | 1 | 2.98920 | 0.76250 | 2 | 0.346300 | 0.343400 | 0 | 2.29980 | 0.3856 | 1 | 8.904600 | 0.6398 | 4 | Yes | 0 | 0 | \$0 | 2 | 8860000 | \$8,860,000 | 1 | Census Tract 115.02, Baldwin County, Alabama | 20411 | 162700 | 22820 | 180400 | 23676.76 | 188732 | -856.76 | -0.0361857 | -8332 | -0.0441473 | NA | NA | Baldwin County, Alabama | Mobile-Daphne-Fairhope, AL CSA | CS380 |
LIHTC Data
svi_divisional_lihtc_df0 <- left_join(svi_divisional_lihtc, census_pull_df, join_by("GEOID_2010_trt" == "GEOID"))

svi_divisional_lihtc_df1 <- left_join(svi_divisional_lihtc_df0, hpi_df_10_20, join_by("GEOID_2010_trt" == "GEOID10")) %>%
                          unite("county_fips", FIPS_st, FIPS_county, sep = "")

svi_divisional_lihtc_df <- left_join(svi_divisional_lihtc_df1, msa_csa_crosswalk, join_by("county_fips" == "county_fips"))

svi_divisional_lihtc_df %>% head(10) %>% kbl() %>% kable_styling() %>% scroll_box(width = "100%")
| GEOID_2010_trt | county_fips | FIPS_tract | state | state_name | county | region_number | region | division_number | division | E_TOTPOP_10 | E_HU_10 | E_HH_10 | E_POV150_10 | ET_POVSTATUS_10 | EP_POV150_10 | EPL_POV150_10 | F_POV150_10 | E_UNEMP_10 | ET_EMPSTATUS_10 | EP_UNEMP_10 | EPL_UNEMP_10 | F_UNEMP_10 | E_HBURD_OWN_10 | ET_HOUSINGCOST_OWN_10 | EP_HBURD_OWN_10 | EPL_HBURD_OWN_10 | F_HBURD_OWN_10 | E_HBURD_RENT_10 | ET_HOUSINGCOST_RENT_10 | EP_HBURD_RENT_10 | EPL_HBURD_RENT_10 | F_HBURD_RENT_10 | E_HBURD_10 | ET_HOUSINGCOST_10 | EP_HBURD_10 | EPL_HBURD_10 | F_HBURD_10 | E_NOHSDP_10 | ET_EDSTATUS_10 | EP_NOHSDP_10 | EPL_NOHSDP_10 | F_NOHSDP_10 | E_UNINSUR_12 | ET_INSURSTATUS_12 | EP_UNINSUR_12 | EPL_UNINSUR_12 | F_UNINSUR_12 | E_AGE65_10 | EP_AGE65_10 | EPL_AGE65_10 | F_AGE65_10 | E_AGE17_10 | EP_AGE17_10 | EPL_AGE17_10 | F_AGE17_10 | E_DISABL_12 | ET_DISABLSTATUS_12 | EP_DISABL_12 | EPL_DISABL_12 | F_DISABL_12 | E_SNGPNT_10 | ET_FAMILIES_10 | EP_SNGPNT_10 | EPL_SNGPNT_10 | F_SNGPNT_10 | E_LIMENG_10 | ET_POPAGE5UP_10 | EP_LIMENG_10 | EPL_LIMENG_10 | F_LIMENG_10 | E_MINRTY_10 | ET_POPETHRACE_10 | EP_MINRTY_10 | EPL_MINRTY_10 | F_MINRTY_10 | E_STRHU_10 | E_MUNIT_10 | EP_MUNIT_10 | EPL_MUNIT_10 | F_MUNIT_10 | E_MOBILE_10 | EP_MOBILE_10 | EPL_MOBILE_10 | F_MOBILE_10 | E_CROWD_10 | ET_OCCUPANTS_10 | EP_CROWD_10 | EPL_CROWD_10 | F_CROWD_10 | E_NOVEH_10 | ET_KNOWNVEH_10 | EP_NOVEH_10 | EPL_NOVEH_10 | F_NOVEH_10 | E_GROUPQ_10 | ET_HHTYPE_10 | EP_GROUPQ_10 | EPL_GROUPQ_10 | F_GROUPQ_10 | SPL_THEME1_10 | RPL_THEME1_10 | F_THEME1_10 | SPL_THEME2_10 | RPL_THEME2_10 | F_THEME2_10 | SPL_THEME3_10 | RPL_THEME3_10 | F_THEME3_10 | SPL_THEME4_10 | RPL_THEME4_10 | F_THEME4_10 | SPL_THEMES_10 | RPL_THEMES_10 | F_TOTAL_10 | E_TOTPOP_20 | E_HU_20 | E_HH_20 | E_POV150_20 | ET_POVSTATUS_20 | EP_POV150_20 | EPL_POV150_20 | F_POV150_20 | E_UNEMP_20 | ET_EMPSTATUS_20 | EP_UNEMP_20 | EPL_UNEMP_20 | F_UNEMP_20 | E_HBURD_OWN_20 | ET_HOUSINGCOST_OWN_20 | EP_HBURD_OWN_20 | EPL_HBURD_OWN_20 | F_HBURD_OWN_20 | E_HBURD_RENT_20 | ET_HOUSINGCOST_RENT_20 | EP_HBURD_RENT_20 | EPL_HBURD_RENT_20 | F_HBURD_RENT_20 | E_HBURD_20 | ET_HOUSINGCOST_20 | EP_HBURD_20 | EPL_HBURD_20 | F_HBURD_20 | E_NOHSDP_20 | ET_EDSTATUS_20 | EP_NOHSDP_20 | EPL_NOHSDP_20 | F_NOHSDP_20 | E_UNINSUR_20 | ET_INSURSTATUS_20 | EP_UNINSUR_20 | EPL_UNINSUR_20 | F_UNINSUR_20 | E_AGE65_20 | EP_AGE65_20 | EPL_AGE65_20 | F_AGE65_20 | E_AGE17_20 | EP_AGE17_20 | EPL_AGE17_20 | F_AGE17_20 | E_DISABL_20 | ET_DISABLSTATUS_20 | EP_DISABL_20 | EPL_DISABL_20 | F_DISABL_20 | E_SNGPNT_20 | ET_FAMILIES_20 | EP_SNGPNT_20 | EPL_SNGPNT_20 | F_SNGPNT_20 | E_LIMENG_20 | ET_POPAGE5UP_20 | EP_LIMENG_20 | EPL_LIMENG_20 | F_LIMENG_20 | E_MINRTY_20 | ET_POPETHRACE_20 | EP_MINRTY_20 | EPL_MINRTY_20 | F_MINRTY_20 | E_STRHU_20 | E_MUNIT_20 | EP_MUNIT_20 | EPL_MUNIT_20 | F_MUNIT_20 | E_MOBILE_20 | EP_MOBILE_20 | EPL_MOBILE_20 | F_MOBILE_20 | E_CROWD_20 | ET_OCCUPANTS_20 | EP_CROWD_20 | EPL_CROWD_20 | F_CROWD_20 | E_NOVEH_20 | ET_KNOWNVEH_20 | EP_NOVEH_20 | EPL_NOVEH_20 | F_NOVEH_20 | E_GROUPQ_20 | ET_HHTYPE_20 | EP_GROUPQ_20 | EPL_GROUPQ_20 | F_GROUPQ_20 | SPL_THEME1_20 | RPL_THEME1_20 | F_THEME1_20 | SPL_THEME2_20 | RPL_THEME2_20 | F_THEME2_20 | SPL_THEME3_20 | RPL_THEME3_20 | F_THEME3_20 | SPL_THEME4_20 | RPL_THEME4_20 | F_THEME4_20 | SPL_THEMES_20 | RPL_THEMES_20 | F_TOTAL_20 | pre10_lihtc_project_cnt | pre10_lihtc_project_dollars | post10_lihtc_project_cnt | post10_lihtc_project_dollars | lihtc_flag | lihtc_eligibility | NAME | Median_Income_10 | Median_Home_Value_10 | Median_Income_19 | Median_Home_Value_19 | Median_Income_10adj | Median_Home_Value_10adj | Median_Income_Change | Median_Income_Change_pct | Median_Home_Value_Change | Median_Home_Value_Change_pct | housing_price_index10 | housing_price_index20 | county_title | cbsa | cbsa_code |
|---|---|---|---|---|---|---|---|---|---|---|---|---|---|---|---|---|---|---|---|---|---|---|---|---|---|---|---|---|---|---|---|---|---|---|---|---|---|---|---|---|---|---|---|---|---|---|---|---|---|---|---|---|---|---|---|---|---|---|---|---|---|---|---|---|---|---|---|---|---|---|---|---|---|---|---|---|---|---|---|---|---|---|---|---|---|---|---|---|---|---|---|---|---|---|---|---|---|---|---|---|---|---|---|---|---|---|---|---|---|---|---|---|---|---|---|---|---|---|---|---|---|---|---|---|---|---|---|---|---|---|---|---|---|---|---|---|---|---|---|---|---|---|---|---|---|---|---|---|---|---|---|---|---|---|---|---|---|---|---|---|---|---|---|---|---|---|---|---|---|---|---|---|---|---|---|---|---|---|---|---|---|---|---|---|---|---|---|---|---|---|---|---|---|---|---|---|---|---|---|---|---|---|---|---|---|---|---|---|---|---|---|---|---|---|---|---|---|---|---|---|---|---|---|---|---|---|---|---|---|---|---|---|---|---|---|---|---|---|---|---|---|
| 02050000100 | 02050 | 000100 | AK | Alaska | Bethel Census Area | 4 | West Region | 9 | Pacific Division | 9481 | 2776 | 2127 | 4499 | 9422 | 47.74995 | 0.9162 | 1 | 923 | 3537 | 26.095561 | 0.9936 | 1 | 224 | 1570 | 14.26752 | 0.010260 | 0 | 35 | 557 | 6.283663 | 0.012980 | 0 | 259 | 2127 | 12.17677 | 0.003169 | 0 | 1431 | 4685 | 30.544290 | 0.8055 | 1 | 2901 | 9557 | 30.354714 | 0.89790 | 1 | 688 | 7.256619 | 0.24940 | 0 | 3678 | 38.79338 | 0.97710 | 1 | 1085 | 5745 | 18.88599 | 0.8446 | 1 | 418 | 1677 | 24.92546 | 0.7894 | 1 | 771 | 8382 | 9.1982820 | 0.64930 | 0 | 9146 | 9481 | 96.46662 | 0.9412 | 1 | 2776 | 3 | 0.1080692 | 0.18850 | 0 | 14 | 0.5043228 | 0.5274 | 0 | 992 | 2127 | 46.638458 | 0.99440 | 1 | 1814 | 2127 | 85.28444 | 0.9993 | 1 | 0 | 9481 | 0.000000 | 0.3743 | 0 | 3.616369 | 0.7794 | 4 | 3.50980 | 0.9107 | 3 | 0.9412 | 0.9315 | 1 | 3.08390 | 0.7535 | 2 | 11.15127 | 0.8587 | 10 | 10311 | 2692 | 2104 | 5779 | 10267 | 56.28713 | 0.9839 | 1 | 870 | 3667 | 23.725116 | 0.9967 | 1 | 232 | 1494 | 15.52878 | 0.05333 | 0 | 95 | 610 | 15.57377 | 0.02547 | 0 | 327 | 2104 | 15.54183 | 0.009597 | 0 | 1228 | 5181 | 23.701988 | 0.78920 | 1 | 1639 | 10294 | 15.921896 | 0.9319 | 1 | 812 | 7.875085 | 0.12960 | 0 | 4008 | 38.87111 | 0.99260 | 1 | 1259 | 6286.0000 | 20.028635 | 0.85600 | 1 | 483 | 1769.0000 | 27.30356 | 0.8759 | 1 | 188 | 9020 | 2.0842572 | 0.31690 | 0 | 10181 | 10311.000 | 98.73921 | 0.9760 | 1 | 2692 | 1 | 0.0371471 | 0.16590 | 0 | 31 | 1.1515602 | 0.6200 | 0 | 1024 | 2104 | 48.669201 | 0.9978 | 1 | 1793 | 2104.0000 | 85.218631 | 0.9993 | 1 | 477 | 10311 | 4.6261274 | 0.9233 | 1 | 3.711297 | 0.8199 | 4 | 3.17100 | 0.82060 | 3 | 0.9760 | 0.9674 | 1 | 3.70630 | 0.9326 | 3 | 11.56460 | 0.9233 | 11 | 0 | 0 | 0 | 0 | 0 | Yes | Census Tract 1, Bethel Census Area, Alaska | 10580 | 106600 | 10671 | 52100 | 12272.80 | 123656 | -1601.80 | -0.1305163 | -71556 | -0.5786699 | NA | NA | NA | NA | NA |
| 02050000300 | 02050 | 000300 | AK | Alaska | Bethel Census Area | 4 | West Region | 9 | Pacific Division | 1386 | 725 | 439 | 460 | 1383 | 33.26103 | 0.7628 | 1 | 118 | 596 | 19.798658 | 0.9694 | 1 | 38 | 308 | 12.33766 | 0.008283 | 0 | 10 | 131 | 7.633588 | 0.014190 | 0 | 48 | 439 | 10.93394 | 0.002703 | 0 | 168 | 777 | 21.621622 | 0.7013 | 0 | 477 | 1475 | 32.338983 | 0.92130 | 1 | 160 | 11.544011 | 0.55680 | 0 | 464 | 33.47763 | 0.89380 | 1 | 122 | 955 | 12.77487 | 0.5244 | 0 | 99 | 318 | 31.13208 | 0.8947 | 1 | 4 | 1284 | 0.3115265 | 0.08126 | 0 | 1161 | 1386 | 83.76623 | 0.8084 | 1 | 725 | 0 | 0.0000000 | 0.09395 | 0 | 8 | 1.1034483 | 0.6032 | 0 | 90 | 439 | 20.501139 | 0.89560 | 1 | 261 | 439 | 59.45330 | 0.9957 | 1 | 0 | 1386 | 0.000000 | 0.3743 | 0 | 3.357503 | 0.7224 | 3 | 2.95096 | 0.7007 | 2 | 0.8084 | 0.8000 | 1 | 2.96275 | 0.7006 | 2 | 10.07961 | 0.7498 | 8 | 1404 | 742 | 369 | 597 | 1379 | 43.29224 | 0.9267 | 1 | 152 | 646 | 23.529412 | 0.9965 | 1 | 50 | 267 | 18.72659 | 0.11360 | 0 | 27 | 102 | 26.47059 | 0.08218 | 0 | 77 | 369 | 20.86721 | 0.046030 | 0 | 149 | 794 | 18.765743 | 0.71930 | 0 | 345 | 1404 | 24.572650 | 0.9915 | 1 | 115 | 8.190883 | 0.14420 | 0 | 484 | 34.47293 | 0.96900 | 1 | 139 | 920.0005 | 15.108688 | 0.64470 | 0 | 89 | 276.0002 | 32.24635 | 0.9371 | 1 | 6 | 1243 | 0.4827031 | 0.11630 | 0 | 1240 | 1404.000 | 88.31906 | 0.8327 | 1 | 742 | 0 | 0.0000000 | 0.08271 | 0 | 9 | 1.2129380 | 0.6256 | 0 | 112 | 369 | 30.352304 | 0.9725 | 1 | 223 | 369.0005 | 60.433530 | 0.9961 | 1 | 94 | 1404 | 6.6951567 | 0.9478 | 1 | 3.680030 | 0.8126 | 3 | 2.81130 | 0.65190 | 2 | 0.8327 | 0.8253 | 1 | 3.62471 | 0.9189 | 3 | 10.94874 | 0.8637 | 9 | 0 | 0 | 0 | 0 | 0 | Yes | Census Tract 3, Bethel Census Area, Alaska | 14778 | 197900 | 14646 | 160900 | 17142.48 | 229564 | -2496.48 | -0.1456312 | -68664 | -0.2991061 | NA | NA | NA | NA | NA |
| 02070000100 | 02070 | 000100 | AK | Alaska | Dillingham Census Area | 4 | West Region | 9 | Pacific Division | 2569 | 1354 | 584 | 1037 | 2565 | 40.42885 | 0.8513 | 1 | 236 | 853 | 27.667057 | 0.9954 | 1 | 68 | 398 | 17.08543 | 0.016280 | 0 | 34 | 186 | 18.279570 | 0.034550 | 0 | 102 | 584 | 17.46575 | 0.006339 | 0 | 384 | 1303 | 29.470453 | 0.7955 | 1 | 1140 | 2710 | 42.066421 | 0.98140 | 1 | 217 | 8.446867 | 0.33900 | 0 | 940 | 36.59011 | 0.95310 | 1 | 311 | 1728 | 17.99769 | 0.8126 | 1 | 94 | 442 | 21.26697 | 0.7005 | 0 | 203 | 2363 | 8.5907744 | 0.63010 | 0 | 2410 | 2569 | 93.81082 | 0.9081 | 1 | 1354 | 0 | 0.0000000 | 0.09395 | 0 | 14 | 1.0339734 | 0.5974 | 0 | 186 | 584 | 31.849315 | 0.96500 | 1 | 367 | 584 | 62.84247 | 0.9966 | 1 | 0 | 2569 | 0.000000 | 0.3743 | 0 | 3.629939 | 0.7830 | 4 | 3.43530 | 0.8919 | 2 | 0.9081 | 0.8988 | 1 | 3.02725 | 0.7274 | 2 | 11.00059 | 0.8430 | 9 | 2801 | 1444 | 718 | 1191 | 2792 | 42.65759 | 0.9224 | 1 | 183 | 1059 | 17.280453 | 0.9849 | 1 | 94 | 487 | 19.30185 | 0.12840 | 0 | 51 | 231 | 22.07792 | 0.05382 | 0 | 145 | 718 | 20.19499 | 0.039410 | 0 | 265 | 1619 | 16.368129 | 0.67640 | 0 | 552 | 2801 | 19.707247 | 0.9721 | 1 | 353 | 12.602642 | 0.39670 | 0 | 862 | 30.77472 | 0.91140 | 1 | 295 | 1939.1327 | 15.212986 | 0.65170 | 0 | 200 | 579.0000 | 34.54231 | 0.9555 | 1 | 49 | 2513 | 1.9498607 | 0.30380 | 0 | 2536 | 2801.124 | 90.53509 | 0.8619 | 1 | 1444 | 1 | 0.0692521 | 0.16740 | 0 | 10 | 0.6925208 | 0.5747 | 0 | 255 | 718 | 35.515320 | 0.9868 | 1 | 481 | 718.0000 | 66.991643 | 0.9972 | 1 | 230 | 2801 | 8.2113531 | 0.9566 | 1 | 3.595210 | 0.7924 | 3 | 3.21910 | 0.83820 | 2 | 0.8619 | 0.8543 | 1 | 3.68270 | 0.9288 | 3 | 11.35891 | 0.9048 | 9 | 0 | 0 | 0 | 0 | 0 | Yes | Census Tract 1, Dillingham Census Area, Alaska | 10750 | 113500 | 17367 | 85900 | 12470.00 | 131660 | 4897.00 | 0.3927025 | -45760 | -0.3475619 | NA | NA | NA | NA | NA |
| 02122000100 | 02122 | 000100 | AK | Alaska | Kenai Peninsula Borough | 4 | West Region | 9 | Pacific Division | 251 | 428 | 138 | 90 | 251 | 35.85657 | 0.7982 | 1 | 29 | 145 | 20.000000 | 0.9707 | 1 | 54 | 90 | 60.00000 | 0.930300 | 1 | 0 | 48 | 0.000000 | 0.005509 | 0 | 54 | 138 | 39.13043 | 0.301700 | 0 | 21 | 186 | 11.290323 | 0.4631 | 0 | 198 | 460 | 43.043478 | 0.98470 | 1 | 6 | 2.390438 | 0.02129 | 0 | 61 | 24.30279 | 0.49430 | 0 | 56 | 395 | 14.17722 | 0.6201 | 0 | 18 | 57 | 31.57895 | 0.8999 | 1 | 0 | 233 | 0.0000000 | 0.02799 | 0 | 205 | 251 | 81.67331 | 0.7907 | 1 | 428 | 0 | 0.0000000 | 0.09395 | 0 | 20 | 4.6728972 | 0.7396 | 0 | 7 | 138 | 5.072464 | 0.57090 | 0 | 17 | 138 | 12.31884 | 0.8207 | 1 | 0 | 251 | 0.000000 | 0.3743 | 0 | 3.518400 | 0.7575 | 3 | 2.06358 | 0.2722 | 1 | 0.7907 | 0.7826 | 1 | 2.59945 | 0.5334 | 1 | 8.97213 | 0.6292 | 6 | 531 | 307 | 131 | 193 | 523 | 36.90249 | 0.8743 | 1 | 74 | 324 | 22.839506 | 0.9958 | 1 | 23 | 92 | 25.00000 | 0.32780 | 0 | 4 | 39 | 10.25641 | 0.01129 | 0 | 27 | 131 | 20.61069 | 0.043330 | 0 | 6 | 389 | 1.542417 | 0.05899 | 0 | 220 | 523 | 42.065010 | 0.9998 | 1 | 12 | 2.259887 | 0.01198 | 0 | 111 | 20.90395 | 0.43940 | 0 | 50 | 412.0000 | 12.135924 | 0.43280 | 0 | 23 | 72.0000 | 31.94445 | 0.9342 | 1 | 0 | 512 | 0.0000000 | 0.02391 | 0 | 437 | 531.000 | 82.29756 | 0.7611 | 1 | 307 | 0 | 0.0000000 | 0.08271 | 0 | 16 | 5.2117264 | 0.7700 | 1 | 11 | 131 | 8.396947 | 0.6735 | 0 | 42 | 131.0000 | 32.061070 | 0.9796 | 1 | 111 | 531 | 20.9039548 | 0.9772 | 1 | 2.972220 | 0.6420 | 3 | 1.84229 | 0.16030 | 1 | 0.7611 | 0.7544 | 1 | 3.48301 | 0.8841 | 3 | 9.05862 | 0.6447 | 8 | 0 | 0 | 0 | 0 | 0 | Yes | Census Tract 1, Kenai Peninsula Borough, Alaska | 22885 | 515600 | NA | 32200 | 26546.60 | 598096 | NA | NA | -565896 | -0.9461625 | NA | NA | NA | NA | NA |
| 02180000100 | 02180 | 000100 | AK | Alaska | Nome Census Area | 4 | West Region | 9 | Pacific Division | 5766 | 2016 | 1373 | 3052 | 5552 | 54.97118 | 0.9552 | 1 | 519 | 2134 | 24.320525 | 0.9899 | 1 | 224 | 852 | 26.29108 | 0.095960 | 0 | 94 | 521 | 18.042227 | 0.033620 | 0 | 318 | 1373 | 23.16096 | 0.021070 | 0 | 580 | 2709 | 21.410114 | 0.6970 | 0 | 1988 | 5811 | 34.210979 | 0.93800 | 1 | 299 | 5.185571 | 0.11630 | 0 | 2214 | 38.39750 | 0.97400 | 1 | 580 | 3550 | 16.33803 | 0.7460 | 0 | 439 | 1083 | 40.53555 | 0.9715 | 1 | 95 | 5090 | 1.8664047 | 0.26950 | 0 | 5430 | 5766 | 94.17274 | 0.9125 | 1 | 2016 | 15 | 0.7440476 | 0.22730 | 0 | 27 | 1.3392857 | 0.6231 | 0 | 495 | 1373 | 36.052440 | 0.97870 | 1 | 1167 | 1373 | 84.99636 | 0.9991 | 1 | 187 | 5766 | 3.243149 | 0.8747 | 1 | 3.601170 | 0.7768 | 3 | 3.07730 | 0.7608 | 2 | 0.9125 | 0.9031 | 1 | 3.70290 | 0.9385 | 3 | 11.29387 | 0.8751 | 9 | 5901 | 2111 | 1441 | 2939 | 5789 | 50.76870 | 0.9667 | 1 | 554 | 2224 | 24.910072 | 0.9980 | 1 | 237 | 1047 | 22.63610 | 0.23610 | 0 | 56 | 394 | 14.21320 | 0.02099 | 0 | 293 | 1441 | 20.33310 | 0.040350 | 0 | 586 | 2969 | 19.737285 | 0.73470 | 0 | 1202 | 5852 | 20.539986 | 0.9780 | 1 | 469 | 7.947806 | 0.13320 | 0 | 2245 | 38.04440 | 0.99060 | 1 | 590 | 3606.9999 | 16.357084 | 0.71430 | 0 | 532 | 1175.0000 | 45.27660 | 0.9916 | 1 | 161 | 5296 | 3.0400302 | 0.39890 | 0 | 5578 | 5901.000 | 94.52635 | 0.9154 | 1 | 2111 | 6 | 0.2842255 | 0.17600 | 0 | 23 | 1.0895310 | 0.6155 | 0 | 602 | 1441 | 41.776544 | 0.9943 | 1 | 1240 | 1441.0000 | 86.051353 | 0.9993 | 1 | 351 | 5901 | 5.9481444 | 0.9413 | 1 | 3.717750 | 0.8217 | 3 | 3.22860 | 0.84100 | 2 | 0.9154 | 0.9073 | 1 | 3.72640 | 0.9367 | 3 | 11.58815 | 0.9255 | 9 | 0 | 0 | 0 | 0 | 0 | Yes | Census Tract 1, Nome Census Area, Alaska | 11287 | 103000 | 15051 | 88100 | 13092.92 | 119480 | 1958.08 | 0.1495526 | -31380 | -0.2626381 | NA | NA | NA | NA | NA |
| 02290000100 | 02290 | 000100 | AK | Alaska | Yukon-Koyukuk Census Area | 4 | West Region | 9 | Pacific Division | 1127 | 969 | 515 | 482 | 1127 | 42.76841 | 0.8749 | 1 | 165 | 551 | 29.945553 | 0.9970 | 1 | 104 | 386 | 26.94301 | 0.106600 | 0 | 16 | 129 | 12.403101 | 0.019980 | 0 | 120 | 515 | 23.30097 | 0.022180 | 0 | 216 | 727 | 29.711142 | 0.7981 | 1 | 492 | 1121 | 43.889384 | 0.98650 | 1 | 65 | 5.767524 | 0.14900 | 0 | 329 | 29.19255 | 0.74620 | 0 | 193 | 825 | 23.39394 | 0.9394 | 1 | 85 | 247 | 34.41296 | 0.9316 | 1 | 13 | 1049 | 1.2392755 | 0.20170 | 0 | 960 | 1127 | 85.18190 | 0.8206 | 1 | 969 | 0 | 0.0000000 | 0.09395 | 0 | 30 | 3.0959752 | 0.7027 | 0 | 83 | 515 | 16.116505 | 0.84800 | 1 | 333 | 515 | 64.66019 | 0.9969 | 1 | 0 | 1127 | 0.000000 | 0.3743 | 0 | 3.678680 | 0.7918 | 4 | 2.96790 | 0.7088 | 2 | 0.8206 | 0.8122 | 1 | 3.01585 | 0.7215 | 2 | 10.48303 | 0.7894 | 9 | 1118 | 1030 | 445 | 516 | 1097 | 47.03737 | 0.9495 | 1 | 94 | 463 | 20.302376 | 0.9929 | 1 | 68 | 346 | 19.65318 | 0.13910 | 0 | 22 | 99 | 22.22222 | 0.05448 | 0 | 90 | 445 | 20.22472 | 0.039600 | 0 | 125 | 703 | 17.780939 | 0.70070 | 0 | 161 | 1099 | 14.649681 | 0.9100 | 1 | 159 | 14.221825 | 0.49590 | 0 | 338 | 30.23256 | 0.89890 | 1 | 158 | 761.0000 | 20.762155 | 0.87640 | 1 | 88 | 218.0000 | 40.36697 | 0.9809 | 1 | 0 | 1038 | 0.0000000 | 0.02391 | 0 | 1001 | 1118.000 | 89.53488 | 0.8480 | 1 | 1030 | 0 | 0.0000000 | 0.08271 | 0 | 17 | 1.6504854 | 0.6556 | 0 | 76 | 445 | 17.078652 | 0.8684 | 1 | 274 | 445.0000 | 61.573034 | 0.9965 | 1 | 58 | 1118 | 5.1878354 | 0.9330 | 1 | 3.592700 | 0.7918 | 3 | 3.27601 | 0.85820 | 3 | 0.8480 | 0.8405 | 1 | 3.53621 | 0.8979 | 3 | 11.25292 | 0.8955 | 10 | 0 | 0 | 0 | 0 | 0 | Yes | Census Tract 1, Yukon-Koyukuk Census Area, Alaska | 14127 | 91000 | 16500 | 88100 | 16387.32 | 105560 | 112.68 | 0.0068760 | -17460 | -0.1654036 | NA | NA | NA | NA | NA |
| 02290000400 | 02290 | 000400 | AK | Alaska | Yukon-Koyukuk Census Area | 4 | West Region | 9 | Pacific Division | 1173 | 751 | 377 | 573 | 1156 | 49.56747 | 0.9275 | 1 | 106 | 509 | 20.825147 | 0.9770 | 1 | 35 | 228 | 15.35088 | 0.012330 | 0 | 26 | 149 | 17.449664 | 0.031190 | 0 | 61 | 377 | 16.18037 | 0.005034 | 0 | 114 | 646 | 17.647059 | 0.6307 | 0 | 419 | 1005 | 41.691542 | 0.97960 | 1 | 101 | 8.610401 | 0.35070 | 0 | 362 | 30.86104 | 0.81090 | 1 | 109 | 696 | 15.66092 | 0.7109 | 0 | 80 | 230 | 34.78261 | 0.9347 | 1 | 0 | 1039 | 0.0000000 | 0.02799 | 0 | 995 | 1173 | 84.82523 | 0.8172 | 1 | 751 | 0 | 0.0000000 | 0.09395 | 0 | 18 | 2.3968043 | 0.6773 | 0 | 53 | 377 | 14.058355 | 0.81990 | 1 | 208 | 377 | 55.17241 | 0.9947 | 1 | 0 | 1173 | 0.000000 | 0.3743 | 0 | 3.519834 | 0.7583 | 3 | 2.83519 | 0.6497 | 2 | 0.8172 | 0.8088 | 1 | 2.96015 | 0.6987 | 2 | 10.13237 | 0.7552 | 8 | 1035 | 823 | 394 | 442 | 1030 | 42.91262 | 0.9240 | 1 | 76 | 481 | 15.800416 | 0.9754 | 1 | 66 | 292 | 22.60274 | 0.23430 | 0 | 21 | 102 | 20.58824 | 0.04701 | 0 | 87 | 394 | 22.08122 | 0.063080 | 0 | 88 | 653 | 13.476263 | 0.61280 | 0 | 291 | 1032 | 28.197674 | 0.9971 | 1 | 141 | 13.623188 | 0.45900 | 0 | 295 | 28.50242 | 0.84980 | 1 | 184 | 736.9996 | 24.966091 | 0.94930 | 1 | 71 | 214.9998 | 33.02329 | 0.9430 | 1 | 2 | 949 | 0.2107482 | 0.07122 | 0 | 904 | 1035.000 | 87.34303 | 0.8185 | 1 | 823 | 2 | 0.2430134 | 0.17400 | 0 | 3 | 0.3645200 | 0.5127 | 0 | 41 | 394 | 10.406091 | 0.7362 | 0 | 259 | 393.9995 | 65.736117 | 0.9969 | 1 | 24 | 1035 | 2.3188406 | 0.8486 | 1 | 3.572380 | 0.7884 | 3 | 3.27232 | 0.85640 | 3 | 0.8185 | 0.8113 | 1 | 3.26840 | 0.8181 | 2 | 10.93160 | 0.8621 | 9 | 0 | 0 | 0 | 0 | 0 | Yes | Census Tract 4, Yukon-Koyukuk Census Area, Alaska | 14207 | 92900 | 15492 | 55600 | 16480.12 | 107764 | -988.12 | -0.0599583 | -52164 | -0.4840578 | NA | NA | NA | NA | NA |
| 06001400700 | 06001 | 400700 | CA | California | Alameda County | 4 | West Region | 9 | Pacific Division | 3942 | 2009 | 1706 | 1186 | 3942 | 30.08625 | 0.7161 | 0 | 191 | 1969 | 9.700356 | 0.6400 | 0 | 298 | 607 | 49.09390 | 0.760800 | 1 | 658 | 1099 | 59.872611 | 0.748900 | 0 | 956 | 1706 | 56.03751 | 0.847400 | 1 | 380 | 2787 | 13.634733 | 0.5333 | 0 | 546 | 3779 | 14.448267 | 0.47150 | 0 | 451 | 11.440893 | 0.55060 | 0 | 692 | 17.55454 | 0.17100 | 0 | 707 | 3177 | 22.25370 | 0.9237 | 1 | 186 | 688 | 27.03488 | 0.8296 | 1 | 100 | 3664 | 2.7292576 | 0.34520 | 0 | 2542 | 3942 | 64.48503 | 0.6485 | 0 | 2009 | 78 | 3.8825286 | 0.39170 | 0 | 0 | 0.0000000 | 0.2497 | 0 | 25 | 1706 | 1.465416 | 0.27860 | 0 | 329 | 1706 | 19.28488 | 0.9224 | 1 | 0 | 3942 | 0.000000 | 0.3743 | 0 | 3.208300 | 0.6849 | 1 | 2.82010 | 0.6426 | 2 | 0.6485 | 0.6419 | 0 | 2.21670 | 0.3596 | 1 | 8.89360 | 0.6187 | 4 | 5127 | 2037 | 1926 | 1155 | 5110 | 22.60274 | 0.6384 | 0 | 209 | 3522 | 5.934128 | 0.5700 | 0 | 248 | 677 | 36.63220 | 0.77480 | 1 | 442 | 1248 | 35.41667 | 0.18340 | 0 | 690 | 1925 | 35.84416 | 0.439200 | 0 | 200 | 3980 | 5.025126 | 0.26040 | 0 | 462 | 5123 | 9.018153 | 0.7215 | 0 | 478 | 9.323191 | 0.20110 | 0 | 957 | 18.66589 | 0.30330 | 0 | 573 | 4166.1857 | 13.753588 | 0.55250 | 0 | 224 | 873.8465 | 25.63379 | 0.8488 | 1 | 188 | 4819 | 3.9012243 | 0.46260 | 0 | 2892 | 5126.788 | 56.40959 | 0.5263 | 0 | 2037 | 177 | 8.6892489 | 0.51730 | 0 | 0 | 0.0000000 | 0.2466 | 0 | 109 | 1926 | 5.659398 | 0.5535 | 0 | 249 | 1925.6234 | 12.930878 | 0.8598 | 1 | 21 | 5127 | 0.4095963 | 0.5222 | 0 | 2.629500 | 0.5445 | 0 | 2.36830 | 0.40540 | 1 | 0.5263 | 0.5217 | 0 | 2.69940 | 0.5738 | 1 | 8.22350 | 0.5369 | 2 | 0 | 0 | 0 | 0 | 0 | Yes | Census Tract 4007, Alameda County, California | 25303 | 453500 | 38235 | 702500 | 29351.48 | 526060 | 8883.52 | 0.3026600 | 176440 | 0.3353990 | 350.20 | 784.95 | Alameda County, California | San Jose-San Francisco-Oakland, CA CSA | CS488 |
| 06001400900 | 06001 | 400900 | CA | California | Alameda County | 4 | West Region | 9 | Pacific Division | 2466 | 1196 | 1123 | 405 | 2466 | 16.42336 | 0.4185 | 0 | 101 | 1484 | 6.805930 | 0.3730 | 0 | 270 | 439 | 61.50342 | 0.943300 | 1 | 323 | 684 | 47.222222 | 0.410700 | 0 | 593 | 1123 | 52.80499 | 0.772400 | 1 | 240 | 1699 | 14.125956 | 0.5464 | 0 | 100 | 2275 | 4.395604 | 0.07064 | 0 | 258 | 10.462287 | 0.48400 | 0 | 439 | 17.80211 | 0.17720 | 0 | 409 | 1868 | 21.89507 | 0.9182 | 1 | 202 | 400 | 50.50000 | 0.9951 | 1 | 0 | 2321 | 0.0000000 | 0.02799 | 0 | 1495 | 2466 | 60.62449 | 0.6182 | 0 | 1196 | 80 | 6.6889632 | 0.48380 | 0 | 0 | 0.0000000 | 0.2497 | 0 | 0 | 1123 | 0.000000 | 0.05961 | 0 | 204 | 1123 | 18.16563 | 0.9113 | 1 | 0 | 2466 | 0.000000 | 0.3743 | 0 | 2.180940 | 0.4177 | 1 | 2.60249 | 0.5376 | 2 | 0.6182 | 0.6119 | 0 | 2.07871 | 0.2993 | 1 | 7.48034 | 0.4369 | 4 | 2854 | 1221 | 1101 | 410 | 2854 | 14.36580 | 0.4046 | 0 | 104 | 2043 | 5.090553 | 0.4664 | 0 | 155 | 404 | 38.36634 | 0.82100 | 1 | 309 | 697 | 44.33286 | 0.36900 | 0 | 464 | 1101 | 42.14351 | 0.653600 | 0 | 163 | 2053 | 7.939601 | 0.41660 | 0 | 197 | 2849 | 6.914707 | 0.5867 | 0 | 203 | 7.112824 | 0.09481 | 0 | 462 | 16.18781 | 0.18410 | 0 | 199 | 2387.8971 | 8.333693 | 0.15390 | 0 | 142 | 585.5745 | 24.24969 | 0.8226 | 1 | 181 | 2663 | 6.7968457 | 0.60790 | 0 | 1875 | 2854.008 | 65.69709 | 0.6092 | 0 | 1221 | 152 | 12.4488124 | 0.60240 | 0 | 0 | 0.0000000 | 0.2466 | 0 | 49 | 1101 | 4.450500 | 0.4765 | 0 | 65 | 1101.4226 | 5.901459 | 0.6007 | 0 | 0 | 2854 | 0.0000000 | 0.1370 | 0 | 2.527900 | 0.5132 | 0 | 1.86331 | 0.16880 | 1 | 0.6092 | 0.6038 | 0 | 2.06320 | 0.2946 | 0 | 7.06361 | 0.3731 | 1 | 0 | 0 | 0 | 0 | 0 | Yes | Census Tract 4009, Alameda County, California | 30185 | 470500 | 38375 | 774700 | 35014.60 | 545780 | 3360.40 | 0.0959714 | 228920 | 0.4194364 | 281.27 | 777.62 | Alameda County, California | San Jose-San Francisco-Oakland, CA CSA | CS488 |
| 06001401100 | 06001 | 401100 | CA | California | Alameda County | 4 | West Region | 9 | Pacific Division | 3738 | 2218 | 2014 | 1244 | 3738 | 33.27983 | 0.7632 | 1 | 193 | 2527 | 7.637515 | 0.4589 | 0 | 230 | 400 | 57.50000 | 0.905100 | 1 | 927 | 1614 | 57.434944 | 0.685300 | 0 | 1157 | 2014 | 57.44786 | 0.875900 | 1 | 275 | 2920 | 9.417808 | 0.3945 | 0 | 716 | 4313 | 16.600974 | 0.55910 | 0 | 237 | 6.340289 | 0.18740 | 0 | 420 | 11.23596 | 0.06016 | 0 | 392 | 3734 | 10.49813 | 0.3470 | 0 | 123 | 535 | 22.99065 | 0.7451 | 0 | 367 | 3574 | 10.2686066 | 0.67930 | 0 | 1979 | 3738 | 52.94275 | 0.5530 | 0 | 2218 | 531 | 23.9404869 | 0.78650 | 1 | 0 | 0.0000000 | 0.2497 | 0 | 7 | 2014 | 0.347567 | 0.12930 | 0 | 567 | 2014 | 28.15293 | 0.9667 | 1 | 0 | 3738 | 0.000000 | 0.3743 | 0 | 3.051600 | 0.6495 | 2 | 2.01896 | 0.2542 | 0 | 0.5530 | 0.5473 | 0 | 2.50650 | 0.4877 | 2 | 8.13006 | 0.5257 | 4 | 4283 | 2222 | 2187 | 876 | 4283 | 20.45295 | 0.5868 | 0 | 194 | 3177 | 6.106390 | 0.5900 | 0 | 90 | 406 | 22.16749 | 0.21890 | 0 | 755 | 1781 | 42.39191 | 0.32490 | 0 | 845 | 2187 | 38.63740 | 0.538200 | 0 | 175 | 3482 | 5.025847 | 0.26060 | 0 | 454 | 4283 | 10.600047 | 0.7917 | 1 | 268 | 6.257296 | 0.06482 | 0 | 526 | 12.28111 | 0.08534 | 0 | 264 | 3757.5978 | 7.025765 | 0.08703 | 0 | 155 | 591.6622 | 26.19738 | 0.8596 | 1 | 114 | 4119 | 2.7676621 | 0.37920 | 0 | 2054 | 4283.310 | 47.95357 | 0.4417 | 0 | 2222 | 991 | 44.5994599 | 0.90590 | 1 | 0 | 0.0000000 | 0.2466 | 0 | 60 | 2187 | 2.743484 | 0.3343 | 0 | 553 | 2186.6359 | 25.289990 | 0.9637 | 1 | 114 | 4283 | 2.6616857 | 0.8651 | 1 | 2.767300 | 0.5836 | 1 | 1.47599 | 0.06543 | 1 | 0.4417 | 0.4378 | 0 | 3.31560 | 0.8335 | 3 | 8.00059 | 0.5035 | 5 | 0 | 0 | 1 | 1590984 | 1 | Yes | Census Tract 4011, Alameda County, California | 23516 | 526800 | 48058 | 889800 | 27278.56 | 611088 | 20779.44 | 0.7617499 | 278712 | 0.4560914 | 530.92 | 1038.24 | Alameda County, California | San Jose-San Francisco-Oakland, CA CSA | CS488 |
svi_national_lihtc_df0 <- left_join(svi_national_lihtc, census_pull_df, join_by("GEOID_2010_trt" == "GEOID"))

svi_national_lihtc_df1 <- left_join(svi_national_lihtc_df0, hpi_df_10_20, join_by("GEOID_2010_trt" == "GEOID10")) %>%
                          unite("county_fips", FIPS_st, FIPS_county, sep = "")

svi_national_lihtc_df <- left_join(svi_national_lihtc_df1, msa_csa_crosswalk, join_by("county_fips" == "county_fips"))

svi_national_lihtc_df %>% head(10) %>% kbl() %>% kable_styling() %>% scroll_box(width = "100%")
| GEOID_2010_trt | county_fips | FIPS_tract | state | state_name | county | region_number | region | division_number | division | E_TOTPOP_10 | E_HU_10 | E_HH_10 | E_POV150_10 | ET_POVSTATUS_10 | EP_POV150_10 | EPL_POV150_10 | F_POV150_10 | E_UNEMP_10 | ET_EMPSTATUS_10 | EP_UNEMP_10 | EPL_UNEMP_10 | F_UNEMP_10 | E_HBURD_OWN_10 | ET_HOUSINGCOST_OWN_10 | EP_HBURD_OWN_10 | EPL_HBURD_OWN_10 | F_HBURD_OWN_10 | E_HBURD_RENT_10 | ET_HOUSINGCOST_RENT_10 | EP_HBURD_RENT_10 | EPL_HBURD_RENT_10 | F_HBURD_RENT_10 | E_HBURD_10 | ET_HOUSINGCOST_10 | EP_HBURD_10 | EPL_HBURD_10 | F_HBURD_10 | E_NOHSDP_10 | ET_EDSTATUS_10 | EP_NOHSDP_10 | EPL_NOHSDP_10 | F_NOHSDP_10 | E_UNINSUR_12 | ET_INSURSTATUS_12 | EP_UNINSUR_12 | EPL_UNINSUR_12 | F_UNINSUR_12 | E_AGE65_10 | EP_AGE65_10 | EPL_AGE65_10 | F_AGE65_10 | E_AGE17_10 | EP_AGE17_10 | EPL_AGE17_10 | F_AGE17_10 | E_DISABL_12 | ET_DISABLSTATUS_12 | EP_DISABL_12 | EPL_DISABL_12 | F_DISABL_12 | E_SNGPNT_10 | ET_FAMILIES_10 | EP_SNGPNT_10 | EPL_SNGPNT_10 | F_SNGPNT_10 | E_LIMENG_10 | ET_POPAGE5UP_10 | EP_LIMENG_10 | EPL_LIMENG_10 | F_LIMENG_10 | E_MINRTY_10 | ET_POPETHRACE_10 | EP_MINRTY_10 | EPL_MINRTY_10 | F_MINRTY_10 | E_STRHU_10 | E_MUNIT_10 | EP_MUNIT_10 | EPL_MUNIT_10 | F_MUNIT_10 | E_MOBILE_10 | EP_MOBILE_10 | EPL_MOBILE_10 | F_MOBILE_10 | E_CROWD_10 | ET_OCCUPANTS_10 | EP_CROWD_10 | EPL_CROWD_10 | F_CROWD_10 | E_NOVEH_10 | ET_KNOWNVEH_10 | EP_NOVEH_10 | EPL_NOVEH_10 | F_NOVEH_10 | E_GROUPQ_10 | ET_HHTYPE_10 | EP_GROUPQ_10 | EPL_GROUPQ_10 | F_GROUPQ_10 | SPL_THEME1_10 | RPL_THEME1_10 | F_THEME1_10 | SPL_THEME2_10 | RPL_THEME2_10 | F_THEME2_10 | SPL_THEME3_10 | RPL_THEME3_10 | F_THEME3_10 | SPL_THEME4_10 | RPL_THEME4_10 | F_THEME4_10 | SPL_THEMES_10 | RPL_THEMES_10 | F_TOTAL_10 | E_TOTPOP_20 | E_HU_20 | E_HH_20 | E_POV150_20 | ET_POVSTATUS_20 | EP_POV150_20 | EPL_POV150_20 | F_POV150_20 | E_UNEMP_20 | ET_EMPSTATUS_20 | EP_UNEMP_20 | EPL_UNEMP_20 | F_UNEMP_20 | E_HBURD_OWN_20 | ET_HOUSINGCOST_OWN_20 | EP_HBURD_OWN_20 | EPL_HBURD_OWN_20 | F_HBURD_OWN_20 | E_HBURD_RENT_20 | ET_HOUSINGCOST_RENT_20 | EP_HBURD_RENT_20 | EPL_HBURD_RENT_20 | F_HBURD_RENT_20 | E_HBURD_20 | ET_HOUSINGCOST_20 | EP_HBURD_20 | EPL_HBURD_20 | F_HBURD_20 | E_NOHSDP_20 | ET_EDSTATUS_20 | EP_NOHSDP_20 | EPL_NOHSDP_20 | F_NOHSDP_20 | E_UNINSUR_20 | ET_INSURSTATUS_20 | EP_UNINSUR_20 | EPL_UNINSUR_20 | F_UNINSUR_20 | E_AGE65_20 | EP_AGE65_20 | EPL_AGE65_20 | F_AGE65_20 | E_AGE17_20 | EP_AGE17_20 | EPL_AGE17_20 | F_AGE17_20 | E_DISABL_20 | ET_DISABLSTATUS_20 | EP_DISABL_20 | EPL_DISABL_20 | F_DISABL_20 | E_SNGPNT_20 | ET_FAMILIES_20 | EP_SNGPNT_20 | EPL_SNGPNT_20 | F_SNGPNT_20 | E_LIMENG_20 | ET_POPAGE5UP_20 | EP_LIMENG_20 | EPL_LIMENG_20 | F_LIMENG_20 | E_MINRTY_20 | ET_POPETHRACE_20 | EP_MINRTY_20 | EPL_MINRTY_20 | F_MINRTY_20 | E_STRHU_20 | E_MUNIT_20 | EP_MUNIT_20 | EPL_MUNIT_20 | F_MUNIT_20 | E_MOBILE_20 | EP_MOBILE_20 | EPL_MOBILE_20 | F_MOBILE_20 | E_CROWD_20 | ET_OCCUPANTS_20 | EP_CROWD_20 | EPL_CROWD_20 | F_CROWD_20 | E_NOVEH_20 | ET_KNOWNVEH_20 | EP_NOVEH_20 | EPL_NOVEH_20 | F_NOVEH_20 | E_GROUPQ_20 | ET_HHTYPE_20 | EP_GROUPQ_20 | EPL_GROUPQ_20 | F_GROUPQ_20 | SPL_THEME1_20 | RPL_THEME1_20 | F_THEME1_20 | SPL_THEME2_20 | RPL_THEME2_20 | F_THEME2_20 | SPL_THEME3_20 | RPL_THEME3_20 | F_THEME3_20 | SPL_THEME4_20 | RPL_THEME4_20 | F_THEME4_20 | SPL_THEMES_20 | RPL_THEMES_20 | F_TOTAL_20 | pre10_lihtc_project_cnt | pre10_lihtc_project_dollars | post10_lihtc_project_cnt | post10_lihtc_project_dollars | lihtc_flag | lihtc_eligibility | NAME | Median_Income_10 | Median_Home_Value_10 | Median_Income_19 | Median_Home_Value_19 | Median_Income_10adj | Median_Home_Value_10adj | Median_Income_Change | Median_Income_Change_pct | Median_Home_Value_Change | Median_Home_Value_Change_pct | housing_price_index10 | housing_price_index20 | county_title | cbsa | cbsa_code |
|---|---|---|---|---|---|---|---|---|---|---|---|---|---|---|---|---|---|---|---|---|---|---|---|---|---|---|---|---|---|---|---|---|---|---|---|---|---|---|---|---|---|---|---|---|---|---|---|---|---|---|---|---|---|---|---|---|---|---|---|---|---|---|---|---|---|---|---|---|---|---|---|---|---|---|---|---|---|---|---|---|---|---|---|---|---|---|---|---|---|---|---|---|---|---|---|---|---|---|---|---|---|---|---|---|---|---|---|---|---|---|---|---|---|---|---|---|---|---|---|---|---|---|---|---|---|---|---|---|---|---|---|---|---|---|---|---|---|---|---|---|---|---|---|---|---|---|---|---|---|---|---|---|---|---|---|---|---|---|---|---|---|---|---|---|---|---|---|---|---|---|---|---|---|---|---|---|---|---|---|---|---|---|---|---|---|---|---|---|---|---|---|---|---|---|---|---|---|---|---|---|---|---|---|---|---|---|---|---|---|---|---|---|---|---|---|---|---|---|---|---|---|---|---|---|---|---|---|---|---|---|---|---|---|---|---|---|---|---|---|---|---|
| 01005950700 | 01005 | 950700 | AL | Alabama | Barbour County | 3 | South Region | 6 | East South Central Division | 1753 | 687 | 563 | 615 | 1628 | 37.77641 | 0.8088 | 1 | 17 | 667 | 2.548726 | 0.06941 | 0 | 41 | 376 | 10.90426 | 0.01945 | 0 | 62 | 187 | 33.15508 | 0.24640 | 0 | 103 | 563 | 18.29485 | 0.04875 | 0 | 264 | 1208 | 21.85430 | 0.7570 | 1 | 201 | 1527 | 13.163065 | 0.4991 | 0 | 368 | 20.992584 | 0.89510 | 1 | 462 | 26.354820 | 0.66130 | 0 | 211 | 1085 | 19.44700 | 0.7505 | 1 | 107 | 399 | 26.81704 | 0.8048 | 1 | 0 | 1628 | 0.0000000 | 0.09298 | 0 | 861 | 1753 | 49.11580 | 0.7101 | 0 | 687 | 17 | 2.4745269 | 0.4324 | 0 | 38 | 5.5312955 | 0.6970 | 0 | 3 | 563 | 0.5328597 | 0.3037 | 0 | 19 | 563 | 3.374778 | 0.3529 | 0 | 233 | 1753 | 13.29150 | 0.9517 | 1 | 2.18306 | 0.4137 | 2 | 3.20468 | 0.8377 | 3 | 0.7101 | 0.7035 | 0 | 2.7377 | 0.6100 | 1 | 8.83554 | 0.6264 | 6 | 1527 | 691 | 595 | 565 | 1365 | 41.39194 | 0.8765 | 1 | 37 | 572 | 6.468532 | 0.6776 | 0 | 70 | 376 | 18.617021 | 0.38590 | 0 | 92 | 219 | 42.009132 | 0.47360 | 0 | 162 | 595 | 27.22689 | 0.44540 | 0 | 280 | 1114 | 25.13465 | 0.8942 | 1 | 105 | 1378 | 7.619739 | 0.5505 | 0 | 383 | 25.081860 | 0.88450 | 1 | 337 | 22.069417 | 0.51380 | 0 | 237 | 1041.0000 | 22.76657 | 0.8360 | 1 | 144 | 413.0000 | 34.86683 | 0.9114 | 1 | 11 | 1466 | 0.7503411 | 0.40700 | 0 | 711 | 1527.0000 | 46.56189 | 0.6441 | 0 | 691 | 13 | 1.8813314 | 0.3740 | 0 | 37 | 5.3545586 | 0.7152 | 0 | 0 | 595 | 0.0000000 | 0.09796 | 0 | 115 | 595.0000 | 19.327731 | 0.8859 | 1 | 149 | 1527 | 9.7576948 | 0.9470 | 1 | 3.44420 | 0.7707 | 2 | 3.55270 | 0.9403 | 3 | 0.6441 | 0.6387 | 0 | 3.02006 | 0.7337 | 2 | 10.66106 | 0.8537 | 7 | 0 | 0 | 0 | 0 | 0 | Yes | Census Tract 9507, Barbour County, Alabama | 15257 | 133700 | 17244 | 137500 | 17698.12 | 155092 | -454.12 | -0.0256592 | -17592 | -0.1134294 | 131.05 | 135.61 | Barbour County, Alabama | Eufaula, AL-GA MicroSA | C2164 |
| 01011952100 | 01011 | 952100 | AL | Alabama | Bullock County | 3 | South Region | 6 | East South Central Division | 1652 | 796 | 554 | 564 | 1652 | 34.14044 | 0.7613 | 1 | 46 | 816 | 5.637255 | 0.33630 | 0 | 96 | 458 | 20.96070 | 0.19930 | 0 | 62 | 96 | 64.58333 | 0.89170 | 1 | 158 | 554 | 28.51986 | 0.29220 | 0 | 271 | 1076 | 25.18587 | 0.8163 | 1 | 155 | 1663 | 9.320505 | 0.3183 | 0 | 199 | 12.046005 | 0.47180 | 0 | 420 | 25.423729 | 0.60240 | 0 | 327 | 1279 | 25.56685 | 0.9151 | 1 | 137 | 375 | 36.53333 | 0.9108 | 1 | 0 | 1590 | 0.0000000 | 0.09298 | 0 | 1428 | 1652 | 86.44068 | 0.8939 | 1 | 796 | 0 | 0.0000000 | 0.1224 | 0 | 384 | 48.2412060 | 0.9897 | 1 | 19 | 554 | 3.4296029 | 0.7145 | 0 | 45 | 554 | 8.122744 | 0.6556 | 0 | 0 | 1652 | 0.00000 | 0.3640 | 0 | 2.52440 | 0.5138 | 2 | 2.99308 | 0.7515 | 2 | 0.8939 | 0.8856 | 1 | 2.8462 | 0.6637 | 1 | 9.25758 | 0.6790 | 6 | 1382 | 748 | 549 | 742 | 1382 | 53.69030 | 0.9560 | 1 | 40 | 511 | 7.827789 | 0.7730 | 1 | 110 | 402 | 27.363184 | 0.71780 | 0 | 45 | 147 | 30.612245 | 0.23070 | 0 | 155 | 549 | 28.23315 | 0.47730 | 0 | 181 | 905 | 20.00000 | 0.8253 | 1 | 232 | 1382 | 16.787265 | 0.8813 | 1 | 164 | 11.866860 | 0.27170 | 0 | 250 | 18.089725 | 0.26290 | 0 | 258 | 1132.0000 | 22.79152 | 0.8368 | 1 | 99 | 279.0000 | 35.48387 | 0.9162 | 1 | 33 | 1275 | 2.5882353 | 0.64520 | 0 | 1347 | 1382.0000 | 97.46744 | 0.9681 | 1 | 748 | 0 | 0.0000000 | 0.1079 | 0 | 375 | 50.1336898 | 0.9922 | 1 | 0 | 549 | 0.0000000 | 0.09796 | 0 | 37 | 549.0000 | 6.739526 | 0.6039 | 0 | 0 | 1382 | 0.0000000 | 0.1831 | 0 | 3.91290 | 0.8785 | 4 | 2.93280 | 0.7342 | 2 | 0.9681 | 0.9599 | 1 | 1.98506 | 0.2471 | 1 | 9.79886 | 0.7570 | 8 | 0 | 0 | 0 | 0 | 0 | Yes | Census Tract 9521, Bullock County, Alabama | 19754 | 58200 | 18598 | 66900 | 22914.64 | 67512 | -4316.64 | -0.1883791 | -612 | -0.0090651 | NA | NA | NA | NA | NA |
| 01015000300 | 01015 | 000300 | AL | Alabama | Calhoun County | 3 | South Region | 6 | East South Central Division | 3074 | 1635 | 1330 | 1904 | 3067 | 62.08021 | 0.9710 | 1 | 293 | 1362 | 21.512482 | 0.96630 | 1 | 180 | 513 | 35.08772 | 0.65450 | 0 | 383 | 817 | 46.87882 | 0.55040 | 0 | 563 | 1330 | 42.33083 | 0.70280 | 0 | 720 | 2127 | 33.85049 | 0.9148 | 1 | 628 | 2835 | 22.151675 | 0.8076 | 1 | 380 | 12.361744 | 0.49340 | 0 | 713 | 23.194535 | 0.45030 | 0 | 647 | 2111 | 30.64898 | 0.9708 | 1 | 298 | 773 | 38.55110 | 0.9247 | 1 | 0 | 2878 | 0.0000000 | 0.09298 | 0 | 2623 | 3074 | 85.32856 | 0.8883 | 1 | 1635 | 148 | 9.0519878 | 0.6465 | 0 | 6 | 0.3669725 | 0.4502 | 0 | 68 | 1330 | 5.1127820 | 0.8082 | 1 | 303 | 1330 | 22.781955 | 0.9029 | 1 | 0 | 3074 | 0.00000 | 0.3640 | 0 | 4.36250 | 0.9430 | 4 | 2.93218 | 0.7233 | 2 | 0.8883 | 0.8800 | 1 | 3.1718 | 0.8070 | 2 | 11.35478 | 0.9009 | 9 | 2390 | 1702 | 1282 | 1287 | 2390 | 53.84937 | 0.9566 | 1 | 102 | 1066 | 9.568480 | 0.8541 | 1 | 158 | 609 | 25.944171 | 0.67520 | 0 | 286 | 673 | 42.496285 | 0.48560 | 0 | 444 | 1282 | 34.63339 | 0.66340 | 0 | 467 | 1685 | 27.71513 | 0.9180 | 1 | 369 | 2379 | 15.510719 | 0.8562 | 1 | 342 | 14.309623 | 0.40850 | 0 | 548 | 22.928870 | 0.57100 | 0 | 647 | 1831.0000 | 35.33588 | 0.9862 | 1 | 202 | 576.0000 | 35.06944 | 0.9130 | 1 | 16 | 2134 | 0.7497657 | 0.40690 | 0 | 1896 | 2390.0000 | 79.33054 | 0.8451 | 1 | 1702 | 96 | 5.6404230 | 0.5329 | 0 | 0 | 0.0000000 | 0.2186 | 0 | 0 | 1282 | 0.0000000 | 0.09796 | 0 | 186 | 1282.0000 | 14.508580 | 0.8308 | 1 | 43 | 2390 | 1.7991632 | 0.7727 | 1 | 4.24830 | 0.9395 | 4 | 3.28560 | 0.8773 | 2 | 0.8451 | 0.8379 | 1 | 2.45296 | 0.4602 | 2 | 10.83196 | 0.8718 | 9 | 0 | 0 | 0 | 0 | 0 | Yes | Census Tract 3, Calhoun County, Alabama | 12211 | 41700 | 18299 | 51300 | 14164.76 | 48372 | 4134.24 | 0.2918680 | 2928 | 0.0605309 | NA | NA | Calhoun County, Alabama | Anniston-Oxford, AL MSA | C1150 |
| 01015000500 | 01015 | 000500 | AL | Alabama | Calhoun County | 3 | South Region | 6 | East South Central Division | 1731 | 1175 | 743 | 1042 | 1619 | 64.36072 | 0.9767 | 1 | 124 | 472 | 26.271186 | 0.98460 | 1 | 136 | 461 | 29.50108 | 0.48970 | 0 | 163 | 282 | 57.80142 | 0.79190 | 1 | 299 | 743 | 40.24226 | 0.64910 | 0 | 340 | 1270 | 26.77165 | 0.8389 | 1 | 460 | 1794 | 25.641026 | 0.8722 | 1 | 271 | 15.655690 | 0.70190 | 0 | 368 | 21.259388 | 0.32190 | 0 | 507 | 1449 | 34.98965 | 0.9885 | 1 | 150 | 386 | 38.86010 | 0.9269 | 1 | 0 | 1677 | 0.0000000 | 0.09298 | 0 | 1559 | 1731 | 90.06355 | 0.9123 | 1 | 1175 | 50 | 4.2553191 | 0.5128 | 0 | 4 | 0.3404255 | 0.4480 | 0 | 0 | 743 | 0.0000000 | 0.1238 | 0 | 122 | 743 | 16.419919 | 0.8473 | 1 | 0 | 1731 | 0.00000 | 0.3640 | 0 | 4.32150 | 0.9362 | 4 | 3.03218 | 0.7679 | 2 | 0.9123 | 0.9038 | 1 | 2.2959 | 0.3818 | 1 | 10.56188 | 0.8244 | 8 | 940 | 907 | 488 | 586 | 940 | 62.34043 | 0.9815 | 1 | 59 | 297 | 19.865320 | 0.9833 | 1 | 100 | 330 | 30.303030 | 0.79220 | 1 | 58 | 158 | 36.708861 | 0.34970 | 0 | 158 | 488 | 32.37705 | 0.60200 | 0 | 199 | 795 | 25.03145 | 0.8930 | 1 | 118 | 940 | 12.553192 | 0.7770 | 1 | 246 | 26.170213 | 0.90530 | 1 | 118 | 12.553192 | 0.08233 | 0 | 383 | 822.5089 | 46.56484 | 0.9984 | 1 | 30 | 197.8892 | 15.16000 | 0.5363 | 0 | 0 | 889 | 0.0000000 | 0.09479 | 0 | 898 | 940.3866 | 95.49264 | 0.9489 | 1 | 907 | 0 | 0.0000000 | 0.1079 | 0 | 2 | 0.2205072 | 0.4456 | 0 | 2 | 488 | 0.4098361 | 0.23670 | 0 | 146 | 487.6463 | 29.939736 | 0.9404 | 1 | 0 | 940 | 0.0000000 | 0.1831 | 0 | 4.23680 | 0.9379 | 4 | 2.61712 | 0.5593 | 2 | 0.9489 | 0.9409 | 1 | 1.91370 | 0.2196 | 1 | 9.71652 | 0.7468 | 8 | 0 | 0 | 0 | 0 | 0 | Yes | Census Tract 5, Calhoun County, Alabama | 11742 | 38800 | 13571 | 38800 | 13620.72 | 45008 | -49.72 | -0.0036503 | -6208 | -0.1379310 | NA | NA | Calhoun County, Alabama | Anniston-Oxford, AL MSA | C1150 |
| 01015000600 | 01015 | 000600 | AL | Alabama | Calhoun County | 3 | South Region | 6 | East South Central Division | 2571 | 992 | 796 | 1394 | 2133 | 65.35396 | 0.9789 | 1 | 263 | 905 | 29.060773 | 0.98990 | 1 | 121 | 306 | 39.54248 | 0.75940 | 1 | 209 | 490 | 42.65306 | 0.44810 | 0 | 330 | 796 | 41.45729 | 0.68030 | 0 | 641 | 1556 | 41.19537 | 0.9554 | 1 | 416 | 1760 | 23.636364 | 0.8383 | 1 | 220 | 8.556982 | 0.24910 | 0 | 584 | 22.714897 | 0.41610 | 0 | 539 | 1353 | 39.83740 | 0.9955 | 1 | 243 | 466 | 52.14592 | 0.9783 | 1 | 30 | 2366 | 1.2679628 | 0.48990 | 0 | 1944 | 2571 | 75.61260 | 0.8440 | 1 | 992 | 164 | 16.5322581 | 0.7673 | 1 | 8 | 0.8064516 | 0.5110 | 0 | 46 | 796 | 5.7788945 | 0.8329 | 1 | 184 | 796 | 23.115578 | 0.9049 | 1 | 614 | 2571 | 23.88176 | 0.9734 | 1 | 4.44280 | 0.9548 | 4 | 3.12890 | 0.8088 | 2 | 0.8440 | 0.8362 | 1 | 3.9895 | 0.9792 | 4 | 12.40520 | 0.9696 | 11 | 1950 | 964 | 719 | 837 | 1621 | 51.63479 | 0.9467 | 1 | 157 | 652 | 24.079755 | 0.9922 | 1 | 22 | 364 | 6.043956 | 0.01547 | 0 | 129 | 355 | 36.338028 | 0.34200 | 0 | 151 | 719 | 21.00139 | 0.23030 | 0 | 363 | 1387 | 26.17159 | 0.9048 | 1 | 351 | 1613 | 21.760694 | 0.9435 | 1 | 249 | 12.769231 | 0.32090 | 0 | 356 | 18.256410 | 0.27140 | 0 | 332 | 1259.7041 | 26.35540 | 0.9135 | 1 | 136 | 435.6156 | 31.22018 | 0.8775 | 1 | 0 | 1891 | 0.0000000 | 0.09479 | 0 | 1463 | 1949.9821 | 75.02633 | 0.8219 | 1 | 964 | 14 | 1.4522822 | 0.3459 | 0 | 8 | 0.8298755 | 0.5269 | 0 | 19 | 719 | 2.6425591 | 0.61120 | 0 | 197 | 719.0542 | 27.397100 | 0.9316 | 1 | 329 | 1950 | 16.8717949 | 0.9655 | 1 | 4.01750 | 0.9001 | 4 | 2.47809 | 0.4764 | 2 | 0.8219 | 0.8149 | 1 | 3.38110 | 0.8712 | 2 | 10.69859 | 0.8583 | 9 | 0 | 0 | 0 | 0 | 0 | Yes | Census Tract 6, Calhoun County, Alabama | 10958 | 48000 | 14036 | 43300 | 12711.28 | 55680 | 1324.72 | 0.1042161 | -12380 | -0.2223420 | NA | NA | Calhoun County, Alabama | Anniston-Oxford, AL MSA | C1150 |
| 01015002101 | 01015 | 002101 | AL | Alabama | Calhoun County | 3 | South Region | 6 | East South Central Division | 3872 | 1454 | 1207 | 1729 | 2356 | 73.38710 | 0.9916 | 1 | 489 | 2020 | 24.207921 | 0.97860 | 1 | 20 | 168 | 11.90476 | 0.02541 | 0 | 718 | 1039 | 69.10491 | 0.93320 | 1 | 738 | 1207 | 61.14333 | 0.96900 | 1 | 113 | 725 | 15.58621 | 0.6035 | 0 | 664 | 3943 | 16.839970 | 0.6495 | 0 | 167 | 4.313016 | 0.05978 | 0 | 238 | 6.146694 | 0.02255 | 0 | 264 | 2359 | 11.19118 | 0.3027 | 0 | 94 | 263 | 35.74144 | 0.9050 | 1 | 46 | 3769 | 1.2204829 | 0.48250 | 0 | 1601 | 3872 | 41.34814 | 0.6572 | 0 | 1454 | 761 | 52.3383769 | 0.9504 | 1 | 65 | 4.4704264 | 0.6738 | 0 | 5 | 1207 | 0.4142502 | 0.2791 | 0 | 113 | 1207 | 9.362055 | 0.7004 | 0 | 1516 | 3872 | 39.15289 | 0.9860 | 1 | 4.19220 | 0.9133 | 3 | 1.77253 | 0.1304 | 1 | 0.6572 | 0.6511 | 0 | 3.5897 | 0.9337 | 2 | 10.21163 | 0.7885 | 6 | 3238 | 1459 | 1014 | 1082 | 1836 | 58.93246 | 0.9735 | 1 | 251 | 1403 | 17.890235 | 0.9767 | 1 | 31 | 155 | 20.000000 | 0.44920 | 0 | 515 | 859 | 59.953434 | 0.85540 | 1 | 546 | 1014 | 53.84615 | 0.95350 | 1 | 134 | 916 | 14.62882 | 0.7033 | 0 | 251 | 3238 | 7.751699 | 0.5588 | 0 | 167 | 5.157505 | 0.03597 | 0 | 169 | 5.219271 | 0.02111 | 0 | 323 | 1667.0000 | 19.37612 | 0.7205 | 0 | 94 | 277.0000 | 33.93502 | 0.9040 | 1 | 0 | 3164 | 0.0000000 | 0.09479 | 0 | 1045 | 3238.0000 | 32.27301 | 0.5125 | 0 | 1459 | 607 | 41.6038382 | 0.9185 | 1 | 65 | 4.4551062 | 0.6949 | 0 | 24 | 1014 | 2.3668639 | 0.57900 | 0 | 85 | 1014.0000 | 8.382643 | 0.6775 | 0 | 1402 | 3238 | 43.2983323 | 0.9876 | 1 | 4.16580 | 0.9263 | 3 | 1.77637 | 0.1225 | 1 | 0.5125 | 0.5082 | 0 | 3.85750 | 0.9661 | 2 | 10.31217 | 0.8160 | 6 | 0 | 0 | 0 | 0 | 0 | Yes | Census Tract 21.01, Calhoun County, Alabama | 4968 | 92000 | 9312 | 153500 | 5762.88 | 106720 | 3549.12 | 0.6158587 | 46780 | 0.4383433 | NA | NA | Calhoun County, Alabama | Anniston-Oxford, AL MSA | C1150 |
| 01015002300 | 01015 | 002300 | AL | Alabama | Calhoun County | 3 | South Region | 6 | East South Central Division | 3882 | 1861 | 1608 | 1366 | 3882 | 35.18805 | 0.7753 | 1 | 186 | 1539 | 12.085770 | 0.80740 | 1 | 284 | 1109 | 25.60866 | 0.35530 | 0 | 202 | 499 | 40.48096 | 0.39670 | 0 | 486 | 1608 | 30.22388 | 0.34700 | 0 | 727 | 2610 | 27.85441 | 0.8534 | 1 | 547 | 3706 | 14.759849 | 0.5669 | 0 | 716 | 18.444101 | 0.82530 | 1 | 904 | 23.286966 | 0.45720 | 0 | 719 | 2919 | 24.63172 | 0.8986 | 1 | 207 | 1191 | 17.38035 | 0.5923 | 0 | 0 | 3720 | 0.0000000 | 0.09298 | 0 | 490 | 3882 | 12.62236 | 0.3118 | 0 | 1861 | 38 | 2.0419130 | 0.4070 | 0 | 199 | 10.6931757 | 0.7836 | 1 | 52 | 1608 | 3.2338308 | 0.6986 | 0 | 166 | 1608 | 10.323383 | 0.7304 | 0 | 0 | 3882 | 0.00000 | 0.3640 | 0 | 3.35000 | 0.7384 | 3 | 2.86638 | 0.6919 | 2 | 0.3118 | 0.3089 | 0 | 2.9836 | 0.7289 | 1 | 9.51178 | 0.7100 | 6 | 3265 | 1774 | 1329 | 1103 | 3265 | 33.78254 | 0.7880 | 1 | 122 | 1422 | 8.579465 | 0.8131 | 1 | 101 | 844 | 11.966825 | 0.10960 | 0 | 126 | 485 | 25.979381 | 0.15930 | 0 | 227 | 1329 | 17.08051 | 0.11070 | 0 | 267 | 2122 | 12.58247 | 0.6388 | 0 | 328 | 3265 | 10.045942 | 0.6808 | 0 | 440 | 13.476263 | 0.36070 | 0 | 843 | 25.819296 | 0.74470 | 0 | 530 | 2422.0000 | 21.88274 | 0.8097 | 1 | 254 | 861.0000 | 29.50058 | 0.8574 | 1 | 0 | 3026 | 0.0000000 | 0.09479 | 0 | 811 | 3265.0000 | 24.83920 | 0.4221 | 0 | 1774 | 7 | 0.3945885 | 0.2444 | 0 | 338 | 19.0529876 | 0.8924 | 1 | 19 | 1329 | 1.4296464 | 0.44520 | 0 | 120 | 1329.0000 | 9.029345 | 0.7016 | 0 | 0 | 3265 | 0.0000000 | 0.1831 | 0 | 3.03140 | 0.6608 | 2 | 2.86729 | 0.7016 | 2 | 0.4221 | 0.4185 | 0 | 2.46670 | 0.4669 | 1 | 8.78749 | 0.6230 | 5 | 0 | 0 | 0 | 0 | 0 | Yes | Census Tract 23, Calhoun County, Alabama | 15086 | 77500 | 21540 | 78500 | 17499.76 | 89900 | 4040.24 | 0.2308740 | -11400 | -0.1268076 | 120.54 | 131.82 | Calhoun County, Alabama | Anniston-Oxford, AL MSA | C1150 |
| 01023956700 | 01023 | 956700 | AL | Alabama | Choctaw County | 3 | South Region | 6 | East South Central Division | 3011 | 1772 | 1179 | 1715 | 3011 | 56.95782 | 0.9531 | 1 | 266 | 890 | 29.887640 | 0.99100 | 1 | 267 | 1035 | 25.79710 | 0.36240 | 0 | 79 | 144 | 54.86111 | 0.73440 | 0 | 346 | 1179 | 29.34690 | 0.31850 | 0 | 738 | 2053 | 35.94739 | 0.9287 | 1 | 543 | 2904 | 18.698347 | 0.7133 | 0 | 569 | 18.897376 | 0.84040 | 1 | 648 | 21.521089 | 0.33840 | 0 | 813 | 2273 | 35.76771 | 0.9901 | 1 | 252 | 771 | 32.68482 | 0.8778 | 1 | 0 | 2880 | 0.0000000 | 0.09298 | 0 | 2455 | 3011 | 81.53437 | 0.8712 | 1 | 1772 | 38 | 2.1444695 | 0.4136 | 0 | 485 | 27.3702032 | 0.9349 | 1 | 72 | 1179 | 6.1068702 | 0.8435 | 1 | 109 | 1179 | 9.245123 | 0.6964 | 0 | 0 | 3011 | 0.00000 | 0.3640 | 0 | 3.90460 | 0.8597 | 3 | 3.13968 | 0.8131 | 3 | 0.8712 | 0.8631 | 1 | 3.2524 | 0.8387 | 2 | 11.16788 | 0.8840 | 9 | 3335 | 1912 | 1362 | 1135 | 3313 | 34.25898 | 0.7948 | 1 | 188 | 1147 | 16.390584 | 0.9686 | 1 | 212 | 1058 | 20.037807 | 0.45090 | 0 | 27 | 304 | 8.881579 | 0.02679 | 0 | 239 | 1362 | 17.54772 | 0.12350 | 0 | 466 | 2537 | 18.36815 | 0.7948 | 1 | 495 | 3335 | 14.842579 | 0.8413 | 1 | 791 | 23.718141 | 0.85250 | 1 | 613 | 18.380810 | 0.27840 | 0 | 884 | 2714.0000 | 32.57185 | 0.9752 | 1 | 230 | 918.0000 | 25.05447 | 0.7925 | 1 | 25 | 3103 | 0.8056719 | 0.41920 | 0 | 2637 | 3335.0000 | 79.07046 | 0.8436 | 1 | 1912 | 0 | 0.0000000 | 0.1079 | 0 | 758 | 39.6443515 | 0.9799 | 1 | 16 | 1362 | 1.1747430 | 0.40060 | 0 | 75 | 1362.0000 | 5.506608 | 0.5316 | 0 | 8 | 3335 | 0.2398801 | 0.4965 | 0 | 3.52300 | 0.7901 | 4 | 3.31780 | 0.8870 | 3 | 0.8436 | 0.8365 | 1 | 2.51650 | 0.4924 | 1 | 10.20090 | 0.8033 | 9 | 0 | 0 | 0 | 0 | 0 | Yes | Census Tract 9567, Choctaw County, Alabama | 12737 | 60900 | 16852 | 63400 | 14774.92 | 70644 | 2077.08 | 0.1405815 | -7244 | -0.1025423 | NA | NA | NA | NA | NA |
| 01023957000 | 01023 | 957000 | AL | Alabama | Choctaw County | 3 | South Region | 6 | East South Central Division | 2567 | 1187 | 916 | 767 | 2567 | 29.87924 | 0.6933 | 0 | 145 | 1060 | 13.679245 | 0.86050 | 1 | 101 | 719 | 14.04729 | 0.04540 | 0 | 43 | 197 | 21.82741 | 0.09791 | 0 | 144 | 916 | 15.72052 | 0.02333 | 0 | 355 | 1704 | 20.83333 | 0.7366 | 0 | 289 | 2296 | 12.587108 | 0.4736 | 0 | 324 | 12.621737 | 0.51120 | 0 | 688 | 26.801714 | 0.68810 | 0 | 572 | 1746 | 32.76060 | 0.9809 | 1 | 121 | 636 | 19.02516 | 0.6414 | 0 | 5 | 2283 | 0.2190101 | 0.22520 | 0 | 1314 | 2567 | 51.18816 | 0.7225 | 0 | 1187 | 0 | 0.0000000 | 0.1224 | 0 | 335 | 28.2224094 | 0.9394 | 1 | 13 | 916 | 1.4192140 | 0.4834 | 0 | 70 | 916 | 7.641921 | 0.6353 | 0 | 0 | 2567 | 0.00000 | 0.3640 | 0 | 2.78733 | 0.5903 | 1 | 3.04680 | 0.7745 | 1 | 0.7225 | 0.7158 | 0 | 2.5445 | 0.5114 | 1 | 9.10113 | 0.6601 | 3 | 2077 | 1158 | 866 | 759 | 2072 | 36.63127 | 0.8256 | 1 | 61 | 780 | 7.820513 | 0.7726 | 1 | 106 | 735 | 14.421769 | 0.19760 | 0 | 11 | 131 | 8.396947 | 0.02525 | 0 | 117 | 866 | 13.51039 | 0.04053 | 0 | 351 | 1464 | 23.97541 | 0.8815 | 1 | 205 | 2077 | 9.870005 | 0.6729 | 0 | 402 | 19.354839 | 0.68820 | 0 | 496 | 23.880597 | 0.63430 | 0 | 466 | 1576.0000 | 29.56853 | 0.9544 | 1 | 154 | 612.0000 | 25.16340 | 0.7942 | 1 | 0 | 2002 | 0.0000000 | 0.09479 | 0 | 1018 | 2077.0000 | 49.01300 | 0.6638 | 0 | 1158 | 0 | 0.0000000 | 0.1079 | 0 | 439 | 37.9101900 | 0.9766 | 1 | 0 | 866 | 0.0000000 | 0.09796 | 0 | 42 | 866.0000 | 4.849884 | 0.4884 | 0 | 5 | 2077 | 0.2407318 | 0.4971 | 0 | 3.19313 | 0.7061 | 3 | 3.16589 | 0.8369 | 2 | 0.6638 | 0.6582 | 0 | 2.16796 | 0.3247 | 1 | 9.19078 | 0.6792 | 6 | 0 | 0 | 0 | 0 | 0 | Yes | Census Tract 9570, Choctaw County, Alabama | 16224 | 51600 | 21740 | 74000 | 18819.84 | 59856 | 2920.16 | 0.1551639 | 14144 | 0.2363005 | NA | NA | NA | NA | NA |
| 01031010500 | 01031 | 010500 | AL | Alabama | Coffee County | 3 | South Region | 6 | East South Central Division | 4529 | 1950 | 1664 | 1649 | 4022 | 40.99950 | 0.8432 | 1 | 114 | 1424 | 8.005618 | 0.56260 | 0 | 309 | 1057 | 29.23368 | 0.48130 | 0 | 251 | 607 | 41.35091 | 0.41690 | 0 | 560 | 1664 | 33.65385 | 0.45740 | 0 | 1269 | 3370 | 37.65579 | 0.9387 | 1 | 516 | 4279 | 12.058892 | 0.4492 | 0 | 832 | 18.370501 | 0.82310 | 1 | 894 | 19.739457 | 0.23950 | 0 | 1023 | 3404 | 30.05288 | 0.9666 | 1 | 303 | 1112 | 27.24820 | 0.8108 | 1 | 43 | 4270 | 1.0070258 | 0.44510 | 0 | 1761 | 4529 | 38.88276 | 0.6383 | 0 | 1950 | 6 | 0.3076923 | 0.2576 | 0 | 276 | 14.1538462 | 0.8279 | 1 | 8 | 1664 | 0.4807692 | 0.2925 | 0 | 125 | 1664 | 7.512019 | 0.6289 | 0 | 507 | 4529 | 11.19452 | 0.9441 | 1 | 3.25110 | 0.7138 | 2 | 3.28510 | 0.8639 | 3 | 0.6383 | 0.6324 | 0 | 2.9510 | 0.7136 | 2 | 10.12550 | 0.7794 | 7 | 4815 | 2118 | 1731 | 1329 | 4470 | 29.73154 | 0.7256 | 0 | 147 | 1903 | 7.724645 | 0.7670 | 1 | 209 | 1256 | 16.640127 | 0.29310 | 0 | 208 | 475 | 43.789474 | 0.51620 | 0 | 417 | 1731 | 24.09012 | 0.33700 | 0 | 953 | 3728 | 25.56330 | 0.8985 | 1 | 668 | 4485 | 14.894091 | 0.8425 | 1 | 1053 | 21.869159 | 0.79500 | 1 | 766 | 15.908619 | 0.16760 | 0 | 1010 | 3719.0000 | 27.15784 | 0.9262 | 1 | 243 | 1133.0000 | 21.44748 | 0.7184 | 0 | 1 | 4577 | 0.0218484 | 0.19150 | 0 | 1643 | 4815.0000 | 34.12253 | 0.5321 | 0 | 2118 | 0 | 0.0000000 | 0.1079 | 0 | 475 | 22.4268178 | 0.9157 | 1 | 37 | 1731 | 2.1374928 | 0.55080 | 0 | 144 | 1731.0000 | 8.318891 | 0.6750 | 0 | 330 | 4815 | 6.8535826 | 0.9282 | 1 | 3.57060 | 0.8018 | 3 | 2.79870 | 0.6649 | 2 | 0.5321 | 0.5276 | 0 | 3.17760 | 0.7990 | 2 | 10.07900 | 0.7892 | 7 | 0 | 0 | 0 | 0 | 0 | Yes | Census Tract 105, Coffee County, Alabama | 14641 | 88000 | 21367 | 78100 | 16983.56 | 102080 | 4383.44 | 0.2580990 | -23980 | -0.2349138 | 128.88 | 137.26 | Coffee County, Alabama | Dothan-Enterprise-Ozark, AL CSA | CS222 |
Log NMTC and LIHTC Variables
svi_national_nmtc_df$Median_Income_10adj_log <- log(svi_national_nmtc_df$Median_Income_10adj)
svi_national_nmtc_df$Median_Income_19_log <- log(svi_national_nmtc_df$Median_Income_19)

svi_national_nmtc_df$Median_Home_Value_10adj_log = log(svi_national_nmtc_df$Median_Home_Value_10adj)
svi_national_nmtc_df$Median_Home_Value_19_log = log(svi_national_nmtc_df$Median_Home_Value_19)

svi_national_nmtc_df$housing_price_index10_log = log(svi_national_nmtc_df$housing_price_index10)
svi_national_nmtc_df$housing_price_index20_log = log(svi_national_nmtc_df$housing_price_index20)

svi_divisional_nmtc_df$Median_Income_10adj_log <- log(svi_divisional_nmtc_df$Median_Income_10adj)
svi_divisional_nmtc_df$Median_Income_19_log <- log(svi_divisional_nmtc_df$Median_Income_19)

svi_divisional_nmtc_df$Median_Home_Value_10adj_log = log(svi_divisional_nmtc_df$Median_Home_Value_10adj)
svi_divisional_nmtc_df$Median_Home_Value_19_log = log(svi_divisional_nmtc_df$Median_Home_Value_19)

svi_divisional_nmtc_df$housing_price_index10_log = log(svi_divisional_nmtc_df$housing_price_index10)
svi_divisional_nmtc_df$housing_price_index20_log = log(svi_divisional_nmtc_df$housing_price_index20)

svi_national_lihtc_df$Median_Income_10adj_log <- log(svi_national_lihtc_df$Median_Income_10adj)
svi_national_lihtc_df$Median_Income_19_log <- log(svi_national_lihtc_df$Median_Income_19)

svi_national_lihtc_df$Median_Home_Value_10adj_log = log(svi_national_lihtc_df$Median_Home_Value_10adj)
svi_national_lihtc_df$Median_Home_Value_19_log = log(svi_national_lihtc_df$Median_Home_Value_19)

svi_national_lihtc_df$housing_price_index10_log = log(svi_national_lihtc_df$housing_price_index10)
svi_national_lihtc_df$housing_price_index20_log = log(svi_national_lihtc_df$housing_price_index20)

svi_divisional_lihtc_df$Median_Income_10adj_log <- log(svi_divisional_lihtc_df$Median_Income_10adj)
svi_divisional_lihtc_df$Median_Income_19_log <- log(svi_divisional_lihtc_df$Median_Income_19)

svi_divisional_lihtc_df$Median_Home_Value_10adj_log = log(svi_divisional_lihtc_df$Median_Home_Value_10adj)
svi_divisional_lihtc_df$Median_Home_Value_19_log = log(svi_divisional_lihtc_df$Median_Home_Value_19)

svi_divisional_lihtc_df$housing_price_index10_log = log(svi_divisional_lihtc_df$housing_price_index10)
svi_divisional_lihtc_df$housing_price_index20_log = log(svi_divisional_lihtc_df$housing_price_index20)
Diff-in-Diff Models
NMTC Evaluation
Divisional SVI
# Create 2010 df, create post variable and set to 0, create year variable and set to 2010
nmtc_did10_div_svi <- svi_divisional_nmtc_df %>%
  select(GEOID_2010_trt, cbsa, F_THEME1_10, F_THEME2_10, F_THEME3_10, F_THEME4_10, F_TOTAL_10, nmtc_flag) %>%
  mutate(post = 0,
         year = 2010) %>%
  rename("treat" = "nmtc_flag",
         "SVI_FLAG_COUNT_SES" = "F_THEME1_10",
         "SVI_FLAG_COUNT_HHCHAR" = "F_THEME2_10",
         "SVI_FLAG_COUNT_REM" = "F_THEME3_10",
         "SVI_FLAG_COUNT_HOUSETRANSPT" = "F_THEME4_10",
         "SVI_FLAG_COUNT_OVERALL" = "F_TOTAL_10")

nrow(nmtc_did10_div_svi)
## [1] 4237
# Create 2020 df, create post variable and set to 1, create year variable and set to 2020
nmtc_did20_div_svi <- svi_divisional_nmtc_df %>%
  select(GEOID_2010_trt, cbsa, F_THEME1_20, F_THEME2_20, F_THEME3_20, F_THEME4_20, F_TOTAL_20, nmtc_flag) %>%
  mutate(post = 1,
         year = 2020) %>%
  rename("treat" = "nmtc_flag",
         "SVI_FLAG_COUNT_SES" = "F_THEME1_20",
         "SVI_FLAG_COUNT_HHCHAR" = "F_THEME2_20",
         "SVI_FLAG_COUNT_REM" = "F_THEME3_20",
         "SVI_FLAG_COUNT_HOUSETRANSPT" = "F_THEME4_20",
         "SVI_FLAG_COUNT_OVERALL" = "F_TOTAL_20"
  )


nrow(nmtc_did20_div_svi)
## [1] 4237
nmtc_diff_in_diff_div_svi <- bind_rows(nmtc_did10_div_svi, nmtc_did20_div_svi)

nmtc_diff_in_diff_div_svi <- nmtc_diff_in_diff_div_svi %>% arrange(post, treat, GEOID_2010_trt)

nrow(nmtc_diff_in_diff_div_svi)
## [1] 8474
Divisional Median Income
# Create 2010 df, create post variable and set to 0, create year variable and set to 2010, remove any tracts that don't have data for 2010 and 2019
nmtc_did10_div_inc <- svi_divisional_nmtc_df %>%
  filter(!is.na(Median_Income_10adj_log)) %>% filter(!is.na(Median_Income_19_log)) %>%
  select(GEOID_2010_trt, cbsa, Median_Income_10adj_log, nmtc_flag) %>%
  mutate(post = 0,
         year = 2010) %>%
  rename("treat" = "nmtc_flag",
         "MEDIAN_INCOME" = "Median_Income_10adj_log")


nrow(nmtc_did10_div_inc)
## [1] 4234
# Create 2019 df, create post variable and set to 1, create year variable and set to 2019, remove any tracts that don't have data for 2010 and 2019
nmtc_did19_div_inc <- svi_divisional_nmtc_df %>%
  filter(!is.na(Median_Income_10adj_log)) %>% filter(!is.na(Median_Income_19_log)) %>%
  select(GEOID_2010_trt, cbsa, Median_Income_19_log, nmtc_flag) %>%
  mutate(post = 1,
         year = 2019) %>%
  rename("treat" = "nmtc_flag",
         "MEDIAN_INCOME" = "Median_Income_19_log")


nrow(nmtc_did19_div_inc)
## [1] 4234
nmtc_diff_in_diff_div_inc <- bind_rows(nmtc_did10_div_inc, nmtc_did19_div_inc)

nmtc_diff_in_diff_div_inc <- nmtc_diff_in_diff_div_inc %>% arrange(post, treat, GEOID_2010_trt)

nrow(nmtc_diff_in_diff_div_inc)
## [1] 8468
Divisional Home Value
nmtc_did10_div_mhv <- svi_divisional_nmtc_df %>%
  filter(!is.na(Median_Home_Value_10adj_log)) %>% filter(!is.na(Median_Home_Value_19_log)) %>%
  select(GEOID_2010_trt, cbsa, Median_Home_Value_10adj_log, nmtc_flag) %>%
  mutate(post = 0,
         year = 2010) %>%
  rename("treat" = "nmtc_flag",
         "MEDIAN_HOME_VALUE" = "Median_Home_Value_10adj_log")


nrow(nmtc_did10_div_mhv)
## [1] 4074
nmtc_did19_div_mhv <- svi_divisional_nmtc_df %>%
  filter(!is.na(Median_Home_Value_10adj_log)) %>% filter(!is.na(Median_Home_Value_19_log)) %>%
  select(GEOID_2010_trt, cbsa, Median_Home_Value_19_log, nmtc_flag) %>%
  mutate(post = 1,
         year = 2019) %>%
  rename("treat" = "nmtc_flag",
         "MEDIAN_HOME_VALUE" = "Median_Home_Value_19_log")


nrow(nmtc_did19_div_mhv)
## [1] 4074
nmtc_diff_in_diff_div_mhv <- bind_rows(nmtc_did10_div_mhv, nmtc_did19_div_mhv)

nmtc_diff_in_diff_div_mhv <- nmtc_diff_in_diff_div_mhv %>% arrange(post, treat, GEOID_2010_trt)

nrow(nmtc_diff_in_diff_div_mhv)
## [1] 8148
Divisional House Price Index
nmtc_did10_div_hpi <- svi_divisional_nmtc_df %>%
  filter(!is.na(housing_price_index10_log)) %>% filter(!is.na(housing_price_index20_log)) %>%
  select(GEOID_2010_trt, cbsa, housing_price_index10_log, nmtc_flag) %>%
  mutate(post = 0,
         year = 2010) %>%
  rename("treat" = "nmtc_flag",
         "HOUSE_PRICE_INDEX" = "housing_price_index10_log")


nrow(nmtc_did10_div_hpi)
## [1] 2829
nmtc_did20_div_hpi <- svi_divisional_nmtc_df %>%
  filter(!is.na(housing_price_index10_log)) %>% filter(!is.na(housing_price_index20_log)) %>%
  select(GEOID_2010_trt, cbsa, housing_price_index20_log, nmtc_flag) %>%
  mutate(post = 1,
         year = 2020) %>%
  rename("treat" = "nmtc_flag",
         "HOUSE_PRICE_INDEX" = "housing_price_index20_log")


nrow(nmtc_did20_div_hpi)
## [1] 2829
nmtc_diff_in_diff_div_hpi <- bind_rows(nmtc_did10_div_hpi, nmtc_did20_div_hpi)

nmtc_diff_in_diff_div_hpi <- nmtc_diff_in_diff_div_hpi %>% arrange(post, treat, GEOID_2010_trt)

nrow(nmtc_diff_in_diff_div_hpi)
## [1] 5658
NMTC Divisional Model
# SVI & Economic Models

m1_nmtc_div <- lm( SVI_FLAG_COUNT_SES ~ treat + post + treat*post + cbsa, data=nmtc_diff_in_diff_div_svi )

m2_nmtc_div <- lm( SVI_FLAG_COUNT_HHCHAR ~ treat + post + treat*post + cbsa, data=nmtc_diff_in_diff_div_svi )

m3_nmtc_div <- lm( SVI_FLAG_COUNT_REM ~ treat + post + treat*post + cbsa, data=nmtc_diff_in_diff_div_svi )

m4_nmtc_div <- lm( SVI_FLAG_COUNT_HOUSETRANSPT ~ treat + post + treat*post + cbsa, data=nmtc_diff_in_diff_div_svi )

m5_nmtc_div <- lm( SVI_FLAG_COUNT_OVERALL  ~ treat + post + treat*post + cbsa, data=nmtc_diff_in_diff_div_svi)

m6_nmtc_div <- lm( MEDIAN_INCOME ~ treat + post + treat*post + cbsa, data=nmtc_diff_in_diff_div_inc )

m7_nmtc_div <- lm( MEDIAN_HOME_VALUE ~ treat + post + treat*post + cbsa, data=nmtc_diff_in_diff_div_mhv )

m8_nmtc_div <- lm( HOUSE_PRICE_INDEX ~ treat + post + treat*post + cbsa, data=nmtc_diff_in_diff_div_hpi )

# Add all models to a list
models <- list(

  "SES" = m1_nmtc_div,
  "HHChar"  = m2_nmtc_div,
  "REM" = m3_nmtc_div,
  "HOUSETRANSPT" = m4_nmtc_div,
  "OVERALL" = m5_nmtc_div,
  "Median Income (USD, logged)" = m6_nmtc_div,
  "Median Home Value (USD, logged)" = m7_nmtc_div,
  "House Price Index (logged)" = m8_nmtc_div
)


# Display model results
modelsummary(models,  fmt = 2, stars = c('*' = .05, '**' = .01, '***' = .001), coef_omit = "cbsa", gof_omit = "IC|Log",
             notes = list('All models include metro-level fixed effects by core-based statistical area (cbsa).'),
             title = paste0("Differences-in-Differences Linear Regression Analysis of NMTC in ", census_division)) %>%
  group_tt(j = list("Social Vulnerability" = 2:6, "Economic Outcomes" = 7:9))
| Social Vulnerability | Economic Outcomes | |||||||
|---|---|---|---|---|---|---|---|---|
| SES | HHChar | REM | HOUSETRANSPT | OVERALL | Median Income (USD, logged) | Median Home Value (USD, logged) | House Price Index (logged) | |
| (Intercept) | 1.10*** | 1.88*** | 0.05 | 1.15*** | 4.18*** | 10.13*** | 11.89*** | 5.12*** |
| (0.31) | (0.23) | (0.09) | (0.23) | (0.62) | (0.06) | (0.09) | (0.10) | |
| treat | 0.63*** | 0.24*** | 0.15*** | 0.40*** | 1.43*** | -0.14*** | -0.00 | -0.04 |
| (0.10) | (0.07) | (0.03) | (0.07) | (0.20) | (0.02) | (0.03) | (0.04) | |
| post | -0.06 | -0.09*** | 0.00 | -0.03 | -0.17** | 0.04*** | -0.05*** | 0.65*** |
| (0.03) | (0.02) | (0.01) | (0.02) | (0.06) | (0.01) | (0.01) | (0.01) | |
| treat × post | -0.05 | -0.05 | -0.01 | -0.01 | -0.12 | 0.06* | 0.00 | -0.02 |
| (0.14) | (0.10) | (0.04) | (0.10) | (0.28) | (0.03) | (0.04) | (0.05) | |
| Num.Obs. | 8240 | 8240 | 8240 | 8240 | 8240 | 8236 | 7916 | 5526 |
| R2 | 0.270 | 0.112 | 0.301 | 0.060 | 0.233 | 0.182 | 0.417 | 0.488 |
| R2 Adj. | 0.264 | 0.104 | 0.295 | 0.052 | 0.227 | 0.175 | 0.412 | 0.481 |
| RMSE | 1.36 | 1.01 | 0.41 | 1.04 | 2.77 | 0.27 | 0.40 | 0.40 |
|
||||||||
| All models include metro-level fixed effects by core-based statistical area (cbsa). | ||||||||
Differences-in-Differences Linear Regression Analysis of NMTC in Pacific Division
In the social vulnerability model, none of the categories returned statistically significant changes. In the economic conditions model, only median income was statistically significant. Median income was greater in tracts that received NMTC dollars compared to eligible tracts that didn’t. There was an increase of 6% (0.06*100) for each 1-unit increase.
The social vulnerability model results mean we can’t conclude there was a program impact in the Pacific Division. However, it’s important to note that the treatment group (counties that participated in NMTC) were more likely to have received more SVI flags across all four themes and overall.
Visualize Median Income
status <- c("NMTC Non-Participant",
             "NMTC Participant Counterfactual",
             "NMTC Participant",
             "NMTC Non-Participant",
             "NMTC Participant Counterfactual",
             "NMTC Participant")
year <- c(2010,
          2010,
          2010,
          2020,
          2020,
          2020)
outcome <- c(exp(m6_nmtc_div$coefficients[1]),
           exp(m6_nmtc_div$coefficients[1])*exp(m6_nmtc_div$coefficients[2]),
           exp(m6_nmtc_div$coefficients[1])*exp(m6_nmtc_div$coefficients[2]),
           exp(m6_nmtc_div$coefficients[1])*exp(m6_nmtc_div$coefficients[3]),
           exp(m6_nmtc_div$coefficients[1])*exp(m6_nmtc_div$coefficients[2])*exp(m6_nmtc_div$coefficients[3]),
           exp(m6_nmtc_div$coefficients[1])*exp(m6_nmtc_div$coefficients[2])*exp(m6_nmtc_div$coefficients[3])*exp(m6_nmtc_div$coefficients[length(m6_nmtc_div$coefficients)])
)

svidiv_viz_medinc_nmtc <- data.frame(status, year, outcome)

### Note that instead of rounding like we did for SVI variables, we will be formatting our outcome as US dollars
svidiv_viz_medinc_nmtc$outcome_label <- scales::dollar_format()(svidiv_viz_medinc_nmtc$outcome)

svidiv_viz_medinc_nmtc
##                            status year  outcome outcome_label
## 1            NMTC Non-Participant 2010 24986.85    $24,986.85
## 2 NMTC Participant Counterfactual 2010 21799.86    $21,799.86
## 3                NMTC Participant 2010 21799.86    $21,799.86
## 4            NMTC Non-Participant 2020 26029.35    $26,029.35
## 5 NMTC Participant Counterfactual 2020 22709.39    $22,709.39
## 6                NMTC Participant 2020 24050.91    $24,050.91
slopegraph_plot(svidiv_viz_medinc_nmtc, "NMTC Participant", "NMTC Non-Participant", "Impact of NMTC Program on Average Median Income", paste0(census_division, " | 2010 - 2020"))
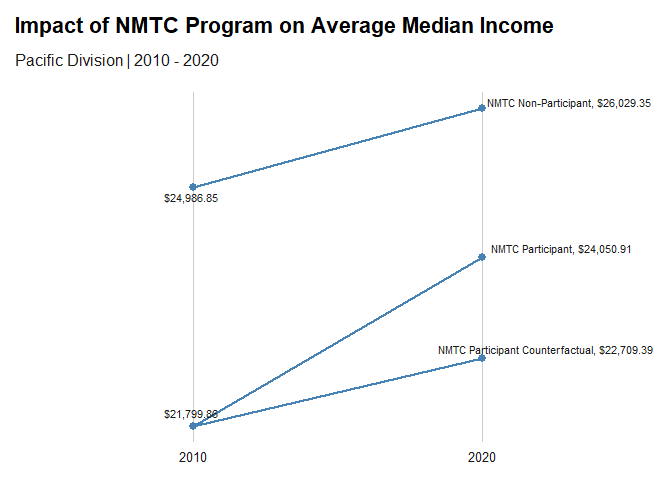
From the slopegraph, we can see that incomes in increased across the board. However, the gap between the participant counterfactual and the actual outcome is statistically significant. NMTC participants would be expected see median household income increase from $21,799.86 in 2010 to $22,709.39 in 2020. However, participation in NMTC increase the rate of growth, which saw the average median household income for participating counties rise to $24,050.91.
LIHTC Evaluation
Divisional SVI
# Create 2010 df, create post variable and set to 0, create year variable and set to 2010
lihtc_did10_div_svi <- svi_divisional_lihtc_df %>%
  select(GEOID_2010_trt, cbsa, F_THEME1_10, F_THEME2_10, F_THEME3_10, F_THEME4_10, F_TOTAL_10, lihtc_flag) %>%
  mutate(post = 0,
         year = 2010) %>%
  rename("treat" = "lihtc_flag",
         "SVI_FLAG_COUNT_SES" = "F_THEME1_10",
         "SVI_FLAG_COUNT_HHCHAR" = "F_THEME2_10",
         "SVI_FLAG_COUNT_REM" = "F_THEME3_10",
         "SVI_FLAG_COUNT_HOUSETRANSPT" = "F_THEME4_10",
         "SVI_FLAG_COUNT_OVERALL" = "F_TOTAL_10")

nrow(lihtc_did10_div_svi)
## [1] 584
# Create 2020 df, create post variable and set to 1, create year variable and set to 2020
lihtc_did20_div_svi <- svi_divisional_lihtc_df %>%
  select(GEOID_2010_trt, cbsa, F_THEME1_20, F_THEME2_20, F_THEME3_20, F_THEME4_20, F_TOTAL_20, lihtc_flag) %>%
  mutate(post = 1,
         year = 2020) %>%
  rename("treat" = "lihtc_flag",
         "SVI_FLAG_COUNT_SES" = "F_THEME1_20",
         "SVI_FLAG_COUNT_HHCHAR" = "F_THEME2_20",
         "SVI_FLAG_COUNT_REM" = "F_THEME3_20",
         "SVI_FLAG_COUNT_HOUSETRANSPT" = "F_THEME4_20",
         "SVI_FLAG_COUNT_OVERALL" = "F_TOTAL_20"
  )


nrow(lihtc_did20_div_svi)
## [1] 584
lihtc_diff_in_diff_div_svi <- bind_rows(lihtc_did10_div_svi, lihtc_did20_div_svi)

lihtc_diff_in_diff_div_svi <- lihtc_diff_in_diff_div_svi %>% arrange(post, treat, GEOID_2010_trt)

nrow(lihtc_diff_in_diff_div_svi)
## [1] 1168
Divisional Median Income
# Create 2010 df, create post variable and set to 0, create year variable and set to 2010, remove any tracts that don't have data for 2010 and 2019
lihtc_did10_div_inc <- svi_divisional_lihtc_df %>%
  filter(!is.na(Median_Income_10adj_log)) %>% filter(!is.na(Median_Income_19_log)) %>%
  select(GEOID_2010_trt, cbsa, Median_Income_10adj_log, lihtc_flag) %>%
  mutate(post = 0,
         year = 2010) %>%
  rename("treat" = "lihtc_flag",
         "MEDIAN_INCOME" = "Median_Income_10adj_log")


nrow(lihtc_did10_div_inc)
## [1] 583
# Create 2019 df, create post variable and set to 1, create year variable and set to 2019, remove any tracts that don't have data for 2010 and 2019
lihtc_did19_div_inc <- svi_divisional_lihtc_df %>%
  filter(!is.na(Median_Income_10adj_log)) %>% filter(!is.na(Median_Income_19_log)) %>%
  select(GEOID_2010_trt, cbsa, Median_Income_19_log, lihtc_flag) %>%
  mutate(post = 1,
         year = 2019) %>%
  rename("treat" = "lihtc_flag",
         "MEDIAN_INCOME" = "Median_Income_19_log")


nrow(lihtc_did19_div_inc)
## [1] 583
lihtc_diff_in_diff_div_inc <- bind_rows(lihtc_did10_div_inc, lihtc_did19_div_inc)

lihtc_diff_in_diff_div_inc <- lihtc_diff_in_diff_div_inc %>% arrange(post, treat, GEOID_2010_trt)

nrow(lihtc_diff_in_diff_div_inc)
## [1] 1166
Divisional Median Home Value
lihtc_did10_div_mhv <- svi_divisional_lihtc_df %>%
  filter(!is.na(Median_Home_Value_10adj_log)) %>% filter(!is.na(Median_Home_Value_19_log)) %>%
  select(GEOID_2010_trt, cbsa, Median_Home_Value_10adj_log, lihtc_flag) %>%
  mutate(post = 0,
         year = 2010) %>%
  rename("treat" = "lihtc_flag",
         "MEDIAN_HOME_VALUE" = "Median_Home_Value_10adj_log")


nrow(lihtc_did10_div_mhv)
## [1] 543
lihtc_did19_div_mhv <- svi_divisional_lihtc_df %>%
  filter(!is.na(Median_Home_Value_10adj_log)) %>% filter(!is.na(Median_Home_Value_19_log)) %>%
  select(GEOID_2010_trt, cbsa, Median_Home_Value_19_log, lihtc_flag) %>%
  mutate(post = 1,
         year = 2019) %>%
  rename("treat" = "lihtc_flag",
         "MEDIAN_HOME_VALUE" = "Median_Home_Value_19_log")


nrow(lihtc_did19_div_mhv)
## [1] 543
lihtc_diff_in_diff_div_mhv <- bind_rows(lihtc_did10_div_mhv, lihtc_did19_div_mhv)

lihtc_diff_in_diff_div_mhv <- lihtc_diff_in_diff_div_mhv %>% arrange(post, treat, GEOID_2010_trt)

nrow(lihtc_diff_in_diff_div_mhv)
## [1] 1086
Divisional House Price Index
lihtc_did10_div_hpi <- svi_divisional_lihtc_df %>%
  filter(!is.na(housing_price_index10_log)) %>% filter(!is.na(housing_price_index20_log)) %>%
  select(GEOID_2010_trt, cbsa, housing_price_index10_log, lihtc_flag) %>%
  mutate(post = 0,
         year = 2010) %>%
  rename("treat" = "lihtc_flag",
         "HOUSE_PRICE_INDEX" = "housing_price_index10_log")


nrow(lihtc_did10_div_hpi)
## [1] 310
lihtc_did20_div_hpi <- svi_divisional_lihtc_df %>%
  filter(!is.na(housing_price_index10_log)) %>% filter(!is.na(housing_price_index20_log)) %>%
  select(GEOID_2010_trt, cbsa, housing_price_index20_log, lihtc_flag) %>%
  mutate(post = 1,
         year = 2020) %>%
  rename("treat" = "lihtc_flag",
         "HOUSE_PRICE_INDEX" = "housing_price_index20_log")


nrow(lihtc_did20_div_hpi)
## [1] 310
lihtc_diff_in_diff_div_hpi <- bind_rows(lihtc_did10_div_hpi, lihtc_did20_div_hpi)

lihtc_diff_in_diff_div_hpi <- lihtc_diff_in_diff_div_hpi %>% arrange(post, treat, GEOID_2010_trt)

nrow(lihtc_diff_in_diff_div_hpi)
## [1] 620
LIHTC Divisional Model
# SVI & Economic Models

m1_lihtc_div <- lm( SVI_FLAG_COUNT_SES ~ treat + post + treat*post + cbsa, data=lihtc_diff_in_diff_div_svi )

m2_lihtc_div <- lm( SVI_FLAG_COUNT_HHCHAR ~ treat + post + treat*post + cbsa, data=lihtc_diff_in_diff_div_svi )

m3_lihtc_div <- lm( SVI_FLAG_COUNT_REM ~ treat + post + treat*post + cbsa, data=lihtc_diff_in_diff_div_svi )

m4_lihtc_div <- lm( SVI_FLAG_COUNT_HOUSETRANSPT ~ treat + post + treat*post + cbsa, data=lihtc_diff_in_diff_div_svi )

m5_lihtc_div <- lm( SVI_FLAG_COUNT_OVERALL  ~ treat + post + treat*post + cbsa, data=lihtc_diff_in_diff_div_svi)

m6_lihtc_div <- lm( MEDIAN_INCOME ~ treat + post + treat*post + cbsa, data=lihtc_diff_in_diff_div_inc )

m7_lihtc_div <- lm( MEDIAN_HOME_VALUE ~ treat + post + treat*post + cbsa, data=lihtc_diff_in_diff_div_mhv )

m8_lihtc_div <- lm( HOUSE_PRICE_INDEX ~ treat + post + treat*post + cbsa, data=lihtc_diff_in_diff_div_hpi )

# Add all models to a list
models <- list(

  "SES" = m1_lihtc_div,
  "HHChar"  = m2_lihtc_div,
  "REM" = m3_lihtc_div,
  "HOUSETRANSPT" = m4_lihtc_div,
  "OVERALL" = m5_lihtc_div,
  "Median Income (USD, logged)" = m6_lihtc_div,
  "Median Home Value (USD, logged)" = m7_lihtc_div,
  "House Price Index (logged)" = m8_lihtc_div
)


# Display model results
modelsummary(models,  fmt = 2, stars = c('*' = .05, '**' = .01, '***' = .001), coef_omit = "cbsa", gof_omit = "IC|Log",
             notes = list('All models include metro-level fixed effects by core-based statistical area (cbsa).'),
             title = paste0("Differences-in-Differences Linear Regression Analysis of LIHTC in ", census_division)) %>%
  group_tt(j = list("Social Vulnerability" = 2:6, "Economic Outcomes" = 7:9))
| Social Vulnerability | Economic Outcomes | |||||||
|---|---|---|---|---|---|---|---|---|
| SES | HHChar | REM | HOUSETRANSPT | OVERALL | Median Income (USD, logged) | Median Home Value (USD, logged) | House Price Index (logged) | |
| (Intercept) | 1.59 | 2.50*** | -0.02 | 2.99*** | 7.05*** | 9.86*** | 11.68*** | 4.83*** |
| (0.81) | (0.69) | (0.27) | (0.68) | (1.64) | (0.21) | (0.35) | (0.27) | |
| treat | 0.01 | 0.13 | 0.03 | 0.04 | 0.21 | -0.02 | 0.02 | 0.00 |
| (0.12) | (0.10) | (0.04) | (0.10) | (0.24) | (0.03) | (0.05) | (0.05) | |
| post | -0.20** | -0.19** | -0.03 | -0.17** | -0.59*** | 0.07*** | -0.06 | 0.74*** |
| (0.08) | (0.06) | (0.03) | (0.06) | (0.15) | (0.02) | (0.03) | (0.03) | |
| treat × post | 0.01 | -0.05 | 0.01 | 0.10 | 0.07 | 0.02 | 0.00 | -0.05 |
| (0.17) | (0.14) | (0.06) | (0.14) | (0.34) | (0.04) | (0.07) | (0.08) | |
| Num.Obs. | 1146 | 1146 | 1146 | 1146 | 1146 | 1146 | 1066 | 618 |
| R2 | 0.241 | 0.213 | 0.334 | 0.062 | 0.266 | 0.228 | 0.350 | 0.547 |
| R2 Adj. | 0.217 | 0.188 | 0.313 | 0.033 | 0.243 | 0.203 | 0.328 | 0.523 |
| RMSE | 1.12 | 0.95 | 0.38 | 0.94 | 2.26 | 0.30 | 0.48 | 0.37 |
|
||||||||
| All models include metro-level fixed effects by core-based statistical area (cbsa). | ||||||||
Differences-in-Differences Linear Regression Analysis of LIHTC in Pacific Division
Neither of the diff-in-diff models return statistically significant changes for LIHTC participation. We can’t conclude that the program had a measurable impact, but this study alone is not evidence enough to disprove potential effects. Additional research is needed.