NMTC and LIHTC Evaluation
Introduction
The goal of this analysis is to estimate the causal impact of the Low-Income Housing Tax Credit (LIHTC) and the New Markets Tax Credit (NMTC) on neighborhood outcomes by using a differences-in-differences (DiD) framework. A DiD model compares changes over time in treated units (census tracts that received LIHTC or NMTC funding) versus control units (non-funded tracts), allowing us to net out both time-invariant tract characteristics and common temporal shocks.
Diff-in-Diff models
For our analysis of the effectiveness of the New Markets Tax Credit (NMTC) and Low Income Housing Tax Credit (LIHTC) as a tool for community revitalization and the reduction of social vulnerability in neighborhoods across the Middle Atlantic Division, we will employ a Diff-In-Diff model of linear regression.
Diff-In-Diff models are a statistical technique that allows us to analyze the differences in differences of changes across time periods to determine whether our program intervention resulted in an additional increase or decrease beyond what we would expect following general trends in similar controls.
Dependent Variables: SVI Variables, House Price Index, Median Home Values, and Median Income
We model four SVI themes—socioeconomic status (SES), household characteristics (HHCHAR), minority status & language (REM), and housing & transportation (HOUSETRANSPT)—plus the overall SVI flag count. Economically, we include log-transformed median household income, log median home value, and log house price index, each measured for 2010 (inflation-adjusted) and 2020.
Independent Variables: NMTC and LIHTC Data
Our key independent variables are:
-
treat: a binary indicator for tract participation in NMTC (or LIHTC) funding,
-
post: a binary indicator for the post-treatment period (2020), and
3.treat × post: the interaction term capturing the DiD treatment effect. We also include CBSA fixed effects to control for time-invariant metro characteristics.
Library
# Load packages
library(here)         # relative filepaths for reproducibility
library(rio)          # read excel file from URL
library(tidyverse)    # data wrangling
library(stringi)      # string data wrangling
library(tidycensus)   # US census data
library(ggplot2)      # data visualization
library(kableExtra)   # table formatting
library(scales)       # palette and number formatting
library(unhcrthemes)  # data visualization themes
library(ggrepel)      # data visualization formatting to avoid overlapping
library(rcompanion)   # data visualization of variable distribution
library(ggpubr)       # data visualization of variable distribution
library(moments)      # measures of skewness and kurtosis
library(tinytable)    # format regression tables
library(modelsummary) # format regression tables
Load Functions
import::here( "fips_census_regions",
              "load_svi_data",
              "merge_svi_data",
              "census_division",
              "slopegraph_plot",
              "census_pull",
             # notice the use of here::here() that points to the .R file
             # where all these R objects are created
             .from = here::here("analysis/project_data_steps_gregorio.R"),
             .character_only = TRUE)
# Load API key, assign to TidyCensus Package
source(here::here("analysis/password.R"))
census_api_key(census_api_key)
## To install your API key for use in future sessions, run this function with `install = TRUE`.
Data
# Load NMTC AND LIHTC data sets

svi_divisional_nmtc <- readRDS(here::here(paste0("data/wrangling/", str_replace_all(census_division, " ", "_"), "_svi_divisional_nmtc.rds")))

svi_national_nmtc <- readRDS(here::here(paste0("data/wrangling/", str_replace_all(census_division, " ", "_"), "_svi_national_nmtc.rds")))

svi_divisional_lihtc <- readRDS(here::here(paste0("data/wrangling/", str_replace_all(census_division, " ", "_"), "_svi_divisional_lihtc.rds")))

svi_national_lihtc <- readRDS(here::here(paste0("data/wrangling/", str_replace_all(census_division, " ", "_"), "_svi_national_lihtc.rds")))
House Price Index Data
hpi_df <- read.csv("https://r-class.github.io/paf-515-course-materials/data/raw/HPI/HPI_AT_BDL_tract.csv")

hpi_df_10_20 <- hpi_df %>%
  mutate(GEOID10 = str_pad(tract, 11, "left", pad=0)) %>%
  filter(year %in% c(2010, 2020))  %>%
 select(GEOID10, state_abbr, year, hpi) %>%
  pivot_wider(names_from = year, values_from = hpi) %>%
  mutate(housing_price_index10 = `2010`,
         housing_price_index20 = `2020`) %>%
  select(GEOID10, state_abbr, housing_price_index10, housing_price_index20)

# View data
hpi_df_10_20 %>% head() %>% kbl() %>% kable_styling() %>% scroll_box(width = "100%")
| GEOID10 | state_abbr | housing_price_index10 | housing_price_index20 |
|---|---|---|---|
| 01001020100 | AL | 132.35 | 152.78 |
| 01001020200 | AL | 123.78 | 123.37 |
| 01001020300 | AL | 158.57 | 167.01 |
| 01001020400 | AL | 165.11 | 179.60 |
| 01001020501 | AL | 172.55 | 180.96 |
| 01001020502 | AL | 158.75 | 164.25 |
# Drop state_abbr column for joining
hpi_df_10_20 <- hpi_df_10_20 %>% select(-state_abbr)
CBSA Crosswalk Data
msa_csa_crosswalk <- rio::import("https://r-class.github.io/paf-515-course-materials/data/raw/CSA_MSA_Crosswalk/qcew-county-msa-csa-crosswalk.xlsx", which=4)

msa_csa_crosswalk <- msa_csa_crosswalk %>%
  mutate(county_fips = str_pad(`County Code`, 5, "left", pad=0),
         cbsa = coalesce(`CSA Title`, `MSA Title`),
         cbsa_code = coalesce(`CSA Code`, `MSA Code`),
         county_title = `County Title`)  %>%
  select(county_fips, county_title, cbsa, cbsa_code)

msa_csa_crosswalk %>% head() %>% kbl() %>% kable_styling() %>% scroll_box(width = "100%")
| county_fips | county_title | cbsa | cbsa_code |
|---|---|---|---|
| 01001 | Autauga County, Alabama | Montgomery-Alexander City, AL CSA | CS388 |
| 01003 | Baldwin County, Alabama | Mobile-Daphne-Fairhope, AL CSA | CS380 |
| 01005 | Barbour County, Alabama | Eufaula, AL-GA MicroSA | C2164 |
| 01007 | Bibb County, Alabama | Birmingham-Hoover-Cullman, AL CSA | CS142 |
| 01009 | Blount County, Alabama | Birmingham-Hoover-Cullman, AL CSA | CS142 |
| 01015 | Calhoun County, Alabama | Anniston-Oxford, AL MSA | C1150 |
Census Data
states <- list(svi_national_nmtc$state %>% unique())
states
## [[1]]
##  [1] "AL" "AK" "AZ" "AR" "CA" "CO" "CT" "DE" "DC" "FL" "GA" "HI" "ID" "IL" "IN"
## [16] "IA" "KS" "KY" "LA" "ME" "MD" "MA" "MI" "MN" "MS" "MO" "MT" "NE" "NV" "NH"
## [31] "NJ" "NM" "NY" "NC" "ND" "OH" "OK" "OR" "PA" "RI" "SC" "SD" "TN" "TX" "UT"
## [46] "VT" "VA" "WA" "WV" "WI" "WY"
census_pull10 <- lapply(states, census_pull, yr = 2010)

census_pull10_df <- census_pull10[[1]] %>%
  # Drop margin of error column
  select(-moe) %>%
  # Add suffix to variable names
  mutate(variable = paste0(variable, "_10")) %>%
  # Pivot data frame
  pivot_wider(
    names_from = variable,
    values_from = c(estimate)
  )

census_pull10_df %>% head(10) %>% kbl() %>% kable_styling() %>% scroll_box(width = "100%")
| GEOID | NAME | Median_Income_10 | Median_Home_Value_10 |
|---|---|---|---|
| 01001020100 | Census Tract 201, Autauga County, Alabama | 31769 | 120700 |
| 01001020200 | Census Tract 202, Autauga County, Alabama | 19437 | 138500 |
| 01001020300 | Census Tract 203, Autauga County, Alabama | 24146 | 111300 |
| 01001020400 | Census Tract 204, Autauga County, Alabama | 27735 | 126300 |
| 01001020500 | Census Tract 205, Autauga County, Alabama | 35517 | 173000 |
| 01001020600 | Census Tract 206, Autauga County, Alabama | 24597 | 110700 |
| 01001020700 | Census Tract 207, Autauga County, Alabama | 22114 | 93800 |
| 01001020801 | Census Tract 208.01, Autauga County, Alabama | 30841 | 258000 |
| 01001020802 | Census Tract 208.02, Autauga County, Alabama | 29006 | 145100 |
| 01001020900 | Census Tract 209, Autauga County, Alabama | 24841 | 108000 |
census_pull19 <- lapply(states, census_pull, yr = 2019)

census_pull19_df <- census_pull19[[1]] %>%
  # Select columns
  select(GEOID, NAME, variable, estimate, moe) %>%
  # Create individual FIPS columns for state, county, and tract
  mutate(FIPS_st = substr(GEOID, 1, 2),
         FIPS_county = substr(GEOID, 3, 5),
         FIPS_tract = substr(GEOID, 6, 11)) %>%
# Los Angeles, CA Census Tract fixes
                      mutate(FIPS_tract2 = if_else((FIPS_county == "037" & FIPS_st == "06" & FIPS_tract == "137000"), "930401", FIPS_tract )) %>%
# Pima County, AZ Census Tract fixes
                      mutate(FIPS_tract2 = if_else((FIPS_county == "019" & FIPS_st == "04" & FIPS_tract == "002704"), "002701", FIPS_tract2 )) %>%
                      mutate(FIPS_tract2 = if_else((FIPS_county == "019" & FIPS_st == "04" & FIPS_tract == "002906"), "002903", FIPS_tract2 )) %>%
                      mutate(FIPS_tract2 = if_else((FIPS_county == "019" & FIPS_st == "04" & FIPS_tract == "004118"), "410501", FIPS_tract2 )) %>%
                      mutate(FIPS_tract2 = if_else((FIPS_county == "019" & FIPS_st == "04" & FIPS_tract == "004121"), "410502", FIPS_tract2 )) %>%
                      mutate(FIPS_tract2 = if_else((FIPS_county == "019" & FIPS_st == "04" & FIPS_tract == "004125"), "410503", FIPS_tract2 )) %>%
                      mutate(FIPS_tract2 = if_else((FIPS_county == "019" & FIPS_st == "04" & FIPS_tract == "005200"), "470400", FIPS_tract2 )) %>%
                      mutate(FIPS_tract2 = if_else((FIPS_county == "019" & FIPS_st == "04" & FIPS_tract == "005300"), "470500", FIPS_tract2 )) %>%
# Madison County, NY Census Tract fixes
                      mutate(FIPS_tract2 = if_else((FIPS_county == "053" & FIPS_st == "36" & FIPS_tract == "030101"), "940101", FIPS_tract2 )) %>%
                      mutate(FIPS_tract2 = if_else((FIPS_county == "053" & FIPS_st == "36" & FIPS_tract == "030102"), "940102", FIPS_tract2 )) %>%
                      mutate(FIPS_tract2 = if_else((FIPS_county == "053" & FIPS_st == "36" & FIPS_tract == "030103"), "940103", FIPS_tract2 )) %>%
                      mutate(FIPS_tract2 = if_else((FIPS_county == "053" & FIPS_st == "36" & FIPS_tract == "030200"), "940200", FIPS_tract2 )) %>%
                      mutate(FIPS_tract2 = if_else((FIPS_county == "053" & FIPS_st == "36" & FIPS_tract == "030300"), "940300", FIPS_tract2 )) %>%
                      mutate(FIPS_tract2 = if_else((FIPS_county == "053" & FIPS_st == "36" & FIPS_tract == "030401"), "940401", FIPS_tract2 )) %>%
                      mutate(FIPS_tract2 = if_else((FIPS_county == "053" & FIPS_st == "36" & FIPS_tract == "030403"), "940403", FIPS_tract2 )) %>%
                      mutate(FIPS_tract2 = if_else((FIPS_county == "053" & FIPS_st == "36" & FIPS_tract == "030600"), "940600", FIPS_tract2 )) %>%
                      mutate(FIPS_tract2 = if_else((FIPS_county == "053" & FIPS_st == "36" & FIPS_tract == "030402"), "940700", FIPS_tract2 )) %>%
# Oneida County, NY Census Tract fixes
                      mutate(FIPS_tract2 = if_else((FIPS_county == "065" & FIPS_st == "36" & FIPS_tract == "024800"), "940000", FIPS_tract2 )) %>%
                      mutate(FIPS_tract2 = if_else((FIPS_county == "065" & FIPS_st == "36" & FIPS_tract == "024700"), "940100", FIPS_tract2 )) %>%
                      mutate(FIPS_tract2 = if_else((FIPS_county == "065" & FIPS_st == "36" & FIPS_tract == "024900"), "940200", FIPS_tract2 )) %>%
                      # Move columns in data set
                      relocate(c(FIPS_st, FIPS_county, FIPS_tract, FIPS_tract2),.after = GEOID) %>%
                      # Create new GEOID column
                      mutate(GEOID = paste0(FIPS_st, FIPS_county, FIPS_tract2)) %>%
                      # Drop newly created FIPS columns and margin of error
                      select(-FIPS_st, -FIPS_county, -FIPS_tract, -FIPS_tract2, -moe) %>%
                      # Add suffix
                      mutate(variable = paste0(variable, "_19")) %>%
                      # Pivot data set
                      pivot_wider(
                        names_from = variable,
                        values_from = c(estimate)
                      )

census_pull19_df %>% head(10) %>% kbl() %>% kable_styling() %>% scroll_box(width = "100%")
| GEOID | NAME | Median_Income_19 | Median_Home_Value_19 |
|---|---|---|---|
| 01001020100 | Census Tract 201, Autauga County, Alabama | 25970 | 136100 |
| 01001020200 | Census Tract 202, Autauga County, Alabama | 20154 | 90500 |
| 01001020300 | Census Tract 203, Autauga County, Alabama | 27383 | 122600 |
| 01001020400 | Census Tract 204, Autauga County, Alabama | 34620 | 152700 |
| 01001020500 | Census Tract 205, Autauga County, Alabama | 41178 | 186900 |
| 01001020600 | Census Tract 206, Autauga County, Alabama | 21146 | 103600 |
| 01001020700 | Census Tract 207, Autauga County, Alabama | 20934 | 82400 |
| 01001020801 | Census Tract 208.01, Autauga County, Alabama | 31667 | 322900 |
| 01001020802 | Census Tract 208.02, Autauga County, Alabama | 33086 | 171500 |
| 01001020900 | Census Tract 209, Autauga County, Alabama | 32677 | 156900 |
inflation_adj = 1.16

# Join 2010 and 2019 Median Income and Home Value Data
census_pull_df <- left_join(census_pull10_df, census_pull19_df[c("GEOID", "Median_Income_19", "Median_Home_Value_19")], join_by("GEOID" == "GEOID"))

# Create new inflation adjusted columns for 2010 median income and median home value, find changes over time
census_pull_df <- census_pull_df %>%
                   mutate(Median_Income_10adj = Median_Income_10*inflation_adj,
                          Median_Home_Value_10adj = Median_Home_Value_10*inflation_adj,
                          Median_Income_Change = Median_Income_19 - Median_Income_10adj,
                          Median_Income_Change_pct = (Median_Income_19 - Median_Income_10adj)/Median_Income_10adj,
                          Median_Home_Value_Change = Median_Home_Value_19 - Median_Home_Value_10adj,
                          Median_Home_Value_Change_pct = (Median_Home_Value_19 - Median_Home_Value_10adj)/Median_Home_Value_10adj)

# View data
census_pull_df %>% head(10) %>% kbl() %>% kable_styling() %>% scroll_box(width = "100%")
| GEOID | NAME | Median_Income_10 | Median_Home_Value_10 | Median_Income_19 | Median_Home_Value_19 | Median_Income_10adj | Median_Home_Value_10adj | Median_Income_Change | Median_Income_Change_pct | Median_Home_Value_Change | Median_Home_Value_Change_pct |
|---|---|---|---|---|---|---|---|---|---|---|---|
| 01001020100 | Census Tract 201, Autauga County, Alabama | 31769 | 120700 | 25970 | 136100 | 36852.04 | 140012 | -10882.04 | -0.2952900 | -3912 | -0.0279405 |
| 01001020200 | Census Tract 202, Autauga County, Alabama | 19437 | 138500 | 20154 | 90500 | 22546.92 | 160660 | -2392.92 | -0.1061307 | -70160 | -0.4366986 |
| 01001020300 | Census Tract 203, Autauga County, Alabama | 24146 | 111300 | 27383 | 122600 | 28009.36 | 129108 | -626.36 | -0.0223625 | -6508 | -0.0504074 |
| 01001020400 | Census Tract 204, Autauga County, Alabama | 27735 | 126300 | 34620 | 152700 | 32172.60 | 146508 | 2447.40 | 0.0760709 | 6192 | 0.0422639 |
| 01001020500 | Census Tract 205, Autauga County, Alabama | 35517 | 173000 | 41178 | 186900 | 41199.72 | 200680 | -21.72 | -0.0005272 | -13780 | -0.0686665 |
| 01001020600 | Census Tract 206, Autauga County, Alabama | 24597 | 110700 | 21146 | 103600 | 28532.52 | 128412 | -7386.52 | -0.2588807 | -24812 | -0.1932218 |
| 01001020700 | Census Tract 207, Autauga County, Alabama | 22114 | 93800 | 20934 | 82400 | 25652.24 | 108808 | -4718.24 | -0.1839309 | -26408 | -0.2427027 |
| 01001020801 | Census Tract 208.01, Autauga County, Alabama | 30841 | 258000 | 31667 | 322900 | 35775.56 | 299280 | -4108.56 | -0.1148426 | 23620 | 0.0789227 |
| 01001020802 | Census Tract 208.02, Autauga County, Alabama | 29006 | 145100 | 33086 | 171500 | 33646.96 | 168316 | -560.96 | -0.0166719 | 3184 | 0.0189168 |
| 01001020900 | Census Tract 209, Autauga County, Alabama | 24841 | 108000 | 32677 | 156900 | 28815.56 | 125280 | 3861.44 | 0.1340054 | 31620 | 0.2523946 |
NMTC Data
svi_divisional_nmtc_df0 <- left_join(svi_divisional_nmtc, census_pull_df, join_by("GEOID_2010_trt" == "GEOID"))

svi_divisional_nmtc_df1 <- left_join(svi_divisional_nmtc_df0, hpi_df_10_20, join_by("GEOID_2010_trt" == "GEOID10")) %>%
                          unite("county_fips", FIPS_st, FIPS_county, sep = "")

svi_divisional_nmtc_df <- left_join(svi_divisional_nmtc_df1, msa_csa_crosswalk, join_by("county_fips" == "county_fips"))

svi_divisional_nmtc_df %>% head(10) %>% kbl() %>% kable_styling() %>% scroll_box(width = "100%")
| GEOID_2010_trt | county_fips | FIPS_tract | state | state_name | county | region_number | region | division_number | division | E_TOTPOP_10 | E_HU_10 | E_HH_10 | E_POV150_10 | ET_POVSTATUS_10 | EP_POV150_10 | EPL_POV150_10 | F_POV150_10 | E_UNEMP_10 | ET_EMPSTATUS_10 | EP_UNEMP_10 | EPL_UNEMP_10 | F_UNEMP_10 | E_HBURD_OWN_10 | ET_HOUSINGCOST_OWN_10 | EP_HBURD_OWN_10 | EPL_HBURD_OWN_10 | F_HBURD_OWN_10 | E_HBURD_RENT_10 | ET_HOUSINGCOST_RENT_10 | EP_HBURD_RENT_10 | EPL_HBURD_RENT_10 | F_HBURD_RENT_10 | E_HBURD_10 | ET_HOUSINGCOST_10 | EP_HBURD_10 | EPL_HBURD_10 | F_HBURD_10 | E_NOHSDP_10 | ET_EDSTATUS_10 | EP_NOHSDP_10 | EPL_NOHSDP_10 | F_NOHSDP_10 | E_UNINSUR_12 | ET_INSURSTATUS_12 | EP_UNINSUR_12 | EPL_UNINSUR_12 | F_UNINSUR_12 | E_AGE65_10 | EP_AGE65_10 | EPL_AGE65_10 | F_AGE65_10 | E_AGE17_10 | EP_AGE17_10 | EPL_AGE17_10 | F_AGE17_10 | E_DISABL_12 | ET_DISABLSTATUS_12 | EP_DISABL_12 | EPL_DISABL_12 | F_DISABL_12 | E_SNGPNT_10 | ET_FAMILIES_10 | EP_SNGPNT_10 | EPL_SNGPNT_10 | F_SNGPNT_10 | E_LIMENG_10 | ET_POPAGE5UP_10 | EP_LIMENG_10 | EPL_LIMENG_10 | F_LIMENG_10 | E_MINRTY_10 | ET_POPETHRACE_10 | EP_MINRTY_10 | EPL_MINRTY_10 | F_MINRTY_10 | E_STRHU_10 | E_MUNIT_10 | EP_MUNIT_10 | EPL_MUNIT_10 | F_MUNIT_10 | E_MOBILE_10 | EP_MOBILE_10 | EPL_MOBILE_10 | F_MOBILE_10 | E_CROWD_10 | ET_OCCUPANTS_10 | EP_CROWD_10 | EPL_CROWD_10 | F_CROWD_10 | E_NOVEH_10 | ET_KNOWNVEH_10 | EP_NOVEH_10 | EPL_NOVEH_10 | F_NOVEH_10 | E_GROUPQ_10 | ET_HHTYPE_10 | EP_GROUPQ_10 | EPL_GROUPQ_10 | F_GROUPQ_10 | SPL_THEME1_10 | RPL_THEME1_10 | F_THEME1_10 | SPL_THEME2_10 | RPL_THEME2_10 | F_THEME2_10 | SPL_THEME3_10 | RPL_THEME3_10 | F_THEME3_10 | SPL_THEME4_10 | RPL_THEME4_10 | F_THEME4_10 | SPL_THEMES_10 | RPL_THEMES_10 | F_TOTAL_10 | E_TOTPOP_20 | E_HU_20 | E_HH_20 | E_POV150_20 | ET_POVSTATUS_20 | EP_POV150_20 | EPL_POV150_20 | F_POV150_20 | E_UNEMP_20 | ET_EMPSTATUS_20 | EP_UNEMP_20 | EPL_UNEMP_20 | F_UNEMP_20 | E_HBURD_OWN_20 | ET_HOUSINGCOST_OWN_20 | EP_HBURD_OWN_20 | EPL_HBURD_OWN_20 | F_HBURD_OWN_20 | E_HBURD_RENT_20 | ET_HOUSINGCOST_RENT_20 | EP_HBURD_RENT_20 | EPL_HBURD_RENT_20 | F_HBURD_RENT_20 | E_HBURD_20 | ET_HOUSINGCOST_20 | EP_HBURD_20 | EPL_HBURD_20 | F_HBURD_20 | E_NOHSDP_20 | ET_EDSTATUS_20 | EP_NOHSDP_20 | EPL_NOHSDP_20 | F_NOHSDP_20 | E_UNINSUR_20 | ET_INSURSTATUS_20 | EP_UNINSUR_20 | EPL_UNINSUR_20 | F_UNINSUR_20 | E_AGE65_20 | EP_AGE65_20 | EPL_AGE65_20 | F_AGE65_20 | E_AGE17_20 | EP_AGE17_20 | EPL_AGE17_20 | F_AGE17_20 | E_DISABL_20 | ET_DISABLSTATUS_20 | EP_DISABL_20 | EPL_DISABL_20 | F_DISABL_20 | E_SNGPNT_20 | ET_FAMILIES_20 | EP_SNGPNT_20 | EPL_SNGPNT_20 | F_SNGPNT_20 | E_LIMENG_20 | ET_POPAGE5UP_20 | EP_LIMENG_20 | EPL_LIMENG_20 | F_LIMENG_20 | E_MINRTY_20 | ET_POPETHRACE_20 | EP_MINRTY_20 | EPL_MINRTY_20 | F_MINRTY_20 | E_STRHU_20 | E_MUNIT_20 | EP_MUNIT_20 | EPL_MUNIT_20 | F_MUNIT_20 | E_MOBILE_20 | EP_MOBILE_20 | EPL_MOBILE_20 | F_MOBILE_20 | E_CROWD_20 | ET_OCCUPANTS_20 | EP_CROWD_20 | EPL_CROWD_20 | F_CROWD_20 | E_NOVEH_20 | ET_KNOWNVEH_20 | EP_NOVEH_20 | EPL_NOVEH_20 | F_NOVEH_20 | E_GROUPQ_20 | ET_HHTYPE_20 | EP_GROUPQ_20 | EPL_GROUPQ_20 | F_GROUPQ_20 | SPL_THEME1_20 | RPL_THEME1_20 | F_THEME1_20 | SPL_THEME2_20 | RPL_THEME2_20 | F_THEME2_20 | SPL_THEME3_20 | RPL_THEME3_20 | F_THEME3_20 | SPL_THEME4_20 | RPL_THEME4_20 | F_THEME4_20 | SPL_THEMES_20 | RPL_THEMES_20 | F_TOTAL_20 | nmtc_eligibility | pre10_nmtc_project_cnt | pre10_nmtc_dollars | pre10_nmtc_dollars_formatted | post10_nmtc_project_cnt | post10_nmtc_dollars | post10_nmtc_dollars_formatted | nmtc_flag | NAME | Median_Income_10 | Median_Home_Value_10 | Median_Income_19 | Median_Home_Value_19 | Median_Income_10adj | Median_Home_Value_10adj | Median_Income_Change | Median_Income_Change_pct | Median_Home_Value_Change | Median_Home_Value_Change_pct | housing_price_index10 | housing_price_index20 | county_title | cbsa | cbsa_code |
|---|---|---|---|---|---|---|---|---|---|---|---|---|---|---|---|---|---|---|---|---|---|---|---|---|---|---|---|---|---|---|---|---|---|---|---|---|---|---|---|---|---|---|---|---|---|---|---|---|---|---|---|---|---|---|---|---|---|---|---|---|---|---|---|---|---|---|---|---|---|---|---|---|---|---|---|---|---|---|---|---|---|---|---|---|---|---|---|---|---|---|---|---|---|---|---|---|---|---|---|---|---|---|---|---|---|---|---|---|---|---|---|---|---|---|---|---|---|---|---|---|---|---|---|---|---|---|---|---|---|---|---|---|---|---|---|---|---|---|---|---|---|---|---|---|---|---|---|---|---|---|---|---|---|---|---|---|---|---|---|---|---|---|---|---|---|---|---|---|---|---|---|---|---|---|---|---|---|---|---|---|---|---|---|---|---|---|---|---|---|---|---|---|---|---|---|---|---|---|---|---|---|---|---|---|---|---|---|---|---|---|---|---|---|---|---|---|---|---|---|---|---|---|---|---|---|---|---|---|---|---|---|---|---|---|---|---|---|---|---|---|---|---|---|
| 19003950200 | 19003 | 950200 | IA | Iowa | Adams County | 2 | Midwest Region | 4 | West North Central Division | 2382 | 1214 | 1074 | 674 | 2324 | 29.00172 | 0.7484 | 0 | 43 | 1148 | 3.745645 | 0.2825 | 0 | 142 | 782 | 18.15857 | 0.2646 | 0 | 107 | 292 | 36.64384 | 0.45600 | 0 | 249 | 1074 | 23.18436 | 0.3296 | 0 | 276 | 1794 | 15.384615 | 0.7587 | 1 | 194 | 2184 | 8.882784 | 0.4311 | 0 | 554 | 23.257767 | 0.9211 | 1 | 442 | 18.55584 | 0.1370 | 0 | 334 | 1742 | 19.17336 | 0.7794 | 1 | 81 | 583 | 13.893653 | 0.56290 | 0 | 0 | 2296 | 0.0000000 | 0.1215 | 0 | 89 | 2382 | 3.736356 | 0.2193 | 0 | 1214 | 32 | 2.6359143 | 0.44560 | 0 | 59 | 4.8599671 | 0.6514 | 0 | 27 | 1074 | 2.5139665 | 0.7799 | 1 | 72 | 1074 | 6.703911 | 0.6702 | 0 | 183 | 2382 | 7.682620 | 0.9039 | 1 | 2.5503 | 0.5413 | 1 | 2.52190 | 0.5177 | 2 | 0.2193 | 0.2184 | 0 | 3.45100 | 0.90270 | 2 | 8.74250 | 0.6273 | 5 | 2017 | 1176 | 923 | 373 | 1939 | 19.23672 | 0.5455 | 0 | 43 | 965 | 4.455959 | 0.6531 | 0 | 115 | 708 | 16.242938 | 0.464400 | 0 | 30 | 215 | 13.95349 | 0.07616 | 0 | 145 | 923 | 15.70964 | 0.1595 | 0 | 123 | 1504 | 8.178192 | 0.5864 | 0 | 64 | 1957 | 3.270312 | 0.23380 | 0 | 492 | 24.392662 | 0.87730 | 1 | 399 | 19.78185 | 0.2529 | 0 | 276 | 1558.000 | 17.715019 | 0.66950 | 0 | 44 | 526.0000 | 8.365019 | 0.2549 | 0 | 5 | 1932 | 0.2587992 | 0.4007 | 0 | 101 | 2017.000 | 5.007437 | 0.15670 | 0 | 1176 | 16 | 1.3605442 | 0.3160 | 0 | 31 | 2.6360544 | 0.5846 | 0 | 8 | 923 | 0.8667389 | 0.41620 | 0 | 60 | 923.0000 | 6.500542 | 0.6597 | 0 | 130 | 2017 | 6.4452157 | 0.9140 | 1 | 2.17830 | 0.4184 | 0 | 2.45530 | 0.4673 | 1 | 0.15670 | 0.15610 | 0 | 2.89050 | 0.6683 | 1 | 7.68080 | 0.4534 | 2 | Yes | 0 | 0 | \$0 | 0 | 0 | \$0 | 0 | Census Tract 9502, Adams County, Iowa | 19847 | 75700 | 30898 | 77200 | 23022.52 | 87812 | 7875.48 | 0.3420772 | -10612 | -0.1208491 | 113.33 | 109.40 | NA | NA | NA |
| 19005960500 | 19005 | 960500 | IA | Iowa | Allamakee County | 2 | Midwest Region | 4 | West North Central Division | 3381 | 1286 | 1199 | 761 | 3381 | 22.50813 | 0.5897 | 0 | 45 | 1699 | 2.648617 | 0.1433 | 0 | 150 | 915 | 16.39344 | 0.1774 | 0 | 141 | 284 | 49.64789 | 0.75450 | 1 | 291 | 1199 | 24.27023 | 0.3840 | 0 | 383 | 2152 | 17.797398 | 0.8235 | 1 | 662 | 3327 | 19.897806 | 0.8851 | 1 | 416 | 12.304052 | 0.4070 | 0 | 1057 | 31.26294 | 0.9039 | 1 | 267 | 2328 | 11.46907 | 0.2881 | 0 | 94 | 916 | 10.262009 | 0.37050 | 0 | 319 | 2923 | 10.9134451 | 0.9675 | 1 | 603 | 3381 | 17.834960 | 0.7106 | 0 | 1286 | 27 | 2.0995334 | 0.40680 | 0 | 29 | 2.2550544 | 0.5319 | 0 | 83 | 1199 | 6.9224354 | 0.9591 | 1 | 74 | 1199 | 6.171810 | 0.6369 | 0 | 0 | 3381 | 0.000000 | 0.3161 | 0 | 2.8256 | 0.6221 | 2 | 2.93700 | 0.7345 | 2 | 0.7106 | 0.7077 | 0 | 2.85080 | 0.66920 | 1 | 9.32400 | 0.7048 | 5 | 3461 | 1279 | 1178 | 775 | 3403 | 22.77402 | 0.6463 | 0 | 46 | 1541 | 2.985075 | 0.4416 | 0 | 76 | 817 | 9.302326 | 0.078740 | 0 | 92 | 361 | 25.48476 | 0.24980 | 0 | 168 | 1178 | 14.26146 | 0.1033 | 0 | 370 | 1997 | 18.527792 | 0.9109 | 1 | 554 | 3412 | 16.236811 | 0.91580 | 1 | 435 | 12.568622 | 0.24880 | 0 | 1231 | 35.56775 | 0.9808 | 1 | 162 | 2181.000 | 7.427785 | 0.06615 | 0 | 112 | 895.0000 | 12.513967 | 0.4746 | 0 | 239 | 3168 | 7.5441919 | 0.9470 | 1 | 1091 | 3461.000 | 31.522681 | 0.79910 | 1 | 1279 | 36 | 2.8146990 | 0.4226 | 0 | 41 | 3.2056294 | 0.6163 | 0 | 62 | 1178 | 5.2631579 | 0.91210 | 1 | 96 | 1178.0000 | 8.149406 | 0.7489 | 0 | 49 | 3461 | 1.4157758 | 0.6208 | 0 | 3.01790 | 0.6696 | 2 | 2.71735 | 0.6274 | 2 | 0.79910 | 0.79620 | 1 | 3.32070 | 0.8478 | 1 | 9.85505 | 0.7714 | 6 | Yes | 0 | 0 | \$0 | 0 | 0 | \$0 | 0 | Census Tract 9605, Allamakee County, Iowa | 23796 | 113700 | 35302 | 116300 | 27603.36 | 131892 | 7698.64 | 0.2789023 | -15592 | -0.1182179 | 119.78 | 133.60 | NA | NA | NA |
| 19007950100 | 19007 | 950100 | IA | Iowa | Appanoose County | 2 | Midwest Region | 4 | West North Central Division | 2776 | 1358 | 1168 | 712 | 2772 | 25.68543 | 0.6800 | 0 | 108 | 1336 | 8.083832 | 0.7380 | 0 | 191 | 941 | 20.29756 | 0.3858 | 0 | 93 | 227 | 40.96916 | 0.56620 | 0 | 284 | 1168 | 24.31507 | 0.3863 | 0 | 181 | 1912 | 9.466527 | 0.4683 | 0 | 245 | 2826 | 8.669498 | 0.4141 | 0 | 540 | 19.452450 | 0.8079 | 1 | 675 | 24.31556 | 0.5162 | 0 | 338 | 2211 | 15.28720 | 0.5533 | 0 | 78 | 809 | 9.641533 | 0.33150 | 0 | 0 | 2570 | 0.0000000 | 0.1215 | 0 | 120 | 2776 | 4.322767 | 0.2617 | 0 | 1358 | 1 | 0.0736377 | 0.19570 | 0 | 145 | 10.6774669 | 0.8254 | 1 | 9 | 1168 | 0.7705479 | 0.4496 | 0 | 58 | 1168 | 4.965753 | 0.5536 | 0 | 0 | 2776 | 0.000000 | 0.3161 | 0 | 2.6867 | 0.5858 | 0 | 2.33040 | 0.4045 | 1 | 0.2617 | 0.2606 | 0 | 2.34040 | 0.40590 | 1 | 7.61920 | 0.4607 | 2 | 2403 | 1209 | 927 | 650 | 2397 | 27.11723 | 0.7483 | 0 | 90 | 1141 | 7.887818 | 0.8871 | 1 | 123 | 683 | 18.008785 | 0.592400 | 0 | 61 | 244 | 25.00000 | 0.24130 | 0 | 184 | 927 | 19.84898 | 0.3689 | 0 | 111 | 1672 | 6.638756 | 0.4740 | 0 | 198 | 2396 | 8.263773 | 0.65480 | 0 | 539 | 22.430295 | 0.80780 | 1 | 556 | 23.13774 | 0.5076 | 0 | 368 | 1841.304 | 19.985831 | 0.78120 | 1 | 41 | 630.3641 | 6.504177 | 0.1539 | 0 | 0 | 2290 | 0.0000000 | 0.1327 | 0 | 72 | 2402.541 | 2.996827 | 0.05070 | 0 | 1209 | 3 | 0.2481390 | 0.2000 | 0 | 95 | 7.8577337 | 0.7914 | 1 | 2 | 927 | 0.2157497 | 0.22670 | 0 | 41 | 926.5641 | 4.424950 | 0.5019 | 0 | 1 | 2403 | 0.0416146 | 0.2867 | 0 | 3.13310 | 0.7005 | 1 | 2.38320 | 0.4254 | 2 | 0.05070 | 0.05052 | 0 | 2.00670 | 0.2648 | 1 | 7.57370 | 0.4380 | 4 | Yes | 0 | 0 | \$0 | 0 | 0 | \$0 | 0 | Census Tract 9501, Appanoose County, Iowa | 19902 | 70800 | 27813 | 102200 | 23086.32 | 82128 | 4726.68 | 0.2047394 | 20072 | 0.2443990 | NA | NA | NA | NA | NA |
| 19007950300 | 19007 | 950300 | IA | Iowa | Appanoose County | 2 | Midwest Region | 4 | West North Central Division | 3199 | 1599 | 1418 | 1150 | 3124 | 36.81178 | 0.8559 | 1 | 275 | 1466 | 18.758527 | 0.9652 | 1 | 205 | 745 | 27.51678 | 0.7281 | 0 | 333 | 673 | 49.47994 | 0.75140 | 1 | 538 | 1418 | 37.94076 | 0.8374 | 1 | 212 | 2171 | 9.765085 | 0.4892 | 0 | 324 | 2810 | 11.530249 | 0.5992 | 0 | 691 | 21.600500 | 0.8824 | 1 | 833 | 26.03939 | 0.6525 | 0 | 460 | 2217 | 20.74876 | 0.8401 | 1 | 112 | 761 | 14.717477 | 0.59220 | 0 | 0 | 2884 | 0.0000000 | 0.1215 | 0 | 164 | 3199 | 5.126602 | 0.3089 | 0 | 1599 | 178 | 11.1319575 | 0.72650 | 0 | 116 | 7.2545341 | 0.7337 | 0 | 57 | 1418 | 4.0197461 | 0.8884 | 1 | 221 | 1418 | 15.585332 | 0.9104 | 1 | 75 | 3199 | 2.344483 | 0.7538 | 1 | 3.7469 | 0.8295 | 3 | 3.08870 | 0.7966 | 2 | 0.3089 | 0.3077 | 0 | 4.01280 | 0.98410 | 3 | 11.15730 | 0.8880 | 8 | 3122 | 1799 | 1405 | 1115 | 3052 | 36.53342 | 0.8801 | 1 | 76 | 1237 | 6.143897 | 0.8057 | 1 | 142 | 795 | 17.861635 | 0.584000 | 0 | 277 | 610 | 45.40984 | 0.71380 | 0 | 419 | 1405 | 29.82206 | 0.7707 | 1 | 284 | 2338 | 12.147134 | 0.7814 | 1 | 187 | 3079 | 6.073400 | 0.50730 | 0 | 789 | 25.272261 | 0.90200 | 1 | 586 | 18.77002 | 0.1960 | 0 | 659 | 2495.696 | 26.405465 | 0.93540 | 1 | 85 | 786.6359 | 10.805508 | 0.3934 | 0 | 0 | 2957 | 0.0000000 | 0.1327 | 0 | 160 | 3122.459 | 5.124166 | 0.16330 | 0 | 1799 | 161 | 8.9494163 | 0.6528 | 0 | 100 | 5.5586437 | 0.7192 | 0 | 24 | 1405 | 1.7081851 | 0.60050 | 0 | 172 | 1405.4359 | 12.238196 | 0.8683 | 1 | 70 | 3122 | 2.2421525 | 0.7311 | 0 | 3.74520 | 0.8420 | 4 | 2.55950 | 0.5311 | 2 | 0.16330 | 0.16270 | 0 | 3.57190 | 0.9203 | 1 | 10.03990 | 0.7934 | 7 | Yes | 0 | 0 | \$0 | 0 | 0 | \$0 | 0 | Census Tract 9503, Appanoose County, Iowa | 16377 | 63300 | 20217 | 69700 | 18997.32 | 73428 | 1219.68 | 0.0642027 | -3728 | -0.0507708 | 105.81 | 130.01 | NA | NA | NA |
| 19009070300 | 19009 | 070300 | IA | Iowa | Audubon County | 2 | Midwest Region | 4 | West North Central Division | 1746 | 879 | 771 | 434 | 1663 | 26.09741 | 0.6868 | 0 | 21 | 791 | 2.654867 | 0.1445 | 0 | 129 | 629 | 20.50874 | 0.3979 | 0 | 23 | 142 | 16.19718 | 0.08948 | 0 | 152 | 771 | 19.71466 | 0.1759 | 0 | 206 | 1298 | 15.870570 | 0.7742 | 1 | 228 | 1631 | 13.979154 | 0.7148 | 0 | 496 | 28.407789 | 0.9812 | 1 | 327 | 18.72852 | 0.1440 | 0 | 243 | 1334 | 18.21589 | 0.7345 | 0 | 12 | 502 | 2.390438 | 0.02169 | 0 | 6 | 1666 | 0.3601441 | 0.4190 | 0 | 49 | 1746 | 2.806415 | 0.1459 | 0 | 879 | 6 | 0.6825939 | 0.27980 | 0 | 8 | 0.9101251 | 0.4325 | 0 | 0 | 771 | 0.0000000 | 0.1372 | 0 | 60 | 771 | 7.782101 | 0.7244 | 0 | 79 | 1746 | 4.524628 | 0.8415 | 1 | 2.4962 | 0.5254 | 1 | 2.30039 | 0.3869 | 1 | 0.1459 | 0.1453 | 0 | 2.41540 | 0.44410 | 1 | 7.35789 | 0.4210 | 3 | 1699 | 831 | 775 | 350 | 1638 | 21.36752 | 0.6109 | 0 | 14 | 850 | 1.647059 | 0.1920 | 0 | 89 | 646 | 13.777090 | 0.304100 | 0 | 29 | 129 | 22.48062 | 0.19170 | 0 | 118 | 775 | 15.22581 | 0.1388 | 0 | 98 | 1250 | 7.840000 | 0.5648 | 0 | 57 | 1650 | 3.454546 | 0.25530 | 0 | 410 | 24.131842 | 0.86800 | 1 | 374 | 22.01295 | 0.4174 | 0 | 177 | 1276.000 | 13.871473 | 0.41630 | 0 | 47 | 474.0000 | 9.915612 | 0.3430 | 0 | 0 | 1536 | 0.0000000 | 0.1327 | 0 | 30 | 1699.000 | 1.765745 | 0.01595 | 0 | 831 | 5 | 0.6016847 | 0.2454 | 0 | 8 | 0.9626955 | 0.4577 | 0 | 7 | 775 | 0.9032258 | 0.42690 | 0 | 22 | 775.0000 | 2.838710 | 0.3478 | 0 | 49 | 1699 | 2.8840494 | 0.7833 | 1 | 1.76180 | 0.2850 | 0 | 2.17740 | 0.3132 | 1 | 0.01595 | 0.01589 | 0 | 2.26110 | 0.3720 | 1 | 6.21625 | 0.2314 | 2 | Yes | 0 | 0 | \$0 | 0 | 0 | \$0 | 0 | Census Tract 703, Audubon County, Iowa | 20712 | 72100 | 29214 | 69900 | 24025.92 | 83636 | 5188.08 | 0.2159368 | -13736 | -0.1642355 | NA | NA | NA | NA | NA |
| 19011960300 | 19011 | 960300 | IA | Iowa | Benton County | 2 | Midwest Region | 4 | West North Central Division | 5438 | 2510 | 2241 | 1046 | 5304 | 19.72097 | 0.5037 | 0 | 210 | 2471 | 8.498584 | 0.7671 | 1 | 354 | 1547 | 22.88300 | 0.5244 | 0 | 230 | 694 | 33.14121 | 0.37500 | 0 | 584 | 2241 | 26.05979 | 0.4688 | 0 | 234 | 3663 | 6.388206 | 0.2765 | 0 | 381 | 5307 | 7.179197 | 0.3060 | 0 | 984 | 18.094888 | 0.7456 | 0 | 1374 | 25.26664 | 0.5858 | 0 | 864 | 3914 | 22.07460 | 0.8760 | 1 | 311 | 1569 | 19.821542 | 0.74650 | 0 | 52 | 5065 | 1.0266535 | 0.6568 | 0 | 335 | 5438 | 6.160353 | 0.3608 | 0 | 2510 | 63 | 2.5099602 | 0.43720 | 0 | 114 | 4.5418327 | 0.6392 | 0 | 32 | 2241 | 1.4279340 | 0.6175 | 0 | 109 | 2241 | 4.863900 | 0.5464 | 0 | 134 | 5438 | 2.464141 | 0.7593 | 1 | 2.3221 | 0.4725 | 1 | 3.61070 | 0.9427 | 1 | 0.3608 | 0.3593 | 0 | 2.99960 | 0.73360 | 1 | 9.29320 | 0.6995 | 3 | 5250 | 2525 | 2252 | 1029 | 5039 | 20.42072 | 0.5801 | 0 | 35 | 2481 | 1.410721 | 0.1483 | 0 | 445 | 1668 | 26.678657 | 0.918200 | 1 | 158 | 583 | 27.10120 | 0.28200 | 0 | 603 | 2251 | 26.78809 | 0.6840 | 0 | 318 | 3591 | 8.855472 | 0.6297 | 0 | 79 | 5103 | 1.548109 | 0.06672 | 0 | 1236 | 23.542857 | 0.84750 | 1 | 1184 | 22.55238 | 0.4596 | 0 | 806 | 3920.615 | 20.557999 | 0.80460 | 1 | 291 | 1387.9781 | 20.965749 | 0.7594 | 1 | 12 | 5078 | 0.2363135 | 0.3880 | 0 | 319 | 5250.100 | 6.076075 | 0.21120 | 0 | 2525 | 85 | 3.3663366 | 0.4532 | 0 | 0 | 0.0000000 | 0.1738 | 0 | 0 | 2252 | 0.0000000 | 0.09916 | 0 | 132 | 2251.6373 | 5.862401 | 0.6165 | 0 | 244 | 5250 | 4.6476190 | 0.8783 | 1 | 2.10882 | 0.3955 | 0 | 3.25910 | 0.8640 | 3 | 0.21120 | 0.21040 | 0 | 2.22096 | 0.3527 | 1 | 7.80008 | 0.4732 | 4 | Yes | 0 | 0 | \$0 | 0 | 0 | \$0 | 0 | Census Tract 9603, Benton County, Iowa | 24117 | 105600 | 26911 | 138900 | 27975.72 | 122496 | -1064.72 | -0.0380587 | 16404 | 0.1339146 | 195.52 | 231.04 | Benton County, Iowa | Cedar Rapids, IA MSA | C1630 |
| 19011960700 | 19011 | 960700 | IA | Iowa | Benton County | 2 | Midwest Region | 4 | West North Central Division | 2741 | 1340 | 1267 | 662 | 2695 | 24.56401 | 0.6494 | 0 | 68 | 1282 | 5.304212 | 0.4819 | 0 | 200 | 847 | 23.61275 | 0.5620 | 0 | 132 | 420 | 31.42857 | 0.34020 | 0 | 332 | 1267 | 26.20363 | 0.4751 | 0 | 310 | 1904 | 16.281513 | 0.7862 | 1 | 323 | 2600 | 12.423077 | 0.6484 | 0 | 512 | 18.679314 | 0.7750 | 1 | 666 | 24.29770 | 0.5151 | 0 | 467 | 1996 | 23.39679 | 0.9051 | 1 | 98 | 697 | 14.060258 | 0.57030 | 0 | 34 | 2635 | 1.2903226 | 0.7095 | 0 | 103 | 2741 | 3.757753 | 0.2208 | 0 | 1340 | 32 | 2.3880597 | 0.42830 | 0 | 19 | 1.4179104 | 0.4793 | 0 | 0 | 1267 | 0.0000000 | 0.1372 | 0 | 99 | 1267 | 7.813733 | 0.7254 | 0 | 0 | 2741 | 0.000000 | 0.3161 | 0 | 3.0410 | 0.6787 | 1 | 3.47500 | 0.9175 | 2 | 0.2208 | 0.2199 | 0 | 2.08630 | 0.28970 | 0 | 8.82310 | 0.6382 | 3 | 2608 | 1301 | 1148 | 643 | 2549 | 25.22558 | 0.7120 | 0 | 39 | 1456 | 2.678571 | 0.3852 | 0 | 140 | 922 | 15.184382 | 0.396900 | 0 | 91 | 226 | 40.26549 | 0.59980 | 0 | 231 | 1148 | 20.12195 | 0.3811 | 0 | 171 | 1928 | 8.869295 | 0.6303 | 0 | 106 | 2561 | 4.139008 | 0.32710 | 0 | 566 | 21.702454 | 0.77170 | 1 | 501 | 19.21012 | 0.2190 | 0 | 268 | 2060.000 | 13.009709 | 0.35430 | 0 | 128 | 735.0000 | 17.414966 | 0.6650 | 0 | 0 | 2450 | 0.0000000 | 0.1327 | 0 | 125 | 2608.000 | 4.792945 | 0.14300 | 0 | 1301 | 41 | 3.1514220 | 0.4437 | 0 | 32 | 2.4596464 | 0.5734 | 0 | 8 | 1148 | 0.6968641 | 0.36600 | 0 | 69 | 1148.0000 | 6.010453 | 0.6266 | 0 | 47 | 2608 | 1.8021472 | 0.6781 | 0 | 2.43570 | 0.5041 | 0 | 2.14270 | 0.2969 | 1 | 0.14300 | 0.14250 | 0 | 2.68780 | 0.5729 | 0 | 7.40920 | 0.4129 | 1 | Yes | 0 | 0 | \$0 | 0 | 0 | \$0 | 0 | Census Tract 9607, Benton County, Iowa | 22139 | 84100 | 29909 | 86200 | 25681.24 | 97556 | 4227.76 | 0.1646244 | -11356 | -0.1164049 | 108.74 | 130.72 | Benton County, Iowa | Cedar Rapids, IA MSA | C1630 |
| 19013000200 | 19013 | 000200 | IA | Iowa | Black Hawk County | 2 | Midwest Region | 4 | West North Central Division | 2874 | 1294 | 1037 | 1181 | 2874 | 41.09255 | 0.8912 | 1 | 87 | 1324 | 6.570997 | 0.6200 | 0 | 81 | 451 | 17.96009 | 0.2549 | 0 | 369 | 586 | 62.96928 | 0.92450 | 1 | 450 | 1037 | 43.39441 | 0.9097 | 1 | 338 | 1603 | 21.085465 | 0.8833 | 1 | 408 | 2762 | 14.771904 | 0.7454 | 0 | 181 | 6.297843 | 0.1024 | 0 | 931 | 32.39388 | 0.9280 | 1 | 235 | 1966 | 11.95320 | 0.3165 | 0 | 226 | 701 | 32.239658 | 0.91000 | 1 | 149 | 2522 | 5.9080095 | 0.9244 | 1 | 828 | 2874 | 28.810021 | 0.8332 | 1 | 1294 | 63 | 4.8686244 | 0.56180 | 0 | 15 | 1.1591963 | 0.4545 | 0 | 98 | 1037 | 9.4503375 | 0.9779 | 1 | 94 | 1037 | 9.064609 | 0.7762 | 1 | 0 | 2874 | 0.000000 | 0.3161 | 0 | 4.0496 | 0.8827 | 3 | 3.18130 | 0.8333 | 3 | 0.8332 | 0.8297 | 1 | 3.08650 | 0.77180 | 2 | 11.15060 | 0.8878 | 9 | 2833 | 1243 | 1057 | 958 | 2772 | 34.55988 | 0.8586 | 1 | 203 | 1513 | 13.417052 | 0.9757 | 1 | 17 | 334 | 5.089820 | 0.009533 | 0 | 230 | 723 | 31.81189 | 0.39200 | 0 | 247 | 1057 | 23.36802 | 0.5533 | 0 | 314 | 1493 | 21.031480 | 0.9364 | 1 | 314 | 2833 | 11.083657 | 0.78390 | 1 | 129 | 4.553477 | 0.02013 | 0 | 903 | 31.87434 | 0.9406 | 1 | 360 | 1930.000 | 18.652850 | 0.71890 | 0 | 181 | 609.0000 | 29.720854 | 0.8944 | 1 | 330 | 2613 | 12.6291619 | 0.9782 | 1 | 1679 | 2833.000 | 59.265796 | 0.92480 | 1 | 1243 | 145 | 11.6653258 | 0.7129 | 0 | 3 | 0.2413516 | 0.3601 | 0 | 45 | 1057 | 4.2573321 | 0.87560 | 1 | 143 | 1057.0000 | 13.528855 | 0.8890 | 1 | 0 | 2833 | 0.0000000 | 0.1414 | 0 | 4.10790 | 0.9041 | 4 | 3.55223 | 0.9381 | 3 | 0.92480 | 0.92150 | 1 | 2.97900 | 0.7065 | 2 | 11.56393 | 0.9330 | 10 | Yes | 0 | 0 | \$0 | 0 | 0 | \$0 | 0 | Census Tract 2, Black Hawk County, Iowa | 16659 | 77400 | 22277 | 82900 | 19324.44 | 89784 | 2952.56 | 0.1527889 | -6884 | -0.0766729 | NA | 126.91 | Black Hawk County, Iowa | Waterloo-Cedar Falls, IA MSA | C4794 |
| 19013000300 | 19013 | 000300 | IA | Iowa | Black Hawk County | 2 | Midwest Region | 4 | West North Central Division | 2948 | 1583 | 1188 | 1355 | 2930 | 46.24573 | 0.9249 | 1 | 171 | 1263 | 13.539192 | 0.9202 | 1 | 134 | 392 | 34.18367 | 0.8977 | 1 | 526 | 796 | 66.08040 | 0.94740 | 1 | 660 | 1188 | 55.55556 | 0.9828 | 1 | 193 | 1634 | 11.811506 | 0.6034 | 0 | 487 | 2747 | 17.728431 | 0.8389 | 1 | 250 | 8.480326 | 0.1993 | 0 | 1005 | 34.09091 | 0.9540 | 1 | 760 | 1945 | 39.07455 | 0.9975 | 1 | 296 | 757 | 39.101717 | 0.94940 | 1 | 70 | 2543 | 2.7526543 | 0.8379 | 1 | 1044 | 2948 | 35.413840 | 0.8685 | 1 | 1583 | 198 | 12.5078964 | 0.75140 | 1 | 11 | 0.6948831 | 0.4045 | 0 | 16 | 1188 | 1.3468013 | 0.6023 | 0 | 205 | 1188 | 17.255892 | 0.9247 | 1 | 0 | 2948 | 0.000000 | 0.3161 | 0 | 4.2702 | 0.9156 | 4 | 3.93810 | 0.9830 | 4 | 0.8685 | 0.8649 | 1 | 2.99900 | 0.73320 | 2 | 12.07580 | 0.9531 | 11 | 3125 | 1623 | 1251 | 1544 | 3117 | 49.53481 | 0.9578 | 1 | 188 | 1388 | 13.544669 | 0.9764 | 1 | 53 | 312 | 16.987179 | 0.520600 | 0 | 647 | 939 | 68.90309 | 0.97910 | 1 | 700 | 1251 | 55.95524 | 0.9918 | 1 | 446 | 1876 | 23.773987 | 0.9582 | 1 | 274 | 3125 | 8.768000 | 0.68030 | 0 | 359 | 11.488000 | 0.20110 | 0 | 932 | 29.82400 | 0.8967 | 1 | 667 | 2193.000 | 30.414957 | 0.97450 | 1 | 284 | 682.0000 | 41.642229 | 0.9673 | 1 | 187 | 2691 | 6.9490896 | 0.9389 | 1 | 1763 | 3125.000 | 56.416000 | 0.91400 | 1 | 1623 | 315 | 19.4085028 | 0.8203 | 1 | 0 | 0.0000000 | 0.1738 | 0 | 88 | 1251 | 7.0343725 | 0.94680 | 1 | 313 | 1251.0000 | 25.019984 | 0.9713 | 1 | 39 | 3125 | 1.2480000 | 0.5930 | 0 | 4.56450 | 0.9675 | 4 | 3.97850 | 0.9890 | 4 | 0.91400 | 0.91070 | 1 | 3.50520 | 0.9056 | 3 | 12.96220 | 0.9871 | 12 | Yes | 0 | 0 | \$0 | 0 | 0 | \$0 | 0 | Census Tract 3, Black Hawk County, Iowa | 16462 | 76300 | 20954 | 74900 | 19095.92 | 88508 | 1858.08 | 0.0973025 | -13608 | -0.1537488 | NA | NA | Black Hawk County, Iowa | Waterloo-Cedar Falls, IA MSA | C4794 |
| 19013000500 | 19013 | 000500 | IA | Iowa | Black Hawk County | 2 | Midwest Region | 4 | West North Central Division | 1918 | 653 | 653 | 349 | 1900 | 18.36842 | 0.4573 | 0 | 151 | 1240 | 12.177419 | 0.8947 | 1 | 128 | 492 | 26.01626 | 0.6722 | 0 | 93 | 161 | 57.76398 | 0.87590 | 1 | 221 | 653 | 33.84380 | 0.7474 | 0 | 292 | 1157 | 25.237684 | 0.9306 | 1 | 347 | 1809 | 19.181868 | 0.8703 | 1 | 134 | 6.986444 | 0.1315 | 0 | 466 | 24.29614 | 0.5143 | 0 | 252 | 1357 | 18.57038 | 0.7539 | 1 | 186 | 468 | 39.743590 | 0.95240 | 1 | 102 | 1832 | 5.5676856 | 0.9196 | 1 | 733 | 1918 | 38.216893 | 0.8788 | 1 | 653 | 0 | 0.0000000 | 0.09728 | 0 | 0 | 0.0000000 | 0.1716 | 0 | 0 | 653 | 0.0000000 | 0.1372 | 0 | 53 | 653 | 8.116386 | 0.7427 | 0 | 0 | 1918 | 0.000000 | 0.3161 | 0 | 3.9003 | 0.8577 | 3 | 3.27170 | 0.8649 | 3 | 0.8788 | 0.8751 | 1 | 1.46488 | 0.07947 | 0 | 9.51568 | 0.7256 | 7 | 1742 | 688 | 625 | 585 | 1678 | 34.86293 | 0.8624 | 1 | 117 | 906 | 12.913907 | 0.9730 | 1 | 67 | 328 | 20.426829 | 0.734200 | 0 | 136 | 297 | 45.79125 | 0.72160 | 0 | 203 | 625 | 32.48000 | 0.8277 | 1 | 192 | 959 | 20.020855 | 0.9280 | 1 | 132 | 1742 | 7.577497 | 0.61210 | 0 | 149 | 8.553387 | 0.09628 | 0 | 505 | 28.98967 | 0.8739 | 1 | 254 | 1237.000 | 20.533549 | 0.80360 | 1 | 122 | 357.0000 | 34.173670 | 0.9306 | 1 | 0 | 1621 | 0.0000000 | 0.1327 | 0 | 829 | 1742.000 | 47.588978 | 0.88740 | 1 | 688 | 0 | 0.0000000 | 0.0847 | 0 | 0 | 0.0000000 | 0.1738 | 0 | 9 | 625 | 1.4400000 | 0.55030 | 0 | 64 | 625.0000 | 10.240000 | 0.8245 | 1 | 0 | 1742 | 0.0000000 | 0.1414 | 0 | 4.20320 | 0.9184 | 4 | 2.83708 | 0.6861 | 3 | 0.88740 | 0.88420 | 1 | 1.77470 | 0.1856 | 1 | 9.70238 | 0.7535 | 9 | Yes | 0 | 0 | \$0 | 0 | 0 | \$0 | 0 | Census Tract 5, Black Hawk County, Iowa | 21996 | 67000 | 21578 | 64700 | 25515.36 | 77720 | -3937.36 | -0.1543133 | -13020 | -0.1675244 | NA | NA | Black Hawk County, Iowa | Waterloo-Cedar Falls, IA MSA | C4794 |
svi_national_nmtc_df0 <- left_join(svi_national_nmtc, census_pull_df, join_by("GEOID_2010_trt" == "GEOID"))

svi_national_nmtc_df1 <- left_join(svi_national_nmtc_df0, hpi_df_10_20, join_by("GEOID_2010_trt" == "GEOID10")) %>%
                          unite("county_fips", FIPS_st, FIPS_county, sep = "")

svi_national_nmtc_df <- left_join(svi_national_nmtc_df1, msa_csa_crosswalk, join_by("county_fips" == "county_fips"))

svi_national_nmtc_df %>% head(10) %>% kbl() %>% kable_styling() %>% scroll_box(width = "100%")
| GEOID_2010_trt | county_fips | FIPS_tract | state | state_name | county | region_number | region | division_number | division | E_TOTPOP_10 | E_HU_10 | E_HH_10 | E_POV150_10 | ET_POVSTATUS_10 | EP_POV150_10 | EPL_POV150_10 | F_POV150_10 | E_UNEMP_10 | ET_EMPSTATUS_10 | EP_UNEMP_10 | EPL_UNEMP_10 | F_UNEMP_10 | E_HBURD_OWN_10 | ET_HOUSINGCOST_OWN_10 | EP_HBURD_OWN_10 | EPL_HBURD_OWN_10 | F_HBURD_OWN_10 | E_HBURD_RENT_10 | ET_HOUSINGCOST_RENT_10 | EP_HBURD_RENT_10 | EPL_HBURD_RENT_10 | F_HBURD_RENT_10 | E_HBURD_10 | ET_HOUSINGCOST_10 | EP_HBURD_10 | EPL_HBURD_10 | F_HBURD_10 | E_NOHSDP_10 | ET_EDSTATUS_10 | EP_NOHSDP_10 | EPL_NOHSDP_10 | F_NOHSDP_10 | E_UNINSUR_12 | ET_INSURSTATUS_12 | EP_UNINSUR_12 | EPL_UNINSUR_12 | F_UNINSUR_12 | E_AGE65_10 | EP_AGE65_10 | EPL_AGE65_10 | F_AGE65_10 | E_AGE17_10 | EP_AGE17_10 | EPL_AGE17_10 | F_AGE17_10 | E_DISABL_12 | ET_DISABLSTATUS_12 | EP_DISABL_12 | EPL_DISABL_12 | F_DISABL_12 | E_SNGPNT_10 | ET_FAMILIES_10 | EP_SNGPNT_10 | EPL_SNGPNT_10 | F_SNGPNT_10 | E_LIMENG_10 | ET_POPAGE5UP_10 | EP_LIMENG_10 | EPL_LIMENG_10 | F_LIMENG_10 | E_MINRTY_10 | ET_POPETHRACE_10 | EP_MINRTY_10 | EPL_MINRTY_10 | F_MINRTY_10 | E_STRHU_10 | E_MUNIT_10 | EP_MUNIT_10 | EPL_MUNIT_10 | F_MUNIT_10 | E_MOBILE_10 | EP_MOBILE_10 | EPL_MOBILE_10 | F_MOBILE_10 | E_CROWD_10 | ET_OCCUPANTS_10 | EP_CROWD_10 | EPL_CROWD_10 | F_CROWD_10 | E_NOVEH_10 | ET_KNOWNVEH_10 | EP_NOVEH_10 | EPL_NOVEH_10 | F_NOVEH_10 | E_GROUPQ_10 | ET_HHTYPE_10 | EP_GROUPQ_10 | EPL_GROUPQ_10 | F_GROUPQ_10 | SPL_THEME1_10 | RPL_THEME1_10 | F_THEME1_10 | SPL_THEME2_10 | RPL_THEME2_10 | F_THEME2_10 | SPL_THEME3_10 | RPL_THEME3_10 | F_THEME3_10 | SPL_THEME4_10 | RPL_THEME4_10 | F_THEME4_10 | SPL_THEMES_10 | RPL_THEMES_10 | F_TOTAL_10 | E_TOTPOP_20 | E_HU_20 | E_HH_20 | E_POV150_20 | ET_POVSTATUS_20 | EP_POV150_20 | EPL_POV150_20 | F_POV150_20 | E_UNEMP_20 | ET_EMPSTATUS_20 | EP_UNEMP_20 | EPL_UNEMP_20 | F_UNEMP_20 | E_HBURD_OWN_20 | ET_HOUSINGCOST_OWN_20 | EP_HBURD_OWN_20 | EPL_HBURD_OWN_20 | F_HBURD_OWN_20 | E_HBURD_RENT_20 | ET_HOUSINGCOST_RENT_20 | EP_HBURD_RENT_20 | EPL_HBURD_RENT_20 | F_HBURD_RENT_20 | E_HBURD_20 | ET_HOUSINGCOST_20 | EP_HBURD_20 | EPL_HBURD_20 | F_HBURD_20 | E_NOHSDP_20 | ET_EDSTATUS_20 | EP_NOHSDP_20 | EPL_NOHSDP_20 | F_NOHSDP_20 | E_UNINSUR_20 | ET_INSURSTATUS_20 | EP_UNINSUR_20 | EPL_UNINSUR_20 | F_UNINSUR_20 | E_AGE65_20 | EP_AGE65_20 | EPL_AGE65_20 | F_AGE65_20 | E_AGE17_20 | EP_AGE17_20 | EPL_AGE17_20 | F_AGE17_20 | E_DISABL_20 | ET_DISABLSTATUS_20 | EP_DISABL_20 | EPL_DISABL_20 | F_DISABL_20 | E_SNGPNT_20 | ET_FAMILIES_20 | EP_SNGPNT_20 | EPL_SNGPNT_20 | F_SNGPNT_20 | E_LIMENG_20 | ET_POPAGE5UP_20 | EP_LIMENG_20 | EPL_LIMENG_20 | F_LIMENG_20 | E_MINRTY_20 | ET_POPETHRACE_20 | EP_MINRTY_20 | EPL_MINRTY_20 | F_MINRTY_20 | E_STRHU_20 | E_MUNIT_20 | EP_MUNIT_20 | EPL_MUNIT_20 | F_MUNIT_20 | E_MOBILE_20 | EP_MOBILE_20 | EPL_MOBILE_20 | F_MOBILE_20 | E_CROWD_20 | ET_OCCUPANTS_20 | EP_CROWD_20 | EPL_CROWD_20 | F_CROWD_20 | E_NOVEH_20 | ET_KNOWNVEH_20 | EP_NOVEH_20 | EPL_NOVEH_20 | F_NOVEH_20 | E_GROUPQ_20 | ET_HHTYPE_20 | EP_GROUPQ_20 | EPL_GROUPQ_20 | F_GROUPQ_20 | SPL_THEME1_20 | RPL_THEME1_20 | F_THEME1_20 | SPL_THEME2_20 | RPL_THEME2_20 | F_THEME2_20 | SPL_THEME3_20 | RPL_THEME3_20 | F_THEME3_20 | SPL_THEME4_20 | RPL_THEME4_20 | F_THEME4_20 | SPL_THEMES_20 | RPL_THEMES_20 | F_TOTAL_20 | nmtc_eligibility | pre10_nmtc_project_cnt | pre10_nmtc_dollars | pre10_nmtc_dollars_formatted | post10_nmtc_project_cnt | post10_nmtc_dollars | post10_nmtc_dollars_formatted | nmtc_flag | NAME | Median_Income_10 | Median_Home_Value_10 | Median_Income_19 | Median_Home_Value_19 | Median_Income_10adj | Median_Home_Value_10adj | Median_Income_Change | Median_Income_Change_pct | Median_Home_Value_Change | Median_Home_Value_Change_pct | housing_price_index10 | housing_price_index20 | county_title | cbsa | cbsa_code |
|---|---|---|---|---|---|---|---|---|---|---|---|---|---|---|---|---|---|---|---|---|---|---|---|---|---|---|---|---|---|---|---|---|---|---|---|---|---|---|---|---|---|---|---|---|---|---|---|---|---|---|---|---|---|---|---|---|---|---|---|---|---|---|---|---|---|---|---|---|---|---|---|---|---|---|---|---|---|---|---|---|---|---|---|---|---|---|---|---|---|---|---|---|---|---|---|---|---|---|---|---|---|---|---|---|---|---|---|---|---|---|---|---|---|---|---|---|---|---|---|---|---|---|---|---|---|---|---|---|---|---|---|---|---|---|---|---|---|---|---|---|---|---|---|---|---|---|---|---|---|---|---|---|---|---|---|---|---|---|---|---|---|---|---|---|---|---|---|---|---|---|---|---|---|---|---|---|---|---|---|---|---|---|---|---|---|---|---|---|---|---|---|---|---|---|---|---|---|---|---|---|---|---|---|---|---|---|---|---|---|---|---|---|---|---|---|---|---|---|---|---|---|---|---|---|---|---|---|---|---|---|---|---|---|---|---|---|---|---|---|---|---|---|---|
| 01001020200 | 01001 | 020200 | AL | Alabama | Autauga County | 3 | South Region | 6 | East South Central Division | 2020 | 816 | 730 | 495 | 1992 | 24.84940 | 0.5954 | 0 | 68 | 834 | 8.153477 | 0.57540 | 0 | 49 | 439 | 11.16173 | 0.02067 | 0 | 105 | 291 | 36.08247 | 0.30190 | 0 | 154 | 730 | 21.09589 | 0.09312 | 0 | 339 | 1265 | 26.798419 | 0.8392 | 1 | 313 | 2012 | 15.55666 | 0.6000 | 0 | 204 | 10.09901 | 0.3419 | 0 | 597 | 29.55446 | 0.8192 | 1 | 359 | 1515 | 23.69637 | 0.8791 | 1 | 132 | 456 | 28.947368 | 0.8351 | 1 | 15 | 1890 | 0.7936508 | 0.40130 | 0 | 1243 | 2020 | 61.534653 | 0.77810 | 1 | 816 | 0 | 0.0000000 | 0.1224 | 0 | 34 | 4.1666667 | 0.6664 | 0 | 13 | 730 | 1.780822 | 0.5406 | 0 | 115 | 730 | 15.7534247 | 0.83820 | 1 | 0 | 2020 | 0.0000 | 0.3640 | 0 | 2.70312 | 0.5665 | 1 | 3.27660 | 0.8614 | 3 | 0.77810 | 0.7709 | 1 | 2.53160 | 0.5047 | 1 | 9.28942 | 0.6832 | 6 | 1757 | 720 | 573 | 384 | 1511 | 25.413633 | 0.6427 | 0 | 29 | 717 | 4.044630 | 0.41320 | 0 | 33 | 392 | 8.418367 | 0.03542 | 0 | 116 | 181 | 64.08840 | 0.9086 | 1 | 149 | 573 | 26.00349 | 0.40410 | 0 | 139 | 1313 | 10.586443 | 0.5601 | 0 | 91 | 1533 | 5.936073 | 0.4343 | 0 | 284 | 16.163916 | 0.5169 | 0 | 325 | 18.49744 | 0.28510 | 0 | 164 | 1208.000 | 13.576159 | 0.4127 | 0 | 42 | 359.0000 | 11.6991643 | 0.39980 | 0 | 0 | 1651 | 0.0000000 | 0.09479 | 0 | 1116 | 1757.000 | 63.5173591 | 0.759100 | 1 | 720 | 3 | 0.4166667 | 0.2470 | 0 | 5 | 0.6944444 | 0.5106 | 0 | 9 | 573 | 1.5706806 | 0.46880 | 0 | 57 | 573.000 | 9.947644 | 0.7317 | 0 | 212 | 1757 | 12.0660216 | 0.9549 | 1 | 2.45440 | 0.4888 | 0 | 1.70929 | 0.10250 | 0 | 0.759100 | 0.752700 | 1 | 2.91300 | 0.6862 | 1 | 7.835790 | 0.4802 | 2 | Yes | 0 | 0 | \$0 | 0 | 0 | \$0 | 0 | Census Tract 202, Autauga County, Alabama | 19437 | 138500 | 20154 | 90500 | 22546.92 | 160660 | -2392.92 | -0.1061307 | -70160 | -0.4366986 | 123.78 | 123.37 | Autauga County, Alabama | Montgomery-Alexander City, AL CSA | CS388 |
| 01001020700 | 01001 | 020700 | AL | Alabama | Autauga County | 3 | South Region | 6 | East South Central Division | 2664 | 1254 | 1139 | 710 | 2664 | 26.65165 | 0.6328 | 0 | 29 | 1310 | 2.213741 | 0.05255 | 0 | 134 | 710 | 18.87324 | 0.13890 | 0 | 187 | 429 | 43.58974 | 0.47090 | 0 | 321 | 1139 | 28.18262 | 0.28130 | 0 | 396 | 1852 | 21.382289 | 0.7478 | 0 | 345 | 2878 | 11.98749 | 0.4459 | 0 | 389 | 14.60210 | 0.6417 | 0 | 599 | 22.48499 | 0.4007 | 0 | 510 | 2168 | 23.52399 | 0.8752 | 1 | 228 | 712 | 32.022472 | 0.8712 | 1 | 0 | 2480 | 0.0000000 | 0.09298 | 0 | 694 | 2664 | 26.051051 | 0.51380 | 0 | 1254 | 8 | 0.6379585 | 0.2931 | 0 | 460 | 36.6826156 | 0.9714 | 1 | 0 | 1139 | 0.000000 | 0.1238 | 0 | 125 | 1139 | 10.9745391 | 0.74770 | 0 | 0 | 2664 | 0.0000 | 0.3640 | 0 | 2.16035 | 0.4069 | 0 | 2.88178 | 0.6997 | 2 | 0.51380 | 0.5090 | 0 | 2.50000 | 0.4882 | 1 | 8.05593 | 0.5185 | 3 | 3562 | 1313 | 1248 | 1370 | 3528 | 38.832200 | 0.8512 | 1 | 128 | 1562 | 8.194622 | 0.79350 | 1 | 168 | 844 | 19.905213 | 0.44510 | 0 | 237 | 404 | 58.66337 | 0.8359 | 1 | 405 | 1248 | 32.45192 | 0.60420 | 0 | 396 | 2211 | 17.910448 | 0.7857 | 1 | 444 | 3547 | 12.517620 | 0.7758 | 1 | 355 | 9.966311 | 0.1800 | 0 | 954 | 26.78271 | 0.79230 | 1 | 629 | 2593.000 | 24.257617 | 0.8730 | 1 | 171 | 797.0000 | 21.4554580 | 0.71860 | 0 | 0 | 3211 | 0.0000000 | 0.09479 | 0 | 1009 | 3562.000 | 28.3267827 | 0.466800 | 0 | 1313 | 14 | 1.0662605 | 0.3165 | 0 | 443 | 33.7395278 | 0.9663 | 1 | 73 | 1248 | 5.8493590 | 0.82110 | 1 | 17 | 1248.000 | 1.362180 | 0.1554 | 0 | 112 | 3562 | 3.1443010 | 0.8514 | 1 | 3.81040 | 0.8569 | 4 | 2.65869 | 0.58470 | 2 | 0.466800 | 0.462900 | 0 | 3.11070 | 0.7714 | 3 | 10.046590 | 0.7851 | 9 | Yes | 0 | 0 | \$0 | 0 | 0 | \$0 | 0 | Census Tract 207, Autauga County, Alabama | 22114 | 93800 | 20934 | 82400 | 25652.24 | 108808 | -4718.24 | -0.1839309 | -26408 | -0.2427027 | 95.94 | 108.47 | Autauga County, Alabama | Montgomery-Alexander City, AL CSA | CS388 |
| 01001021100 | 01001 | 021100 | AL | Alabama | Autauga County | 3 | South Region | 6 | East South Central Division | 3298 | 1502 | 1323 | 860 | 3298 | 26.07641 | 0.6211 | 0 | 297 | 1605 | 18.504673 | 0.94340 | 1 | 250 | 1016 | 24.60630 | 0.32070 | 0 | 74 | 307 | 24.10423 | 0.11920 | 0 | 324 | 1323 | 24.48980 | 0.17380 | 0 | 710 | 2231 | 31.824294 | 0.8976 | 1 | 654 | 3565 | 18.34502 | 0.7018 | 0 | 411 | 12.46210 | 0.5001 | 0 | 738 | 22.37720 | 0.3934 | 0 | 936 | 2861 | 32.71583 | 0.9807 | 1 | 138 | 825 | 16.727273 | 0.5715 | 0 | 9 | 3155 | 0.2852615 | 0.25010 | 0 | 1979 | 3298 | 60.006064 | 0.77030 | 1 | 1502 | 14 | 0.9320905 | 0.3234 | 0 | 659 | 43.8748336 | 0.9849 | 1 | 44 | 1323 | 3.325775 | 0.7062 | 0 | 137 | 1323 | 10.3552532 | 0.73130 | 0 | 0 | 3298 | 0.0000 | 0.3640 | 0 | 3.33770 | 0.7351 | 2 | 2.69580 | 0.6028 | 1 | 0.77030 | 0.7631 | 1 | 3.10980 | 0.7827 | 1 | 9.91360 | 0.7557 | 5 | 3499 | 1825 | 1462 | 1760 | 3499 | 50.300086 | 0.9396 | 1 | 42 | 966 | 4.347826 | 0.45390 | 0 | 426 | 1274 | 33.437991 | 0.85200 | 1 | 52 | 188 | 27.65957 | 0.1824 | 0 | 478 | 1462 | 32.69494 | 0.61110 | 0 | 422 | 2488 | 16.961415 | 0.7638 | 1 | 497 | 3499 | 14.204058 | 0.8246 | 1 | 853 | 24.378394 | 0.8688 | 1 | 808 | 23.09231 | 0.58290 | 0 | 908 | 2691.100 | 33.740844 | 0.9808 | 1 | 179 | 811.6985 | 22.0525243 | 0.73230 | 0 | 8 | 3248 | 0.2463054 | 0.26220 | 0 | 1986 | 3498.713 | 56.7637257 | 0.717500 | 0 | 1825 | 29 | 1.5890411 | 0.3551 | 0 | 576 | 31.5616438 | 0.9594 | 1 | 88 | 1462 | 6.0191518 | 0.82690 | 1 | 148 | 1461.993 | 10.123166 | 0.7364 | 0 | 38 | 3499 | 1.0860246 | 0.7013 | 0 | 3.59300 | 0.8073 | 3 | 3.42700 | 0.91560 | 2 | 0.717500 | 0.711400 | 0 | 3.57910 | 0.9216 | 2 | 11.316600 | 0.9150 | 7 | Yes | 0 | 0 | \$0 | 0 | 0 | \$0 | 0 | Census Tract 211, Autauga County, Alabama | 17997 | 74000 | 20620 | 88600 | 20876.52 | 85840 | -256.52 | -0.0122875 | 2760 | 0.0321528 | 134.13 | 145.41 | Autauga County, Alabama | Montgomery-Alexander City, AL CSA | CS388 |
| 01003010200 | 01003 | 010200 | AL | Alabama | Baldwin County | 3 | South Region | 6 | East South Central Division | 2612 | 1220 | 1074 | 338 | 2605 | 12.97505 | 0.2907 | 0 | 44 | 1193 | 3.688181 | 0.14720 | 0 | 172 | 928 | 18.53448 | 0.13090 | 0 | 31 | 146 | 21.23288 | 0.09299 | 0 | 203 | 1074 | 18.90130 | 0.05657 | 0 | 455 | 1872 | 24.305556 | 0.8016 | 1 | 456 | 2730 | 16.70330 | 0.6445 | 0 | 401 | 15.35222 | 0.6847 | 0 | 563 | 21.55436 | 0.3406 | 0 | 410 | 2038 | 20.11776 | 0.7755 | 1 | 64 | 779 | 8.215661 | 0.2181 | 0 | 0 | 2510 | 0.0000000 | 0.09298 | 0 | 329 | 2612 | 12.595712 | 0.31130 | 0 | 1220 | 38 | 3.1147541 | 0.4648 | 0 | 385 | 31.5573770 | 0.9545 | 1 | 20 | 1074 | 1.862197 | 0.5509 | 0 | 43 | 1074 | 4.0037244 | 0.40880 | 0 | 0 | 2612 | 0.0000 | 0.3640 | 0 | 1.94057 | 0.3398 | 1 | 2.11188 | 0.2802 | 1 | 0.31130 | 0.3084 | 0 | 2.74300 | 0.6129 | 1 | 7.10675 | 0.3771 | 3 | 2928 | 1312 | 1176 | 884 | 2928 | 30.191257 | 0.7334 | 0 | 29 | 1459 | 1.987663 | 0.13560 | 0 | 71 | 830 | 8.554217 | 0.03726 | 0 | 134 | 346 | 38.72832 | 0.3964 | 0 | 205 | 1176 | 17.43197 | 0.12010 | 0 | 294 | 2052 | 14.327485 | 0.6940 | 0 | 219 | 2925 | 7.487179 | 0.5423 | 0 | 556 | 18.989071 | 0.6705 | 0 | 699 | 23.87295 | 0.63390 | 0 | 489 | 2226.455 | 21.963167 | 0.8122 | 1 | 191 | 783.8820 | 24.3659136 | 0.77990 | 1 | 0 | 2710 | 0.0000000 | 0.09479 | 0 | 398 | 2927.519 | 13.5951280 | 0.251100 | 0 | 1312 | 13 | 0.9908537 | 0.3111 | 0 | 400 | 30.4878049 | 0.9557 | 1 | 6 | 1176 | 0.5102041 | 0.25900 | 0 | 81 | 1176.202 | 6.886570 | 0.6115 | 0 | 7 | 2928 | 0.2390710 | 0.4961 | 0 | 2.22540 | 0.4183 | 0 | 2.99129 | 0.76340 | 2 | 0.251100 | 0.249000 | 0 | 2.63340 | 0.5496 | 1 | 8.101190 | 0.5207 | 3 | Yes | 0 | 0 | \$0 | 1 | 408000 | \$408,000 | 1 | Census Tract 102, Baldwin County, Alabama | 23862 | 103200 | 26085 | 136900 | 27679.92 | 119712 | -1594.92 | -0.0576201 | 17188 | 0.1435779 | 128.38 | 166.27 | Baldwin County, Alabama | Mobile-Daphne-Fairhope, AL CSA | CS380 |
| 01003010500 | 01003 | 010500 | AL | Alabama | Baldwin County | 3 | South Region | 6 | East South Central Division | 4230 | 1779 | 1425 | 498 | 3443 | 14.46413 | 0.3337 | 0 | 166 | 1625 | 10.215385 | 0.71790 | 0 | 151 | 1069 | 14.12535 | 0.04638 | 0 | 196 | 356 | 55.05618 | 0.73830 | 0 | 347 | 1425 | 24.35088 | 0.17010 | 0 | 707 | 2945 | 24.006791 | 0.7967 | 1 | 528 | 4001 | 13.19670 | 0.5005 | 0 | 619 | 14.63357 | 0.6436 | 0 | 790 | 18.67612 | 0.1937 | 0 | 536 | 3096 | 17.31266 | 0.6572 | 0 | 165 | 920 | 17.934783 | 0.6102 | 0 | 20 | 4021 | 0.4973887 | 0.32320 | 0 | 754 | 4230 | 17.825059 | 0.40230 | 0 | 1779 | 97 | 5.4525014 | 0.5525 | 0 | 8 | 0.4496908 | 0.4600 | 0 | 63 | 1425 | 4.421053 | 0.7762 | 1 | 90 | 1425 | 6.3157895 | 0.56910 | 0 | 787 | 4230 | 18.6052 | 0.9649 | 1 | 2.51890 | 0.5121 | 1 | 2.42790 | 0.4539 | 0 | 0.40230 | 0.3986 | 0 | 3.32270 | 0.8628 | 2 | 8.67180 | 0.6054 | 3 | 5877 | 1975 | 1836 | 820 | 5244 | 15.636918 | 0.3902 | 0 | 90 | 2583 | 3.484321 | 0.33610 | 0 | 159 | 1345 | 11.821561 | 0.10530 | 0 | 139 | 491 | 28.30957 | 0.1924 | 0 | 298 | 1836 | 16.23094 | 0.09053 | 0 | 570 | 4248 | 13.418079 | 0.6669 | 0 | 353 | 5247 | 6.727654 | 0.4924 | 0 | 1109 | 18.870172 | 0.6645 | 0 | 1144 | 19.46571 | 0.34110 | 0 | 717 | 4102.545 | 17.476956 | 0.6332 | 0 | 103 | 1286.1180 | 8.0085961 | 0.23410 | 0 | 0 | 5639 | 0.0000000 | 0.09479 | 0 | 868 | 5877.481 | 14.7682323 | 0.270900 | 0 | 1975 | 26 | 1.3164557 | 0.3359 | 0 | 45 | 2.2784810 | 0.6271 | 0 | 9 | 1836 | 0.4901961 | 0.25400 | 0 | 116 | 1835.798 | 6.318779 | 0.5811 | 0 | 633 | 5877 | 10.7708014 | 0.9507 | 1 | 1.97613 | 0.3410 | 0 | 1.96769 | 0.19610 | 0 | 0.270900 | 0.268600 | 0 | 2.74880 | 0.6077 | 1 | 6.963520 | 0.3406 | 1 | Yes | 0 | 0 | \$0 | 0 | 0 | \$0 | 0 | Census Tract 105, Baldwin County, Alabama | 21585 | 121100 | 28301 | 148500 | 25038.60 | 140476 | 3262.40 | 0.1302948 | 8024 | 0.0571201 | 191.57 | 213.49 | Baldwin County, Alabama | Mobile-Daphne-Fairhope, AL CSA | CS380 |
| 01003010600 | 01003 | 010600 | AL | Alabama | Baldwin County | 3 | South Region | 6 | East South Central Division | 3724 | 1440 | 1147 | 1973 | 3724 | 52.98067 | 0.9342 | 1 | 142 | 1439 | 9.867964 | 0.69680 | 0 | 235 | 688 | 34.15698 | 0.62950 | 0 | 187 | 459 | 40.74074 | 0.40290 | 0 | 422 | 1147 | 36.79163 | 0.55150 | 0 | 497 | 1876 | 26.492537 | 0.8354 | 1 | 511 | 3661 | 13.95794 | 0.5334 | 0 | 246 | 6.60580 | 0.1481 | 0 | 1256 | 33.72718 | 0.9305 | 1 | 496 | 2522 | 19.66693 | 0.7587 | 1 | 274 | 838 | 32.696897 | 0.8779 | 1 | 32 | 3479 | 0.9198045 | 0.42810 | 0 | 2606 | 3724 | 69.978518 | 0.81840 | 1 | 1440 | 21 | 1.4583333 | 0.3683 | 0 | 321 | 22.2916667 | 0.9036 | 1 | 97 | 1147 | 8.456844 | 0.8956 | 1 | 167 | 1147 | 14.5597210 | 0.82090 | 1 | 0 | 3724 | 0.0000 | 0.3640 | 0 | 3.55130 | 0.7859 | 2 | 3.14330 | 0.8145 | 3 | 0.81840 | 0.8108 | 1 | 3.35240 | 0.8725 | 3 | 10.86540 | 0.8550 | 9 | 4115 | 1534 | 1268 | 1676 | 3997 | 41.931449 | 0.8814 | 1 | 294 | 1809 | 16.252073 | 0.96740 | 1 | 341 | 814 | 41.891892 | 0.94320 | 1 | 204 | 454 | 44.93392 | 0.5438 | 0 | 545 | 1268 | 42.98107 | 0.83620 | 1 | 624 | 2425 | 25.731959 | 0.9002 | 1 | 994 | 4115 | 24.155529 | 0.9602 | 1 | 642 | 15.601458 | 0.4841 | 0 | 1126 | 27.36331 | 0.81750 | 1 | 568 | 2989.000 | 19.003011 | 0.7045 | 0 | 212 | 715.0000 | 29.6503497 | 0.85920 | 1 | 56 | 3825 | 1.4640523 | 0.53120 | 0 | 2715 | 4115.000 | 65.9781288 | 0.773200 | 1 | 1534 | 0 | 0.0000000 | 0.1079 | 0 | 529 | 34.4850065 | 0.9685 | 1 | 101 | 1268 | 7.9652997 | 0.87950 | 1 | 89 | 1268.000 | 7.018927 | 0.6184 | 0 | 17 | 4115 | 0.4131227 | 0.5707 | 0 | 4.54540 | 0.9754 | 5 | 3.39650 | 0.90810 | 2 | 0.773200 | 0.766700 | 1 | 3.14500 | 0.7858 | 2 | 11.860100 | 0.9520 | 10 | Yes | 0 | 0 | \$0 | 1 | 8000000 | \$8,000,000 | 1 | Census Tract 106, Baldwin County, Alabama | 17788 | 81600 | 16453 | 104700 | 20634.08 | 94656 | -4181.08 | -0.2026298 | 10044 | 0.1061105 | NA | NA | Baldwin County, Alabama | Mobile-Daphne-Fairhope, AL CSA | CS380 |
| 01003011000 | 01003 | 011000 | AL | Alabama | Baldwin County | 3 | South Region | 6 | East South Central Division | 3758 | 2012 | 1576 | 1053 | 3758 | 28.02022 | 0.6597 | 0 | 66 | 1707 | 3.866432 | 0.16250 | 0 | 293 | 1297 | 22.59059 | 0.25080 | 0 | 83 | 279 | 29.74910 | 0.19030 | 0 | 376 | 1576 | 23.85787 | 0.15710 | 0 | 744 | 2723 | 27.322806 | 0.8465 | 1 | 996 | 4137 | 24.07542 | 0.8462 | 1 | 713 | 18.97286 | 0.8429 | 1 | 804 | 21.39436 | 0.3306 | 0 | 763 | 3295 | 23.15630 | 0.8670 | 1 | 155 | 1145 | 13.537118 | 0.4538 | 0 | 50 | 3475 | 1.4388489 | 0.51460 | 0 | 516 | 3758 | 13.730708 | 0.33300 | 0 | 2012 | 0 | 0.0000000 | 0.1224 | 0 | 606 | 30.1192843 | 0.9484 | 1 | 42 | 1576 | 2.664975 | 0.6476 | 0 | 96 | 1576 | 6.0913706 | 0.55620 | 0 | 0 | 3758 | 0.0000 | 0.3640 | 0 | 2.67200 | 0.5579 | 2 | 3.00890 | 0.7581 | 2 | 0.33300 | 0.3299 | 0 | 2.63860 | 0.5614 | 1 | 8.65250 | 0.6030 | 5 | 4921 | 1979 | 1732 | 1539 | 4908 | 31.356968 | 0.7523 | 1 | 150 | 2105 | 7.125891 | 0.72850 | 0 | 214 | 1471 | 14.547927 | 0.20260 | 0 | 59 | 261 | 22.60536 | 0.1167 | 0 | 273 | 1732 | 15.76212 | 0.07981 | 0 | 936 | 3332 | 28.091237 | 0.9206 | 1 | 861 | 4921 | 17.496444 | 0.8930 | 1 | 1039 | 21.113595 | 0.7653 | 1 | 1183 | 24.03983 | 0.64410 | 0 | 585 | 3738.000 | 15.650080 | 0.5371 | 0 | 81 | 1151.0000 | 7.0373588 | 0.19000 | 0 | 101 | 4546 | 2.2217334 | 0.61440 | 0 | 1244 | 4921.000 | 25.2794148 | 0.427800 | 0 | 1979 | 0 | 0.0000000 | 0.1079 | 0 | 527 | 26.6296109 | 0.9393 | 1 | 83 | 1732 | 4.7921478 | 0.77460 | 1 | 151 | 1732.000 | 8.718245 | 0.6904 | 0 | 20 | 4921 | 0.4064215 | 0.5688 | 0 | 3.37421 | 0.7528 | 3 | 2.75090 | 0.63780 | 1 | 0.427800 | 0.424200 | 0 | 3.08100 | 0.7597 | 2 | 9.633910 | 0.7366 | 6 | Yes | 0 | 0 | \$0 | 0 | 0 | \$0 | 0 | Census Tract 110, Baldwin County, Alabama | 19340 | 126400 | 23679 | 158700 | 22434.40 | 146624 | 1244.60 | 0.0554773 | 12076 | 0.0823603 | 129.69 | 188.85 | Baldwin County, Alabama | Mobile-Daphne-Fairhope, AL CSA | CS380 |
| 01003011406 | 01003 | 011406 | AL | Alabama | Baldwin County | 3 | South Region | 6 | East South Central Division | 3317 | 6418 | 1307 | 583 | 3317 | 17.57612 | 0.4181 | 0 | 70 | 1789 | 3.912800 | 0.16690 | 0 | 221 | 685 | 32.26277 | 0.57540 | 0 | 284 | 622 | 45.65916 | 0.52130 | 0 | 505 | 1307 | 38.63810 | 0.60430 | 0 | 168 | 2255 | 7.450111 | 0.2800 | 0 | 919 | 3677 | 24.99320 | 0.8623 | 1 | 452 | 13.62677 | 0.5791 | 0 | 673 | 20.28942 | 0.2668 | 0 | 366 | 2769 | 13.21777 | 0.4276 | 0 | 96 | 887 | 10.822999 | 0.3359 | 0 | 180 | 3066 | 5.8708415 | 0.77920 | 1 | 473 | 3317 | 14.259873 | 0.34330 | 0 | 6418 | 3976 | 61.9507635 | 0.9655 | 1 | 384 | 5.9831723 | 0.7063 | 0 | 17 | 1307 | 1.300689 | 0.4632 | 0 | 10 | 1307 | 0.7651109 | 0.08684 | 0 | 0 | 3317 | 0.0000 | 0.3640 | 0 | 2.33160 | 0.4577 | 1 | 2.38860 | 0.4323 | 1 | 0.34330 | 0.3401 | 0 | 2.58584 | 0.5335 | 1 | 7.64934 | 0.4576 | 3 | 3226 | 7850 | 1797 | 228 | 3215 | 7.091757 | 0.1241 | 0 | 72 | 2055 | 3.503650 | 0.33910 | 0 | 302 | 1139 | 26.514486 | 0.69300 | 0 | 230 | 658 | 34.95441 | 0.3131 | 0 | 532 | 1797 | 29.60490 | 0.52020 | 0 | 128 | 2726 | 4.695525 | 0.2384 | 0 | 530 | 3226 | 16.429014 | 0.8749 | 1 | 790 | 24.488531 | 0.8715 | 1 | 342 | 10.60136 | 0.05624 | 0 | 280 | 2884.000 | 9.708738 | 0.1832 | 0 | 58 | 792.0000 | 7.3232323 | 0.20270 | 0 | 15 | 3107 | 0.4827808 | 0.34070 | 0 | 15 | 3226.000 | 0.4649721 | 0.002512 | 0 | 7850 | 5394 | 68.7133758 | 0.9706 | 1 | 274 | 3.4904459 | 0.6697 | 0 | 23 | 1797 | 1.2799110 | 0.41980 | 0 | 26 | 1797.000 | 1.446856 | 0.1647 | 0 | 0 | 3226 | 0.0000000 | 0.1831 | 0 | 2.09670 | 0.3785 | 1 | 1.65434 | 0.08785 | 1 | 0.002512 | 0.002491 | 0 | 2.40790 | 0.4381 | 1 | 6.161452 | 0.2215 | 3 | Yes | 0 | 0 | \$0 | 0 | 0 | \$0 | 0 | Census Tract 114.06, Baldwin County, Alabama | 29838 | 252000 | 32201 | 224200 | 34612.08 | 292320 | -2411.08 | -0.0696601 | -68120 | -0.2330323 | NA | NA | Baldwin County, Alabama | Mobile-Daphne-Fairhope, AL CSA | CS380 |
| 01003011407 | 01003 | 011407 | AL | Alabama | Baldwin County | 3 | South Region | 6 | East South Central Division | 5187 | 6687 | 2066 | 1404 | 5172 | 27.14617 | 0.6423 | 0 | 172 | 1935 | 8.888889 | 0.63280 | 0 | 482 | 1433 | 33.63573 | 0.61530 | 0 | 367 | 633 | 57.97788 | 0.79510 | 1 | 849 | 2066 | 41.09390 | 0.67110 | 0 | 278 | 3618 | 7.683803 | 0.2906 | 0 | 1027 | 4945 | 20.76845 | 0.7735 | 1 | 1398 | 26.95200 | 0.9629 | 1 | 1263 | 24.34933 | 0.5302 | 0 | 596 | 3792 | 15.71730 | 0.5759 | 0 | 158 | 1633 | 9.675444 | 0.2833 | 0 | 29 | 4867 | 0.5958496 | 0.35240 | 0 | 170 | 5187 | 3.277424 | 0.07984 | 0 | 6687 | 2772 | 41.4535666 | 0.9251 | 1 | 197 | 2.9460147 | 0.6326 | 0 | 90 | 2066 | 4.356244 | 0.7729 | 1 | 0 | 2066 | 0.0000000 | 0.02586 | 0 | 0 | 5187 | 0.0000 | 0.3640 | 0 | 3.01030 | 0.6516 | 1 | 2.70470 | 0.6077 | 1 | 0.07984 | 0.0791 | 0 | 2.72046 | 0.6014 | 2 | 8.51530 | 0.5852 | 4 | 5608 | 7576 | 2543 | 1058 | 5602 | 18.886112 | 0.4835 | 0 | 32 | 2631 | 1.216268 | 0.05882 | 0 | 581 | 1979 | 29.358262 | 0.77080 | 1 | 309 | 564 | 54.78723 | 0.7671 | 1 | 890 | 2543 | 34.99803 | 0.67250 | 0 | 230 | 4433 | 5.188360 | 0.2698 | 0 | 776 | 5602 | 13.852196 | 0.8156 | 1 | 1527 | 27.228959 | 0.9205 | 1 | 567 | 10.11056 | 0.05099 | 0 | 615 | 5035.000 | 12.214498 | 0.3295 | 0 | 16 | 1746.0000 | 0.9163803 | 0.01566 | 0 | 0 | 5573 | 0.0000000 | 0.09479 | 0 | 441 | 5608.000 | 7.8637660 | 0.140300 | 0 | 7576 | 3055 | 40.3247096 | 0.9148 | 1 | 72 | 0.9503696 | 0.5383 | 0 | 0 | 2543 | 0.0000000 | 0.09796 | 0 | 125 | 2543.000 | 4.915454 | 0.4934 | 0 | 6 | 5608 | 0.1069900 | 0.4054 | 0 | 2.30022 | 0.4418 | 1 | 1.41144 | 0.04295 | 1 | 0.140300 | 0.139100 | 0 | 2.44986 | 0.4589 | 1 | 6.301820 | 0.2416 | 3 | Yes | 0 | 0 | \$0 | 0 | 0 | \$0 | 0 | Census Tract 114.07, Baldwin County, Alabama | 22317 | 292600 | 28418 | 241100 | 25887.72 | 339416 | 2530.28 | 0.0977406 | -98316 | -0.2896622 | NA | NA | Baldwin County, Alabama | Mobile-Daphne-Fairhope, AL CSA | CS380 |
| 01003011502 | 01003 | 011502 | AL | Alabama | Baldwin County | 3 | South Region | 6 | East South Central Division | 9234 | 4606 | 3702 | 3160 | 9213 | 34.29936 | 0.7632 | 1 | 282 | 4002 | 7.046477 | 0.47570 | 0 | 526 | 2158 | 24.37442 | 0.31260 | 0 | 582 | 1544 | 37.69430 | 0.33410 | 0 | 1108 | 3702 | 29.92977 | 0.33740 | 0 | 997 | 6176 | 16.143135 | 0.6201 | 0 | 2074 | 10111 | 20.51231 | 0.7670 | 1 | 1450 | 15.70284 | 0.7043 | 0 | 2491 | 26.97639 | 0.6984 | 0 | 1542 | 7577 | 20.35106 | 0.7842 | 1 | 684 | 2718 | 25.165563 | 0.7767 | 1 | 532 | 8697 | 6.1170519 | 0.78590 | 1 | 3275 | 9234 | 35.466753 | 0.60970 | 0 | 4606 | 214 | 4.6461138 | 0.5268 | 0 | 828 | 17.9765523 | 0.8689 | 1 | 89 | 3702 | 2.404106 | 0.6192 | 0 | 293 | 3702 | 7.9146407 | 0.64700 | 0 | 0 | 9234 | 0.0000 | 0.3640 | 0 | 2.96340 | 0.6387 | 2 | 3.74950 | 0.9623 | 3 | 0.60970 | 0.6040 | 0 | 3.02590 | 0.7475 | 1 | 10.34850 | 0.8024 | 6 | 14165 | 6867 | 6002 | 2853 | 14165 | 20.141193 | 0.5175 | 0 | 313 | 7047 | 4.441606 | 0.46620 | 0 | 1181 | 4164 | 28.362152 | 0.74500 | 0 | 887 | 1838 | 48.25898 | 0.6211 | 0 | 2068 | 6002 | 34.45518 | 0.65900 | 0 | 1667 | 10750 | 15.506977 | 0.7286 | 0 | 2527 | 14165 | 17.839746 | 0.8980 | 1 | 3082 | 21.757854 | 0.7907 | 1 | 2506 | 17.69149 | 0.24240 | 0 | 3004 | 11659.000 | 25.765503 | 0.9038 | 1 | 407 | 3482.0000 | 11.6886847 | 0.39940 | 0 | 364 | 13519 | 2.6925068 | 0.65290 | 0 | 2755 | 14165.000 | 19.4493470 | 0.346300 | 0 | 6867 | 441 | 6.4220183 | 0.5555 | 0 | 526 | 7.6598223 | 0.7585 | 1 | 93 | 6002 | 1.5494835 | 0.46540 | 0 | 184 | 6002.000 | 3.065645 | 0.3373 | 0 | 0 | 14165 | 0.0000000 | 0.1831 | 0 | 3.26930 | 0.7261 | 1 | 2.98920 | 0.76250 | 2 | 0.346300 | 0.343400 | 0 | 2.29980 | 0.3856 | 1 | 8.904600 | 0.6398 | 4 | Yes | 0 | 0 | \$0 | 2 | 8860000 | \$8,860,000 | 1 | Census Tract 115.02, Baldwin County, Alabama | 20411 | 162700 | 22820 | 180400 | 23676.76 | 188732 | -856.76 | -0.0361857 | -8332 | -0.0441473 | NA | NA | Baldwin County, Alabama | Mobile-Daphne-Fairhope, AL CSA | CS380 |
LIHTC Data
svi_divisional_lihtc_df0 <- left_join(svi_divisional_lihtc, census_pull_df, join_by("GEOID_2010_trt" == "GEOID"))

svi_divisional_lihtc_df1 <- left_join(svi_divisional_lihtc_df0, hpi_df_10_20, join_by("GEOID_2010_trt" == "GEOID10")) %>%
                          unite("county_fips", FIPS_st, FIPS_county, sep = "")

svi_divisional_lihtc_df <- left_join(svi_divisional_lihtc_df1, msa_csa_crosswalk, join_by("county_fips" == "county_fips"))

svi_divisional_lihtc_df %>% head(10) %>% kbl() %>% kable_styling() %>% scroll_box(width = "100%")
| GEOID_2010_trt | county_fips | FIPS_tract | state | state_name | county | region_number | region | division_number | division | E_TOTPOP_10 | E_HU_10 | E_HH_10 | E_POV150_10 | ET_POVSTATUS_10 | EP_POV150_10 | EPL_POV150_10 | F_POV150_10 | E_UNEMP_10 | ET_EMPSTATUS_10 | EP_UNEMP_10 | EPL_UNEMP_10 | F_UNEMP_10 | E_HBURD_OWN_10 | ET_HOUSINGCOST_OWN_10 | EP_HBURD_OWN_10 | EPL_HBURD_OWN_10 | F_HBURD_OWN_10 | E_HBURD_RENT_10 | ET_HOUSINGCOST_RENT_10 | EP_HBURD_RENT_10 | EPL_HBURD_RENT_10 | F_HBURD_RENT_10 | E_HBURD_10 | ET_HOUSINGCOST_10 | EP_HBURD_10 | EPL_HBURD_10 | F_HBURD_10 | E_NOHSDP_10 | ET_EDSTATUS_10 | EP_NOHSDP_10 | EPL_NOHSDP_10 | F_NOHSDP_10 | E_UNINSUR_12 | ET_INSURSTATUS_12 | EP_UNINSUR_12 | EPL_UNINSUR_12 | F_UNINSUR_12 | E_AGE65_10 | EP_AGE65_10 | EPL_AGE65_10 | F_AGE65_10 | E_AGE17_10 | EP_AGE17_10 | EPL_AGE17_10 | F_AGE17_10 | E_DISABL_12 | ET_DISABLSTATUS_12 | EP_DISABL_12 | EPL_DISABL_12 | F_DISABL_12 | E_SNGPNT_10 | ET_FAMILIES_10 | EP_SNGPNT_10 | EPL_SNGPNT_10 | F_SNGPNT_10 | E_LIMENG_10 | ET_POPAGE5UP_10 | EP_LIMENG_10 | EPL_LIMENG_10 | F_LIMENG_10 | E_MINRTY_10 | ET_POPETHRACE_10 | EP_MINRTY_10 | EPL_MINRTY_10 | F_MINRTY_10 | E_STRHU_10 | E_MUNIT_10 | EP_MUNIT_10 | EPL_MUNIT_10 | F_MUNIT_10 | E_MOBILE_10 | EP_MOBILE_10 | EPL_MOBILE_10 | F_MOBILE_10 | E_CROWD_10 | ET_OCCUPANTS_10 | EP_CROWD_10 | EPL_CROWD_10 | F_CROWD_10 | E_NOVEH_10 | ET_KNOWNVEH_10 | EP_NOVEH_10 | EPL_NOVEH_10 | F_NOVEH_10 | E_GROUPQ_10 | ET_HHTYPE_10 | EP_GROUPQ_10 | EPL_GROUPQ_10 | F_GROUPQ_10 | SPL_THEME1_10 | RPL_THEME1_10 | F_THEME1_10 | SPL_THEME2_10 | RPL_THEME2_10 | F_THEME2_10 | SPL_THEME3_10 | RPL_THEME3_10 | F_THEME3_10 | SPL_THEME4_10 | RPL_THEME4_10 | F_THEME4_10 | SPL_THEMES_10 | RPL_THEMES_10 | F_TOTAL_10 | E_TOTPOP_20 | E_HU_20 | E_HH_20 | E_POV150_20 | ET_POVSTATUS_20 | EP_POV150_20 | EPL_POV150_20 | F_POV150_20 | E_UNEMP_20 | ET_EMPSTATUS_20 | EP_UNEMP_20 | EPL_UNEMP_20 | F_UNEMP_20 | E_HBURD_OWN_20 | ET_HOUSINGCOST_OWN_20 | EP_HBURD_OWN_20 | EPL_HBURD_OWN_20 | F_HBURD_OWN_20 | E_HBURD_RENT_20 | ET_HOUSINGCOST_RENT_20 | EP_HBURD_RENT_20 | EPL_HBURD_RENT_20 | F_HBURD_RENT_20 | E_HBURD_20 | ET_HOUSINGCOST_20 | EP_HBURD_20 | EPL_HBURD_20 | F_HBURD_20 | E_NOHSDP_20 | ET_EDSTATUS_20 | EP_NOHSDP_20 | EPL_NOHSDP_20 | F_NOHSDP_20 | E_UNINSUR_20 | ET_INSURSTATUS_20 | EP_UNINSUR_20 | EPL_UNINSUR_20 | F_UNINSUR_20 | E_AGE65_20 | EP_AGE65_20 | EPL_AGE65_20 | F_AGE65_20 | E_AGE17_20 | EP_AGE17_20 | EPL_AGE17_20 | F_AGE17_20 | E_DISABL_20 | ET_DISABLSTATUS_20 | EP_DISABL_20 | EPL_DISABL_20 | F_DISABL_20 | E_SNGPNT_20 | ET_FAMILIES_20 | EP_SNGPNT_20 | EPL_SNGPNT_20 | F_SNGPNT_20 | E_LIMENG_20 | ET_POPAGE5UP_20 | EP_LIMENG_20 | EPL_LIMENG_20 | F_LIMENG_20 | E_MINRTY_20 | ET_POPETHRACE_20 | EP_MINRTY_20 | EPL_MINRTY_20 | F_MINRTY_20 | E_STRHU_20 | E_MUNIT_20 | EP_MUNIT_20 | EPL_MUNIT_20 | F_MUNIT_20 | E_MOBILE_20 | EP_MOBILE_20 | EPL_MOBILE_20 | F_MOBILE_20 | E_CROWD_20 | ET_OCCUPANTS_20 | EP_CROWD_20 | EPL_CROWD_20 | F_CROWD_20 | E_NOVEH_20 | ET_KNOWNVEH_20 | EP_NOVEH_20 | EPL_NOVEH_20 | F_NOVEH_20 | E_GROUPQ_20 | ET_HHTYPE_20 | EP_GROUPQ_20 | EPL_GROUPQ_20 | F_GROUPQ_20 | SPL_THEME1_20 | RPL_THEME1_20 | F_THEME1_20 | SPL_THEME2_20 | RPL_THEME2_20 | F_THEME2_20 | SPL_THEME3_20 | RPL_THEME3_20 | F_THEME3_20 | SPL_THEME4_20 | RPL_THEME4_20 | F_THEME4_20 | SPL_THEMES_20 | RPL_THEMES_20 | F_TOTAL_20 | pre10_lihtc_project_cnt | pre10_lihtc_project_dollars | post10_lihtc_project_cnt | post10_lihtc_project_dollars | lihtc_flag | lihtc_eligibility | NAME | Median_Income_10 | Median_Home_Value_10 | Median_Income_19 | Median_Home_Value_19 | Median_Income_10adj | Median_Home_Value_10adj | Median_Income_Change | Median_Income_Change_pct | Median_Home_Value_Change | Median_Home_Value_Change_pct | housing_price_index10 | housing_price_index20 | county_title | cbsa | cbsa_code |
|---|---|---|---|---|---|---|---|---|---|---|---|---|---|---|---|---|---|---|---|---|---|---|---|---|---|---|---|---|---|---|---|---|---|---|---|---|---|---|---|---|---|---|---|---|---|---|---|---|---|---|---|---|---|---|---|---|---|---|---|---|---|---|---|---|---|---|---|---|---|---|---|---|---|---|---|---|---|---|---|---|---|---|---|---|---|---|---|---|---|---|---|---|---|---|---|---|---|---|---|---|---|---|---|---|---|---|---|---|---|---|---|---|---|---|---|---|---|---|---|---|---|---|---|---|---|---|---|---|---|---|---|---|---|---|---|---|---|---|---|---|---|---|---|---|---|---|---|---|---|---|---|---|---|---|---|---|---|---|---|---|---|---|---|---|---|---|---|---|---|---|---|---|---|---|---|---|---|---|---|---|---|---|---|---|---|---|---|---|---|---|---|---|---|---|---|---|---|---|---|---|---|---|---|---|---|---|---|---|---|---|---|---|---|---|---|---|---|---|---|---|---|---|---|---|---|---|---|---|---|---|---|---|---|---|---|---|---|---|---|---|---|
| 19013000500 | 19013 | 000500 | IA | Iowa | Black Hawk County | 2 | Midwest Region | 4 | West North Central Division | 1918 | 653 | 653 | 349 | 1900 | 18.36842 | 0.4573 | 0 | 151 | 1240 | 12.177419 | 0.8947 | 1 | 128 | 492 | 26.016260 | 0.672200 | 0 | 93 | 161 | 57.76398 | 0.8759 | 1 | 221 | 653 | 33.84380 | 0.7474 | 0 | 292 | 1157 | 25.237684 | 0.93060 | 1 | 347 | 1809 | 19.181868 | 0.8703 | 1 | 134 | 6.986444 | 0.131500 | 0 | 466 | 24.296142 | 0.51430 | 0 | 252 | 1357 | 18.570376 | 0.753900 | 1 | 186 | 468 | 39.743590 | 0.952400 | 1 | 102 | 1832 | 5.5676856 | 0.9196 | 1 | 733 | 1918 | 38.216893 | 0.8788 | 1 | 653 | 0 | 0.000000 | 0.09728 | 0 | 0 | 0.0000000 | 0.1716 | 0 | 0 | 653 | 0.000000 | 0.1372 | 0 | 53 | 653 | 8.116386 | 0.7427 | 0 | 0 | 1918 | 0.000000 | 0.3161 | 0 | 3.90030 | 0.8577 | 3 | 3.271700 | 0.864900 | 3 | 0.8788 | 0.8751 | 1 | 1.46488 | 0.07947 | 0 | 9.515680 | 0.7256 | 7 | 1742 | 688 | 625 | 585 | 1678 | 34.86293 | 0.8624 | 1 | 117 | 906 | 12.913907 | 0.9730 | 1 | 67 | 328 | 20.426829 | 0.734200 | 0 | 136 | 297 | 45.79125 | 0.7216 | 0 | 203 | 625 | 32.48000 | 0.8277 | 1 | 192 | 959 | 20.0208551 | 0.92800 | 1 | 132 | 1742 | 7.577497 | 0.6121 | 0 | 149 | 8.553387 | 0.096280 | 0 | 505 | 28.989667 | 0.873900 | 1 | 254 | 1237.000 | 20.533549 | 0.803600 | 1 | 122 | 357.0000 | 34.173670 | 0.930600 | 1 | 0 | 1621 | 0.0000000 | 0.1327 | 0 | 829 | 1742.000 | 47.588978 | 0.8874 | 1 | 688 | 0 | 0.00000 | 0.0847 | 0 | 0 | 0.000000 | 0.1738 | 0 | 9 | 625 | 1.4400000 | 0.55030 | 0 | 64 | 625.00 | 10.240000 | 0.8245 | 1 | 0 | 1742 | 0.0000000 | 0.1414 | 0 | 4.20320 | 0.9184 | 4 | 2.837080 | 0.6861000 | 3 | 0.8874 | 0.8842 | 1 | 1.77470 | 0.1856 | 1 | 9.702380 | 0.7535 | 9 | 0 | 0 | 0 | 0 | 0 | Yes | Census Tract 5, Black Hawk County, Iowa | 21996 | 67000 | 21578 | 64700 | 25515.36 | 77720 | -3937.36 | -0.1543133 | -13020 | -0.1675244 | NA | NA | Black Hawk County, Iowa | Waterloo-Cedar Falls, IA MSA | C4794 |
| 19103000600 | 19103 | 000600 | IA | Iowa | Johnson County | 2 | Midwest Region | 4 | West North Central Division | 3161 | 1846 | 1765 | 1356 | 3083 | 43.98313 | 0.9101 | 1 | 139 | 2099 | 6.622201 | 0.6243 | 0 | 39 | 255 | 15.294118 | 0.132900 | 0 | 900 | 1510 | 59.60265 | 0.8954 | 1 | 939 | 1765 | 53.20113 | 0.9753 | 1 | 30 | 1685 | 1.780415 | 0.04941 | 0 | 374 | 3183 | 11.749921 | 0.6140 | 0 | 376 | 11.894970 | 0.382100 | 0 | 161 | 5.093325 | 0.01140 | 0 | 187 | 2994 | 6.245825 | 0.052110 | 0 | 53 | 418 | 12.679426 | 0.504900 | 0 | 37 | 3109 | 1.1900933 | 0.6912 | 0 | 481 | 3161 | 15.216704 | 0.6618 | 0 | 1846 | 1068 | 57.854821 | 0.98060 | 1 | 14 | 0.7583965 | 0.4131 | 0 | 0 | 1765 | 0.000000 | 0.1372 | 0 | 200 | 1765 | 11.331445 | 0.8423 | 1 | 78 | 3161 | 2.467574 | 0.7596 | 1 | 3.17311 | 0.7090 | 2 | 1.641710 | 0.090820 | 0 | 0.6618 | 0.6590 | 0 | 3.13280 | 0.79140 | 3 | 8.609420 | 0.6083 | 5 | 3527 | 1999 | 1847 | 1820 | 3425 | 53.13869 | 0.9705 | 1 | 123 | 2258 | 5.447298 | 0.7512 | 1 | 57 | 337 | 16.913947 | 0.515200 | 0 | 796 | 1510 | 52.71523 | 0.8521 | 1 | 853 | 1847 | 46.18300 | 0.9667 | 1 | 39 | 2037 | 1.9145803 | 0.08963 | 0 | 393 | 3432 | 11.451049 | 0.7968 | 1 | 446 | 12.645308 | 0.251600 | 0 | 185 | 5.245251 | 0.012150 | 0 | 231 | 3246.994 | 7.114273 | 0.056830 | 0 | 70 | 394.7498 | 17.732749 | 0.676400 | 0 | 58 | 3400 | 1.7058824 | 0.7510 | 1 | 1169 | 3526.557 | 33.148474 | 0.8109 | 1 | 1999 | 1125 | 56.27814 | 0.9772 | 1 | 0 | 0.000000 | 0.1738 | 0 | 16 | 1847 | 0.8662696 | 0.41600 | 0 | 265 | 1846.57 | 14.350930 | 0.9002 | 1 | 95 | 3527 | 2.6935072 | 0.7704 | 1 | 3.57483 | 0.8078 | 4 | 1.747980 | 0.1249000 | 1 | 0.8109 | 0.8079 | 1 | 3.23760 | 0.8184 | 3 | 9.371310 | 0.7118 | 9 | 0 | 0 | 0 | 0 | 0 | Yes | Census Tract 6, Johnson County, Iowa | 15939 | 142500 | 19854 | 257500 | 18489.24 | 165300 | 1364.76 | 0.0738137 | 92200 | 0.5577737 | 201.44 | 293.09 | Johnson County, Iowa | Iowa City, IA MSA | C2698 |
| 19103001100 | 19103 | 001100 | IA | Iowa | Johnson County | 2 | Midwest Region | 4 | West North Central Division | 4138 | 1680 | 1601 | 2558 | 3792 | 67.45781 | 0.9911 | 1 | 172 | 3125 | 5.504000 | 0.5055 | 0 | 43 | 257 | 16.731517 | 0.193200 | 0 | 962 | 1344 | 71.57738 | 0.9713 | 1 | 1005 | 1601 | 62.77327 | 0.9945 | 1 | 25 | 1178 | 2.122241 | 0.06233 | 0 | 353 | 4208 | 8.388783 | 0.3911 | 0 | 83 | 2.005800 | 0.011970 | 0 | 150 | 3.624940 | 0.00741 | 0 | 156 | 3683 | 4.235677 | 0.016450 | 0 | 0 | 358 | 0.000000 | 0.004282 | 0 | 11 | 4068 | 0.2704031 | 0.3623 | 0 | 322 | 4138 | 7.781537 | 0.4349 | 0 | 1680 | 457 | 27.202381 | 0.89670 | 1 | 18 | 1.0714286 | 0.4486 | 0 | 0 | 1601 | 0.000000 | 0.1372 | 0 | 175 | 1601 | 10.930668 | 0.8323 | 1 | 346 | 4138 | 8.361527 | 0.9139 | 1 | 2.94453 | 0.6524 | 2 | 0.402412 | 0.001325 | 0 | 0.4349 | 0.4331 | 0 | 3.22870 | 0.82630 | 3 | 7.010542 | 0.3637 | 5 | 4742 | 2076 | 1851 | 2960 | 4333 | 68.31295 | 0.9954 | 1 | 133 | 3227 | 4.121475 | 0.6134 | 0 | 61 | 285 | 21.403509 | 0.778600 | 1 | 1185 | 1566 | 75.67050 | 0.9911 | 1 | 1246 | 1851 | 67.31496 | 0.9987 | 1 | 43 | 1434 | 2.9986053 | 0.16620 | 0 | 204 | 4706 | 4.334892 | 0.3480 | 0 | 126 | 2.657107 | 0.009305 | 0 | 220 | 4.639393 | 0.011200 | 0 | 307 | 4115.000 | 7.460510 | 0.066910 | 0 | 53 | 294.0000 | 18.027211 | 0.686100 | 0 | 19 | 4695 | 0.4046858 | 0.4766 | 0 | 736 | 4742.000 | 15.520877 | 0.5503 | 0 | 2076 | 512 | 24.66281 | 0.8694 | 1 | 0 | 0.000000 | 0.1738 | 0 | 12 | 1851 | 0.6482982 | 0.35040 | 0 | 281 | 1851.00 | 15.180983 | 0.9105 | 1 | 451 | 4742 | 9.5107550 | 0.9436 | 1 | 3.12170 | 0.6980 | 2 | 1.250115 | 0.0251700 | 0 | 0.5503 | 0.5483 | 0 | 3.24770 | 0.8231 | 3 | 8.169815 | 0.5351 | 5 | 0 | 0 | 0 | 0 | 0 | Yes | Census Tract 11, Johnson County, Iowa | 8019 | 183700 | 10460 | 280000 | 9302.04 | 213092 | 1157.96 | 0.1244845 | 66908 | 0.3139864 | 252.22 | 286.46 | Johnson County, Iowa | Iowa City, IA MSA | C2698 |
| 19103001600 | 19103 | 001600 | IA | Iowa | Johnson County | 2 | Midwest Region | 4 | West North Central Division | 7385 | 2944 | 2849 | 5589 | 7043 | 79.35539 | 0.9981 | 1 | 572 | 5172 | 11.059551 | 0.8686 | 1 | 39 | 167 | 23.353293 | 0.548100 | 0 | 2168 | 2682 | 80.83520 | 0.9904 | 1 | 2207 | 2849 | 77.46578 | 0.9990 | 1 | 22 | 1443 | 1.524601 | 0.04067 | 0 | 698 | 7281 | 9.586595 | 0.4788 | 0 | 129 | 1.746784 | 0.010070 | 0 | 114 | 1.543670 | 0.00475 | 0 | 415 | 6925 | 5.992780 | 0.046600 | 0 | 28 | 258 | 10.852713 | 0.402700 | 0 | 43 | 7363 | 0.5840011 | 0.5225 | 0 | 959 | 7385 | 12.985782 | 0.6084 | 0 | 2944 | 1513 | 51.392663 | 0.97470 | 1 | 0 | 0.0000000 | 0.1716 | 0 | 0 | 2849 | 0.000000 | 0.1372 | 0 | 440 | 2849 | 15.444015 | 0.9081 | 1 | 443 | 7385 | 5.998646 | 0.8803 | 1 | 3.38517 | 0.7597 | 3 | 0.986620 | 0.008515 | 0 | 0.6084 | 0.6059 | 0 | 3.07190 | 0.76520 | 3 | 8.052090 | 0.5296 | 6 | 8611 | 4188 | 3649 | 6422 | 8273 | 77.62601 | 0.9981 | 1 | 315 | 5963 | 5.282576 | 0.7381 | 0 | 41 | 281 | 14.590747 | 0.356000 | 0 | 2354 | 3368 | 69.89311 | 0.9821 | 1 | 2395 | 3649 | 65.63442 | 0.9983 | 1 | 92 | 1851 | 4.9702863 | 0.32870 | 0 | 373 | 8611 | 4.331669 | 0.3477 | 0 | 170 | 1.974219 | 0.007406 | 0 | 228 | 2.647776 | 0.006836 | 0 | 566 | 8077.000 | 7.007552 | 0.053030 | 0 | 72 | 362.0000 | 19.889503 | 0.732900 | 0 | 60 | 8483 | 0.7072969 | 0.5794 | 0 | 1324 | 8611.000 | 15.375682 | 0.5471 | 0 | 4188 | 1998 | 47.70774 | 0.9646 | 1 | 0 | 0.000000 | 0.1738 | 0 | 0 | 3649 | 0.0000000 | 0.09916 | 0 | 558 | 3649.00 | 15.291861 | 0.9116 | 1 | 306 | 8611 | 3.5535942 | 0.8293 | 1 | 3.41090 | 0.7695 | 2 | 1.379572 | 0.0410600 | 0 | 0.5471 | 0.5451 | 0 | 2.97846 | 0.7061 | 3 | 8.316032 | 0.5637 | 5 | 0 | 0 | 1 | 475339 | 1 | Yes | Census Tract 16, Johnson County, Iowa | 6199 | 177500 | 7890 | 196200 | 7190.84 | 205900 | 699.16 | 0.0972293 | -9700 | -0.0471102 | NA | NA | Johnson County, Iowa | Iowa City, IA MSA | C2698 |
| 19153004800 | 19153 | 004800 | IA | Iowa | Polk County | 2 | Midwest Region | 4 | West North Central Division | 2896 | 1176 | 1038 | 1821 | 2828 | 64.39180 | 0.9854 | 1 | 87 | 1318 | 6.600911 | 0.6230 | 0 | 122 | 406 | 30.049261 | 0.803600 | 1 | 366 | 632 | 57.91139 | 0.8784 | 1 | 488 | 1038 | 47.01349 | 0.9370 | 1 | 576 | 1539 | 37.426901 | 0.98710 | 1 | 674 | 2960 | 22.770270 | 0.9281 | 1 | 118 | 4.074586 | 0.039520 | 0 | 1112 | 38.397790 | 0.98560 | 1 | 398 | 1820 | 21.868132 | 0.870900 | 1 | 306 | 641 | 47.737910 | 0.976600 | 1 | 324 | 2622 | 12.3569794 | 0.9740 | 1 | 2000 | 2896 | 69.060773 | 0.9500 | 1 | 1176 | 157 | 13.350340 | 0.76360 | 1 | 12 | 1.0204082 | 0.4431 | 0 | 67 | 1038 | 6.454721 | 0.9534 | 1 | 160 | 1038 | 15.414258 | 0.9076 | 1 | 57 | 2896 | 1.968232 | 0.7277 | 0 | 4.46060 | 0.9406 | 4 | 3.846620 | 0.975800 | 4 | 0.9500 | 0.9461 | 1 | 3.79540 | 0.96270 | 3 | 13.052620 | 0.9885 | 12 | 2703 | 1008 | 932 | 1211 | 2641 | 45.85384 | 0.9428 | 1 | 103 | 1313 | 7.844631 | 0.8858 | 1 | 85 | 469 | 18.123667 | 0.601900 | 0 | 190 | 463 | 41.03672 | 0.6188 | 0 | 275 | 932 | 29.50644 | 0.7625 | 1 | 303 | 1431 | 21.1740042 | 0.93830 | 1 | 480 | 2644 | 18.154312 | 0.9409 | 1 | 319 | 11.801702 | 0.215000 | 0 | 904 | 33.444321 | 0.962600 | 1 | 359 | 1740.000 | 20.632184 | 0.806700 | 1 | 272 | 587.0000 | 46.337308 | 0.979800 | 1 | 329 | 2404 | 13.6855241 | 0.9827 | 1 | 2002 | 2703.000 | 74.065853 | 0.9518 | 1 | 1008 | 144 | 14.28571 | 0.7571 | 1 | 0 | 0.000000 | 0.1738 | 0 | 29 | 932 | 3.1115880 | 0.79540 | 1 | 148 | 932.00 | 15.879828 | 0.9183 | 1 | 82 | 2703 | 3.0336663 | 0.7928 | 1 | 4.47030 | 0.9546 | 5 | 3.946800 | 0.9873000 | 4 | 0.9518 | 0.9483 | 1 | 3.43740 | 0.8850 | 4 | 12.806300 | 0.9852 | 14 | 0 | 0 | 0 | 0 | 0 | Yes | Census Tract 48, Polk County, Iowa | 16847 | 76000 | 20716 | 84200 | 19542.52 | 88160 | 1173.48 | 0.0600475 | -3960 | -0.0449183 | 98.94 | 160.82 | Polk County, Iowa | Des Moines-Newton-Pella, IA CSA | CS218 |
| 19163010700 | 19163 | 010700 | IA | Iowa | Scott County | 2 | Midwest Region | 4 | West North Central Division | 1513 | 796 | 622 | 1192 | 1513 | 78.78387 | 0.9975 | 1 | 159 | 633 | 25.118483 | 0.9878 | 1 | 109 | 228 | 47.807018 | 0.984200 | 1 | 223 | 394 | 56.59898 | 0.8612 | 1 | 332 | 622 | 53.37621 | 0.9762 | 1 | 293 | 808 | 36.262376 | 0.98520 | 1 | 334 | 1393 | 23.977028 | 0.9409 | 1 | 30 | 1.982816 | 0.011780 | 0 | 540 | 35.690681 | 0.97040 | 1 | 205 | 1043 | 19.654842 | 0.800300 | 1 | 167 | 317 | 52.681388 | 0.984600 | 1 | 43 | 1337 | 3.2161556 | 0.8603 | 1 | 950 | 1513 | 62.789161 | 0.9382 | 1 | 796 | 97 | 12.185930 | 0.74550 | 0 | 0 | 0.0000000 | 0.1716 | 0 | 0 | 622 | 0.000000 | 0.1372 | 0 | 194 | 622 | 31.189711 | 0.9802 | 1 | 0 | 1513 | 0.000000 | 0.3161 | 0 | 4.88760 | 0.9928 | 5 | 3.627380 | 0.945300 | 4 | 0.9382 | 0.9343 | 1 | 2.35060 | 0.41000 | 1 | 11.803780 | 0.9359 | 11 | 1273 | 725 | 529 | 596 | 1231 | 48.41592 | 0.9536 | 1 | 24 | 537 | 4.469274 | 0.6548 | 0 | 98 | 221 | 44.343891 | 0.994900 | 1 | 232 | 308 | 75.32468 | 0.9909 | 1 | 330 | 529 | 62.38185 | 0.9970 | 1 | 131 | 870 | 15.0574713 | 0.85280 | 1 | 44 | 1273 | 3.456402 | 0.2558 | 0 | 163 | 12.804399 | 0.260900 | 0 | 286 | 22.466614 | 0.454600 | 0 | 161 | 979.000 | 16.445352 | 0.601000 | 0 | 74 | 310.0000 | 23.870968 | 0.818100 | 1 | 44 | 1176 | 3.7414966 | 0.8794 | 1 | 623 | 1273.000 | 48.939513 | 0.8918 | 1 | 725 | 58 | 8.00000 | 0.6260 | 0 | 12 | 1.655172 | 0.5183 | 0 | 6 | 529 | 1.1342155 | 0.48850 | 0 | 137 | 529.00 | 25.897921 | 0.9736 | 1 | 89 | 1273 | 6.9913590 | 0.9214 | 1 | 3.71400 | 0.8363 | 3 | 3.014000 | 0.7732000 | 2 | 0.8918 | 0.8886 | 1 | 3.52780 | 0.9113 | 2 | 11.147600 | 0.9019 | 8 | 0 | 0 | 0 | 0 | 0 | Yes | Census Tract 107, Scott County, Iowa | 11169 | 90900 | 21215 | NA | 12956.04 | 105444 | 8258.96 | 0.6374602 | NA | NA | NA | NA | Scott County, Iowa | Davenport-Moline-Rock Island, IA-IL MSA | C1934 |
| 19163011400 | 19163 | 011400 | IA | Iowa | Scott County | 2 | Midwest Region | 4 | West North Central Division | 2513 | 1288 | 1003 | 1462 | 2505 | 58.36327 | 0.9724 | 1 | 101 | 1206 | 8.374793 | 0.7603 | 1 | 131 | 413 | 31.719128 | 0.849400 | 1 | 417 | 590 | 70.67797 | 0.9679 | 1 | 548 | 1003 | 54.63609 | 0.9793 | 1 | 302 | 1377 | 21.931736 | 0.89430 | 1 | 541 | 2568 | 21.066978 | 0.9040 | 1 | 107 | 4.257859 | 0.042940 | 0 | 769 | 30.600875 | 0.88500 | 1 | 253 | 1820 | 13.901099 | 0.454200 | 0 | 262 | 575 | 45.565217 | 0.971800 | 1 | 47 | 2159 | 2.1769338 | 0.8016 | 1 | 1201 | 2513 | 47.791484 | 0.9109 | 1 | 1288 | 36 | 2.795031 | 0.45680 | 0 | 0 | 0.0000000 | 0.1716 | 0 | 10 | 1003 | 0.997009 | 0.5118 | 0 | 131 | 1003 | 13.060818 | 0.8760 | 1 | 0 | 2513 | 0.000000 | 0.3161 | 0 | 4.51030 | 0.9487 | 5 | 3.155540 | 0.821400 | 3 | 0.9109 | 0.9071 | 1 | 2.33230 | 0.40260 | 1 | 10.909040 | 0.8657 | 10 | 2022 | 1140 | 820 | 617 | 1899 | 32.49078 | 0.8325 | 1 | 37 | 988 | 3.744939 | 0.5548 | 0 | 62 | 367 | 16.893733 | 0.513600 | 0 | 145 | 453 | 32.00883 | 0.3978 | 0 | 207 | 820 | 25.24390 | 0.6315 | 0 | 155 | 1274 | 12.1664050 | 0.78200 | 1 | 80 | 1937 | 4.130098 | 0.3254 | 0 | 279 | 13.798220 | 0.317100 | 0 | 473 | 23.392681 | 0.531100 | 0 | 220 | 1452.000 | 15.151515 | 0.506900 | 0 | 127 | 401.0000 | 31.670823 | 0.913300 | 1 | 12 | 1890 | 0.6349206 | 0.5560 | 0 | 1039 | 2022.000 | 51.384768 | 0.8997 | 1 | 1140 | 0 | 0.00000 | 0.0847 | 0 | 0 | 0.000000 | 0.1738 | 0 | 0 | 820 | 0.0000000 | 0.09916 | 0 | 40 | 820.00 | 4.878049 | 0.5463 | 0 | 89 | 2022 | 4.4015826 | 0.8701 | 1 | 3.12620 | 0.6993 | 2 | 2.824400 | 0.6805000 | 1 | 0.8997 | 0.8965 | 1 | 1.77406 | 0.1854 | 1 | 8.624360 | 0.6091 | 5 | 0 | 0 | 0 | 0 | 0 | Yes | Census Tract 114, Scott County, Iowa | 17891 | 85500 | 22784 | 81000 | 20753.56 | 99180 | 2030.44 | 0.0978357 | -18180 | -0.1833031 | 103.13 | 115.20 | Scott County, Iowa | Davenport-Moline-Rock Island, IA-IL MSA | C1934 |
| 19169000500 | 19169 | 000500 | IA | Iowa | Story County | 2 | Midwest Region | 4 | West North Central Division | 2099 | 888 | 788 | 1339 | 2099 | 63.79228 | 0.9844 | 1 | 80 | 1250 | 6.400000 | 0.6042 | 0 | 0 | 0 | NaN | NA | NA | 391 | 788 | 49.61929 | 0.7537 | 1 | 391 | 788 | 49.61929 | 0.9580 | 1 | 12 | 494 | 2.429150 | 0.07516 | 0 | 320 | 2322 | 13.781223 | 0.7037 | 0 | 0 | 0.000000 | 0.002565 | 0 | 283 | 13.482611 | 0.04047 | 0 | 64 | 2078 | 3.079884 | 0.006276 | 0 | 56 | 246 | 22.764228 | 0.802300 | 1 | 52 | 1961 | 2.6517083 | 0.8326 | 1 | 765 | 2099 | 36.445927 | 0.8714 | 1 | 888 | 194 | 21.846847 | 0.86250 | 1 | 0 | 0.0000000 | 0.1716 | 0 | 92 | 788 | 11.675127 | 0.9854 | 1 | 67 | 788 | 8.502538 | 0.7587 | 1 | 0 | 2099 | 0.000000 | 0.3161 | 0 | 3.32546 | 0.7472 | 2 | 1.684211 | 0.103700 | 2 | 0.8714 | 0.8677 | 1 | 3.09430 | 0.77500 | 3 | 8.975371 | 0.6592 | 8 | 4073 | 865 | 776 | 1315 | 1775 | 74.08451 | 0.9977 | 1 | 95 | 2236 | 4.248658 | 0.6305 | 0 | 0 | 6 | 0.000000 | 0.001239 | 0 | 433 | 770 | 56.23377 | 0.8983 | 1 | 433 | 776 | 55.79897 | 0.9914 | 1 | 10 | 498 | 2.0080321 | 0.09533 | 0 | 152 | 4073 | 3.731893 | 0.2798 | 0 | 0 | 0.000000 | 0.001804 | 0 | 69 | 1.694083 | 0.004937 | 0 | 78 | 1710.000 | 4.561403 | 0.011020 | 0 | 4 | 143.0000 | 2.797203 | 0.031010 | 0 | 60 | 4032 | 1.4880952 | 0.7264 | 0 | 901 | 4073.000 | 22.121287 | 0.6861 | 0 | 865 | 129 | 14.91329 | 0.7669 | 1 | 56 | 6.473988 | 0.7549 | 1 | 0 | 776 | 0.0000000 | 0.09916 | 0 | 141 | 776.00 | 18.170103 | 0.9390 | 1 | 2298 | 4073 | 56.4203290 | 0.9953 | 1 | 2.99473 | 0.6634 | 2 | 0.775171 | 0.0047300 | 0 | 0.6861 | 0.6836 | 0 | 3.55526 | 0.9164 | 4 | 8.011261 | 0.5073 | 6 | 0 | 0 | 0 | 0 | 0 | Yes | Census Tract 5, Story County, Iowa | 9006 | NA | 5699 | NA | 10446.96 | NA | -4747.96 | -0.4544825 | NA | NA | NA | NA | Story County, Iowa | Ames-Boone, IA CSA | CS112 |
| 19169000700 | 19169 | 000700 | IA | Iowa | Story County | 2 | Midwest Region | 4 | West North Central Division | 3638 | 1665 | 1655 | 2272 | 3568 | 63.67713 | 0.9838 | 1 | 128 | 2453 | 5.218100 | 0.4694 | 0 | 90 | 330 | 27.272727 | 0.719500 | 0 | 978 | 1325 | 73.81132 | 0.9776 | 1 | 1068 | 1655 | 64.53172 | 0.9952 | 1 | 25 | 889 | 2.812149 | 0.09141 | 0 | 346 | 3647 | 9.487250 | 0.4725 | 0 | 146 | 4.013194 | 0.038380 | 0 | 262 | 7.201759 | 0.01520 | 0 | 58 | 3374 | 1.719028 | 0.002092 | 0 | 46 | 296 | 15.540541 | 0.622000 | 0 | 46 | 3550 | 1.2957746 | 0.7099 | 0 | 545 | 3638 | 14.980759 | 0.6555 | 0 | 1665 | 675 | 40.540540 | 0.95340 | 1 | 0 | 0.0000000 | 0.1716 | 0 | 31 | 1655 | 1.873112 | 0.6972 | 0 | 187 | 1655 | 11.299094 | 0.8412 | 1 | 70 | 3638 | 1.924134 | 0.7245 | 0 | 3.01231 | 0.6721 | 2 | 1.387572 | 0.037840 | 0 | 0.6555 | 0.6528 | 0 | 3.38790 | 0.88780 | 2 | 8.443282 | 0.5883 | 4 | 3747 | 2013 | 1841 | 2350 | 3713 | 63.29114 | 0.9909 | 1 | 240 | 2447 | 9.807928 | 0.9358 | 1 | 22 | 221 | 9.954751 | 0.098470 | 0 | 1185 | 1620 | 73.14815 | 0.9884 | 1 | 1207 | 1841 | 65.56219 | 0.9981 | 1 | 9 | 1137 | 0.7915567 | 0.02621 | 0 | 618 | 3743 | 16.510820 | 0.9192 | 1 | 115 | 3.069122 | 0.010250 | 0 | 107 | 2.855618 | 0.007026 | 0 | 125 | 3602.000 | 3.470294 | 0.004372 | 0 | 6 | 225.0000 | 2.666667 | 0.028720 | 0 | 52 | 3698 | 1.4061655 | 0.7159 | 0 | 1169 | 3747.000 | 31.198292 | 0.7957 | 1 | 2013 | 955 | 47.44163 | 0.9644 | 1 | 0 | 0.000000 | 0.1738 | 0 | 47 | 1841 | 2.5529603 | 0.73380 | 0 | 274 | 1841.00 | 14.883216 | 0.9065 | 1 | 34 | 3747 | 0.9073926 | 0.5431 | 0 | 3.87021 | 0.8632 | 4 | 0.766268 | 0.0041630 | 0 | 0.7957 | 0.7928 | 1 | 3.32160 | 0.8482 | 2 | 8.753778 | 0.6259 | 7 | 0 | 0 | 0 | 0 | 0 | Yes | Census Tract 7, Story County, Iowa | 10427 | 189100 | 12207 | 218900 | 12095.32 | 219356 | 111.68 | 0.0092333 | -456 | -0.0020788 | 176.75 | 217.09 | Story County, Iowa | Ames-Boone, IA CSA | CS112 |
| 19169001100 | 19169 | 001100 | IA | Iowa | Story County | 2 | Midwest Region | 4 | West North Central Division | 6708 | 1985 | 1913 | 2897 | 4395 | 65.91581 | 0.9878 | 1 | 320 | 3946 | 8.109478 | 0.7397 | 0 | 18 | 417 | 4.316547 | 0.003818 | 0 | 1170 | 1496 | 78.20856 | 0.9855 | 1 | 1188 | 1913 | 62.10141 | 0.9939 | 1 | 41 | 1298 | 3.158706 | 0.10790 | 0 | 393 | 5953 | 6.601713 | 0.2634 | 0 | 261 | 3.890877 | 0.034580 | 0 | 202 | 3.011330 | 0.00627 | 0 | 210 | 3904 | 5.379098 | 0.032900 | 0 | 22 | 424 | 5.188679 | 0.094580 | 0 | 41 | 6589 | 0.6222492 | 0.5364 | 0 | 544 | 6708 | 8.109720 | 0.4469 | 0 | 1985 | 952 | 47.959698 | 0.97030 | 1 | 0 | 0.0000000 | 0.1716 | 0 | 25 | 1913 | 1.306848 | 0.5927 | 0 | 172 | 1913 | 8.991113 | 0.7748 | 1 | 2313 | 6708 | 34.481217 | 0.9875 | 1 | 3.09270 | 0.6918 | 2 | 0.704730 | 0.003595 | 0 | 0.4469 | 0.4450 | 0 | 3.49690 | 0.91410 | 3 | 7.741230 | 0.4789 | 5 | 6579 | 2147 | 1823 | 3075 | 4627 | 66.45775 | 0.9939 | 1 | 251 | 3663 | 6.852307 | 0.8457 | 1 | 26 | 292 | 8.904110 | 0.067490 | 0 | 926 | 1531 | 60.48334 | 0.9381 | 1 | 952 | 1823 | 52.22161 | 0.9857 | 1 | 49 | 1120 | 4.3750000 | 0.27690 | 0 | 158 | 6577 | 2.402311 | 0.1466 | 0 | 163 | 2.477580 | 0.008925 | 0 | 240 | 3.647971 | 0.008925 | 0 | 260 | 4411.000 | 5.894355 | 0.026610 | 0 | 0 | 412.0000 | 0.000000 | 0.003424 | 0 | 0 | 6515 | 0.0000000 | 0.1327 | 0 | 652 | 6579.000 | 9.910321 | 0.3855 | 0 | 2147 | 1321 | 61.52771 | 0.9821 | 1 | 43 | 2.002795 | 0.5435 | 0 | 0 | 1823 | 0.0000000 | 0.09916 | 0 | 185 | 1823.00 | 10.148108 | 0.8230 | 1 | 1952 | 6579 | 29.6701626 | 0.9858 | 1 | 3.24880 | 0.7311 | 3 | 0.180584 | 0.0007569 | 0 | 0.3855 | 0.3841 | 0 | 3.43356 | 0.8836 | 3 | 7.248444 | 0.3843 | 6 | 0 | 0 | 0 | 0 | 0 | Yes | Census Tract 11, Story County, Iowa | 7859 | 224400 | 9321 | 248400 | 9116.44 | 260304 | 204.56 | 0.0224386 | -11904 | -0.0457311 | NA | NA | Story County, Iowa | Ames-Boone, IA CSA | CS112 |
svi_national_lihtc_df0 <- left_join(svi_national_lihtc, census_pull_df, join_by("GEOID_2010_trt" == "GEOID"))

svi_national_lihtc_df1 <- left_join(svi_national_lihtc_df0, hpi_df_10_20, join_by("GEOID_2010_trt" == "GEOID10")) %>%
                          unite("county_fips", FIPS_st, FIPS_county, sep = "")

svi_national_lihtc_df <- left_join(svi_national_lihtc_df1, msa_csa_crosswalk, join_by("county_fips" == "county_fips"))

svi_national_lihtc_df %>% head(10) %>% kbl() %>% kable_styling() %>% scroll_box(width = "100%")
| GEOID_2010_trt | county_fips | FIPS_tract | state | state_name | county | region_number | region | division_number | division | E_TOTPOP_10 | E_HU_10 | E_HH_10 | E_POV150_10 | ET_POVSTATUS_10 | EP_POV150_10 | EPL_POV150_10 | F_POV150_10 | E_UNEMP_10 | ET_EMPSTATUS_10 | EP_UNEMP_10 | EPL_UNEMP_10 | F_UNEMP_10 | E_HBURD_OWN_10 | ET_HOUSINGCOST_OWN_10 | EP_HBURD_OWN_10 | EPL_HBURD_OWN_10 | F_HBURD_OWN_10 | E_HBURD_RENT_10 | ET_HOUSINGCOST_RENT_10 | EP_HBURD_RENT_10 | EPL_HBURD_RENT_10 | F_HBURD_RENT_10 | E_HBURD_10 | ET_HOUSINGCOST_10 | EP_HBURD_10 | EPL_HBURD_10 | F_HBURD_10 | E_NOHSDP_10 | ET_EDSTATUS_10 | EP_NOHSDP_10 | EPL_NOHSDP_10 | F_NOHSDP_10 | E_UNINSUR_12 | ET_INSURSTATUS_12 | EP_UNINSUR_12 | EPL_UNINSUR_12 | F_UNINSUR_12 | E_AGE65_10 | EP_AGE65_10 | EPL_AGE65_10 | F_AGE65_10 | E_AGE17_10 | EP_AGE17_10 | EPL_AGE17_10 | F_AGE17_10 | E_DISABL_12 | ET_DISABLSTATUS_12 | EP_DISABL_12 | EPL_DISABL_12 | F_DISABL_12 | E_SNGPNT_10 | ET_FAMILIES_10 | EP_SNGPNT_10 | EPL_SNGPNT_10 | F_SNGPNT_10 | E_LIMENG_10 | ET_POPAGE5UP_10 | EP_LIMENG_10 | EPL_LIMENG_10 | F_LIMENG_10 | E_MINRTY_10 | ET_POPETHRACE_10 | EP_MINRTY_10 | EPL_MINRTY_10 | F_MINRTY_10 | E_STRHU_10 | E_MUNIT_10 | EP_MUNIT_10 | EPL_MUNIT_10 | F_MUNIT_10 | E_MOBILE_10 | EP_MOBILE_10 | EPL_MOBILE_10 | F_MOBILE_10 | E_CROWD_10 | ET_OCCUPANTS_10 | EP_CROWD_10 | EPL_CROWD_10 | F_CROWD_10 | E_NOVEH_10 | ET_KNOWNVEH_10 | EP_NOVEH_10 | EPL_NOVEH_10 | F_NOVEH_10 | E_GROUPQ_10 | ET_HHTYPE_10 | EP_GROUPQ_10 | EPL_GROUPQ_10 | F_GROUPQ_10 | SPL_THEME1_10 | RPL_THEME1_10 | F_THEME1_10 | SPL_THEME2_10 | RPL_THEME2_10 | F_THEME2_10 | SPL_THEME3_10 | RPL_THEME3_10 | F_THEME3_10 | SPL_THEME4_10 | RPL_THEME4_10 | F_THEME4_10 | SPL_THEMES_10 | RPL_THEMES_10 | F_TOTAL_10 | E_TOTPOP_20 | E_HU_20 | E_HH_20 | E_POV150_20 | ET_POVSTATUS_20 | EP_POV150_20 | EPL_POV150_20 | F_POV150_20 | E_UNEMP_20 | ET_EMPSTATUS_20 | EP_UNEMP_20 | EPL_UNEMP_20 | F_UNEMP_20 | E_HBURD_OWN_20 | ET_HOUSINGCOST_OWN_20 | EP_HBURD_OWN_20 | EPL_HBURD_OWN_20 | F_HBURD_OWN_20 | E_HBURD_RENT_20 | ET_HOUSINGCOST_RENT_20 | EP_HBURD_RENT_20 | EPL_HBURD_RENT_20 | F_HBURD_RENT_20 | E_HBURD_20 | ET_HOUSINGCOST_20 | EP_HBURD_20 | EPL_HBURD_20 | F_HBURD_20 | E_NOHSDP_20 | ET_EDSTATUS_20 | EP_NOHSDP_20 | EPL_NOHSDP_20 | F_NOHSDP_20 | E_UNINSUR_20 | ET_INSURSTATUS_20 | EP_UNINSUR_20 | EPL_UNINSUR_20 | F_UNINSUR_20 | E_AGE65_20 | EP_AGE65_20 | EPL_AGE65_20 | F_AGE65_20 | E_AGE17_20 | EP_AGE17_20 | EPL_AGE17_20 | F_AGE17_20 | E_DISABL_20 | ET_DISABLSTATUS_20 | EP_DISABL_20 | EPL_DISABL_20 | F_DISABL_20 | E_SNGPNT_20 | ET_FAMILIES_20 | EP_SNGPNT_20 | EPL_SNGPNT_20 | F_SNGPNT_20 | E_LIMENG_20 | ET_POPAGE5UP_20 | EP_LIMENG_20 | EPL_LIMENG_20 | F_LIMENG_20 | E_MINRTY_20 | ET_POPETHRACE_20 | EP_MINRTY_20 | EPL_MINRTY_20 | F_MINRTY_20 | E_STRHU_20 | E_MUNIT_20 | EP_MUNIT_20 | EPL_MUNIT_20 | F_MUNIT_20 | E_MOBILE_20 | EP_MOBILE_20 | EPL_MOBILE_20 | F_MOBILE_20 | E_CROWD_20 | ET_OCCUPANTS_20 | EP_CROWD_20 | EPL_CROWD_20 | F_CROWD_20 | E_NOVEH_20 | ET_KNOWNVEH_20 | EP_NOVEH_20 | EPL_NOVEH_20 | F_NOVEH_20 | E_GROUPQ_20 | ET_HHTYPE_20 | EP_GROUPQ_20 | EPL_GROUPQ_20 | F_GROUPQ_20 | SPL_THEME1_20 | RPL_THEME1_20 | F_THEME1_20 | SPL_THEME2_20 | RPL_THEME2_20 | F_THEME2_20 | SPL_THEME3_20 | RPL_THEME3_20 | F_THEME3_20 | SPL_THEME4_20 | RPL_THEME4_20 | F_THEME4_20 | SPL_THEMES_20 | RPL_THEMES_20 | F_TOTAL_20 | pre10_lihtc_project_cnt | pre10_lihtc_project_dollars | post10_lihtc_project_cnt | post10_lihtc_project_dollars | lihtc_flag | lihtc_eligibility | NAME | Median_Income_10 | Median_Home_Value_10 | Median_Income_19 | Median_Home_Value_19 | Median_Income_10adj | Median_Home_Value_10adj | Median_Income_Change | Median_Income_Change_pct | Median_Home_Value_Change | Median_Home_Value_Change_pct | housing_price_index10 | housing_price_index20 | county_title | cbsa | cbsa_code |
|---|---|---|---|---|---|---|---|---|---|---|---|---|---|---|---|---|---|---|---|---|---|---|---|---|---|---|---|---|---|---|---|---|---|---|---|---|---|---|---|---|---|---|---|---|---|---|---|---|---|---|---|---|---|---|---|---|---|---|---|---|---|---|---|---|---|---|---|---|---|---|---|---|---|---|---|---|---|---|---|---|---|---|---|---|---|---|---|---|---|---|---|---|---|---|---|---|---|---|---|---|---|---|---|---|---|---|---|---|---|---|---|---|---|---|---|---|---|---|---|---|---|---|---|---|---|---|---|---|---|---|---|---|---|---|---|---|---|---|---|---|---|---|---|---|---|---|---|---|---|---|---|---|---|---|---|---|---|---|---|---|---|---|---|---|---|---|---|---|---|---|---|---|---|---|---|---|---|---|---|---|---|---|---|---|---|---|---|---|---|---|---|---|---|---|---|---|---|---|---|---|---|---|---|---|---|---|---|---|---|---|---|---|---|---|---|---|---|---|---|---|---|---|---|---|---|---|---|---|---|---|---|---|---|---|---|---|---|---|---|---|---|
| 01005950700 | 01005 | 950700 | AL | Alabama | Barbour County | 3 | South Region | 6 | East South Central Division | 1753 | 687 | 563 | 615 | 1628 | 37.77641 | 0.8088 | 1 | 17 | 667 | 2.548726 | 0.06941 | 0 | 41 | 376 | 10.90426 | 0.01945 | 0 | 62 | 187 | 33.15508 | 0.24640 | 0 | 103 | 563 | 18.29485 | 0.04875 | 0 | 264 | 1208 | 21.85430 | 0.7570 | 1 | 201 | 1527 | 13.163065 | 0.4991 | 0 | 368 | 20.992584 | 0.89510 | 1 | 462 | 26.354820 | 0.66130 | 0 | 211 | 1085 | 19.44700 | 0.7505 | 1 | 107 | 399 | 26.81704 | 0.8048 | 1 | 0 | 1628 | 0.0000000 | 0.09298 | 0 | 861 | 1753 | 49.11580 | 0.7101 | 0 | 687 | 17 | 2.4745269 | 0.4324 | 0 | 38 | 5.5312955 | 0.6970 | 0 | 3 | 563 | 0.5328597 | 0.3037 | 0 | 19 | 563 | 3.374778 | 0.3529 | 0 | 233 | 1753 | 13.29150 | 0.9517 | 1 | 2.18306 | 0.4137 | 2 | 3.20468 | 0.8377 | 3 | 0.7101 | 0.7035 | 0 | 2.7377 | 0.6100 | 1 | 8.83554 | 0.6264 | 6 | 1527 | 691 | 595 | 565 | 1365 | 41.39194 | 0.8765 | 1 | 37 | 572 | 6.468532 | 0.6776 | 0 | 70 | 376 | 18.617021 | 0.38590 | 0 | 92 | 219 | 42.009132 | 0.47360 | 0 | 162 | 595 | 27.22689 | 0.44540 | 0 | 280 | 1114 | 25.13465 | 0.8942 | 1 | 105 | 1378 | 7.619739 | 0.5505 | 0 | 383 | 25.081860 | 0.88450 | 1 | 337 | 22.069417 | 0.51380 | 0 | 237 | 1041.0000 | 22.76657 | 0.8360 | 1 | 144 | 413.0000 | 34.86683 | 0.9114 | 1 | 11 | 1466 | 0.7503411 | 0.40700 | 0 | 711 | 1527.0000 | 46.56189 | 0.6441 | 0 | 691 | 13 | 1.8813314 | 0.3740 | 0 | 37 | 5.3545586 | 0.7152 | 0 | 0 | 595 | 0.0000000 | 0.09796 | 0 | 115 | 595.0000 | 19.327731 | 0.8859 | 1 | 149 | 1527 | 9.7576948 | 0.9470 | 1 | 3.44420 | 0.7707 | 2 | 3.55270 | 0.9403 | 3 | 0.6441 | 0.6387 | 0 | 3.02006 | 0.7337 | 2 | 10.66106 | 0.8537 | 7 | 0 | 0 | 0 | 0 | 0 | Yes | Census Tract 9507, Barbour County, Alabama | 15257 | 133700 | 17244 | 137500 | 17698.12 | 155092 | -454.12 | -0.0256592 | -17592 | -0.1134294 | 131.05 | 135.61 | Barbour County, Alabama | Eufaula, AL-GA MicroSA | C2164 |
| 01011952100 | 01011 | 952100 | AL | Alabama | Bullock County | 3 | South Region | 6 | East South Central Division | 1652 | 796 | 554 | 564 | 1652 | 34.14044 | 0.7613 | 1 | 46 | 816 | 5.637255 | 0.33630 | 0 | 96 | 458 | 20.96070 | 0.19930 | 0 | 62 | 96 | 64.58333 | 0.89170 | 1 | 158 | 554 | 28.51986 | 0.29220 | 0 | 271 | 1076 | 25.18587 | 0.8163 | 1 | 155 | 1663 | 9.320505 | 0.3183 | 0 | 199 | 12.046005 | 0.47180 | 0 | 420 | 25.423729 | 0.60240 | 0 | 327 | 1279 | 25.56685 | 0.9151 | 1 | 137 | 375 | 36.53333 | 0.9108 | 1 | 0 | 1590 | 0.0000000 | 0.09298 | 0 | 1428 | 1652 | 86.44068 | 0.8939 | 1 | 796 | 0 | 0.0000000 | 0.1224 | 0 | 384 | 48.2412060 | 0.9897 | 1 | 19 | 554 | 3.4296029 | 0.7145 | 0 | 45 | 554 | 8.122744 | 0.6556 | 0 | 0 | 1652 | 0.00000 | 0.3640 | 0 | 2.52440 | 0.5138 | 2 | 2.99308 | 0.7515 | 2 | 0.8939 | 0.8856 | 1 | 2.8462 | 0.6637 | 1 | 9.25758 | 0.6790 | 6 | 1382 | 748 | 549 | 742 | 1382 | 53.69030 | 0.9560 | 1 | 40 | 511 | 7.827789 | 0.7730 | 1 | 110 | 402 | 27.363184 | 0.71780 | 0 | 45 | 147 | 30.612245 | 0.23070 | 0 | 155 | 549 | 28.23315 | 0.47730 | 0 | 181 | 905 | 20.00000 | 0.8253 | 1 | 232 | 1382 | 16.787265 | 0.8813 | 1 | 164 | 11.866860 | 0.27170 | 0 | 250 | 18.089725 | 0.26290 | 0 | 258 | 1132.0000 | 22.79152 | 0.8368 | 1 | 99 | 279.0000 | 35.48387 | 0.9162 | 1 | 33 | 1275 | 2.5882353 | 0.64520 | 0 | 1347 | 1382.0000 | 97.46744 | 0.9681 | 1 | 748 | 0 | 0.0000000 | 0.1079 | 0 | 375 | 50.1336898 | 0.9922 | 1 | 0 | 549 | 0.0000000 | 0.09796 | 0 | 37 | 549.0000 | 6.739526 | 0.6039 | 0 | 0 | 1382 | 0.0000000 | 0.1831 | 0 | 3.91290 | 0.8785 | 4 | 2.93280 | 0.7342 | 2 | 0.9681 | 0.9599 | 1 | 1.98506 | 0.2471 | 1 | 9.79886 | 0.7570 | 8 | 0 | 0 | 0 | 0 | 0 | Yes | Census Tract 9521, Bullock County, Alabama | 19754 | 58200 | 18598 | 66900 | 22914.64 | 67512 | -4316.64 | -0.1883791 | -612 | -0.0090651 | NA | NA | NA | NA | NA |
| 01015000300 | 01015 | 000300 | AL | Alabama | Calhoun County | 3 | South Region | 6 | East South Central Division | 3074 | 1635 | 1330 | 1904 | 3067 | 62.08021 | 0.9710 | 1 | 293 | 1362 | 21.512482 | 0.96630 | 1 | 180 | 513 | 35.08772 | 0.65450 | 0 | 383 | 817 | 46.87882 | 0.55040 | 0 | 563 | 1330 | 42.33083 | 0.70280 | 0 | 720 | 2127 | 33.85049 | 0.9148 | 1 | 628 | 2835 | 22.151675 | 0.8076 | 1 | 380 | 12.361744 | 0.49340 | 0 | 713 | 23.194535 | 0.45030 | 0 | 647 | 2111 | 30.64898 | 0.9708 | 1 | 298 | 773 | 38.55110 | 0.9247 | 1 | 0 | 2878 | 0.0000000 | 0.09298 | 0 | 2623 | 3074 | 85.32856 | 0.8883 | 1 | 1635 | 148 | 9.0519878 | 0.6465 | 0 | 6 | 0.3669725 | 0.4502 | 0 | 68 | 1330 | 5.1127820 | 0.8082 | 1 | 303 | 1330 | 22.781955 | 0.9029 | 1 | 0 | 3074 | 0.00000 | 0.3640 | 0 | 4.36250 | 0.9430 | 4 | 2.93218 | 0.7233 | 2 | 0.8883 | 0.8800 | 1 | 3.1718 | 0.8070 | 2 | 11.35478 | 0.9009 | 9 | 2390 | 1702 | 1282 | 1287 | 2390 | 53.84937 | 0.9566 | 1 | 102 | 1066 | 9.568480 | 0.8541 | 1 | 158 | 609 | 25.944171 | 0.67520 | 0 | 286 | 673 | 42.496285 | 0.48560 | 0 | 444 | 1282 | 34.63339 | 0.66340 | 0 | 467 | 1685 | 27.71513 | 0.9180 | 1 | 369 | 2379 | 15.510719 | 0.8562 | 1 | 342 | 14.309623 | 0.40850 | 0 | 548 | 22.928870 | 0.57100 | 0 | 647 | 1831.0000 | 35.33588 | 0.9862 | 1 | 202 | 576.0000 | 35.06944 | 0.9130 | 1 | 16 | 2134 | 0.7497657 | 0.40690 | 0 | 1896 | 2390.0000 | 79.33054 | 0.8451 | 1 | 1702 | 96 | 5.6404230 | 0.5329 | 0 | 0 | 0.0000000 | 0.2186 | 0 | 0 | 1282 | 0.0000000 | 0.09796 | 0 | 186 | 1282.0000 | 14.508580 | 0.8308 | 1 | 43 | 2390 | 1.7991632 | 0.7727 | 1 | 4.24830 | 0.9395 | 4 | 3.28560 | 0.8773 | 2 | 0.8451 | 0.8379 | 1 | 2.45296 | 0.4602 | 2 | 10.83196 | 0.8718 | 9 | 0 | 0 | 0 | 0 | 0 | Yes | Census Tract 3, Calhoun County, Alabama | 12211 | 41700 | 18299 | 51300 | 14164.76 | 48372 | 4134.24 | 0.2918680 | 2928 | 0.0605309 | NA | NA | Calhoun County, Alabama | Anniston-Oxford, AL MSA | C1150 |
| 01015000500 | 01015 | 000500 | AL | Alabama | Calhoun County | 3 | South Region | 6 | East South Central Division | 1731 | 1175 | 743 | 1042 | 1619 | 64.36072 | 0.9767 | 1 | 124 | 472 | 26.271186 | 0.98460 | 1 | 136 | 461 | 29.50108 | 0.48970 | 0 | 163 | 282 | 57.80142 | 0.79190 | 1 | 299 | 743 | 40.24226 | 0.64910 | 0 | 340 | 1270 | 26.77165 | 0.8389 | 1 | 460 | 1794 | 25.641026 | 0.8722 | 1 | 271 | 15.655690 | 0.70190 | 0 | 368 | 21.259388 | 0.32190 | 0 | 507 | 1449 | 34.98965 | 0.9885 | 1 | 150 | 386 | 38.86010 | 0.9269 | 1 | 0 | 1677 | 0.0000000 | 0.09298 | 0 | 1559 | 1731 | 90.06355 | 0.9123 | 1 | 1175 | 50 | 4.2553191 | 0.5128 | 0 | 4 | 0.3404255 | 0.4480 | 0 | 0 | 743 | 0.0000000 | 0.1238 | 0 | 122 | 743 | 16.419919 | 0.8473 | 1 | 0 | 1731 | 0.00000 | 0.3640 | 0 | 4.32150 | 0.9362 | 4 | 3.03218 | 0.7679 | 2 | 0.9123 | 0.9038 | 1 | 2.2959 | 0.3818 | 1 | 10.56188 | 0.8244 | 8 | 940 | 907 | 488 | 586 | 940 | 62.34043 | 0.9815 | 1 | 59 | 297 | 19.865320 | 0.9833 | 1 | 100 | 330 | 30.303030 | 0.79220 | 1 | 58 | 158 | 36.708861 | 0.34970 | 0 | 158 | 488 | 32.37705 | 0.60200 | 0 | 199 | 795 | 25.03145 | 0.8930 | 1 | 118 | 940 | 12.553192 | 0.7770 | 1 | 246 | 26.170213 | 0.90530 | 1 | 118 | 12.553192 | 0.08233 | 0 | 383 | 822.5089 | 46.56484 | 0.9984 | 1 | 30 | 197.8892 | 15.16000 | 0.5363 | 0 | 0 | 889 | 0.0000000 | 0.09479 | 0 | 898 | 940.3866 | 95.49264 | 0.9489 | 1 | 907 | 0 | 0.0000000 | 0.1079 | 0 | 2 | 0.2205072 | 0.4456 | 0 | 2 | 488 | 0.4098361 | 0.23670 | 0 | 146 | 487.6463 | 29.939736 | 0.9404 | 1 | 0 | 940 | 0.0000000 | 0.1831 | 0 | 4.23680 | 0.9379 | 4 | 2.61712 | 0.5593 | 2 | 0.9489 | 0.9409 | 1 | 1.91370 | 0.2196 | 1 | 9.71652 | 0.7468 | 8 | 0 | 0 | 0 | 0 | 0 | Yes | Census Tract 5, Calhoun County, Alabama | 11742 | 38800 | 13571 | 38800 | 13620.72 | 45008 | -49.72 | -0.0036503 | -6208 | -0.1379310 | NA | NA | Calhoun County, Alabama | Anniston-Oxford, AL MSA | C1150 |
| 01015000600 | 01015 | 000600 | AL | Alabama | Calhoun County | 3 | South Region | 6 | East South Central Division | 2571 | 992 | 796 | 1394 | 2133 | 65.35396 | 0.9789 | 1 | 263 | 905 | 29.060773 | 0.98990 | 1 | 121 | 306 | 39.54248 | 0.75940 | 1 | 209 | 490 | 42.65306 | 0.44810 | 0 | 330 | 796 | 41.45729 | 0.68030 | 0 | 641 | 1556 | 41.19537 | 0.9554 | 1 | 416 | 1760 | 23.636364 | 0.8383 | 1 | 220 | 8.556982 | 0.24910 | 0 | 584 | 22.714897 | 0.41610 | 0 | 539 | 1353 | 39.83740 | 0.9955 | 1 | 243 | 466 | 52.14592 | 0.9783 | 1 | 30 | 2366 | 1.2679628 | 0.48990 | 0 | 1944 | 2571 | 75.61260 | 0.8440 | 1 | 992 | 164 | 16.5322581 | 0.7673 | 1 | 8 | 0.8064516 | 0.5110 | 0 | 46 | 796 | 5.7788945 | 0.8329 | 1 | 184 | 796 | 23.115578 | 0.9049 | 1 | 614 | 2571 | 23.88176 | 0.9734 | 1 | 4.44280 | 0.9548 | 4 | 3.12890 | 0.8088 | 2 | 0.8440 | 0.8362 | 1 | 3.9895 | 0.9792 | 4 | 12.40520 | 0.9696 | 11 | 1950 | 964 | 719 | 837 | 1621 | 51.63479 | 0.9467 | 1 | 157 | 652 | 24.079755 | 0.9922 | 1 | 22 | 364 | 6.043956 | 0.01547 | 0 | 129 | 355 | 36.338028 | 0.34200 | 0 | 151 | 719 | 21.00139 | 0.23030 | 0 | 363 | 1387 | 26.17159 | 0.9048 | 1 | 351 | 1613 | 21.760694 | 0.9435 | 1 | 249 | 12.769231 | 0.32090 | 0 | 356 | 18.256410 | 0.27140 | 0 | 332 | 1259.7041 | 26.35540 | 0.9135 | 1 | 136 | 435.6156 | 31.22018 | 0.8775 | 1 | 0 | 1891 | 0.0000000 | 0.09479 | 0 | 1463 | 1949.9821 | 75.02633 | 0.8219 | 1 | 964 | 14 | 1.4522822 | 0.3459 | 0 | 8 | 0.8298755 | 0.5269 | 0 | 19 | 719 | 2.6425591 | 0.61120 | 0 | 197 | 719.0542 | 27.397100 | 0.9316 | 1 | 329 | 1950 | 16.8717949 | 0.9655 | 1 | 4.01750 | 0.9001 | 4 | 2.47809 | 0.4764 | 2 | 0.8219 | 0.8149 | 1 | 3.38110 | 0.8712 | 2 | 10.69859 | 0.8583 | 9 | 0 | 0 | 0 | 0 | 0 | Yes | Census Tract 6, Calhoun County, Alabama | 10958 | 48000 | 14036 | 43300 | 12711.28 | 55680 | 1324.72 | 0.1042161 | -12380 | -0.2223420 | NA | NA | Calhoun County, Alabama | Anniston-Oxford, AL MSA | C1150 |
| 01015002101 | 01015 | 002101 | AL | Alabama | Calhoun County | 3 | South Region | 6 | East South Central Division | 3872 | 1454 | 1207 | 1729 | 2356 | 73.38710 | 0.9916 | 1 | 489 | 2020 | 24.207921 | 0.97860 | 1 | 20 | 168 | 11.90476 | 0.02541 | 0 | 718 | 1039 | 69.10491 | 0.93320 | 1 | 738 | 1207 | 61.14333 | 0.96900 | 1 | 113 | 725 | 15.58621 | 0.6035 | 0 | 664 | 3943 | 16.839970 | 0.6495 | 0 | 167 | 4.313016 | 0.05978 | 0 | 238 | 6.146694 | 0.02255 | 0 | 264 | 2359 | 11.19118 | 0.3027 | 0 | 94 | 263 | 35.74144 | 0.9050 | 1 | 46 | 3769 | 1.2204829 | 0.48250 | 0 | 1601 | 3872 | 41.34814 | 0.6572 | 0 | 1454 | 761 | 52.3383769 | 0.9504 | 1 | 65 | 4.4704264 | 0.6738 | 0 | 5 | 1207 | 0.4142502 | 0.2791 | 0 | 113 | 1207 | 9.362055 | 0.7004 | 0 | 1516 | 3872 | 39.15289 | 0.9860 | 1 | 4.19220 | 0.9133 | 3 | 1.77253 | 0.1304 | 1 | 0.6572 | 0.6511 | 0 | 3.5897 | 0.9337 | 2 | 10.21163 | 0.7885 | 6 | 3238 | 1459 | 1014 | 1082 | 1836 | 58.93246 | 0.9735 | 1 | 251 | 1403 | 17.890235 | 0.9767 | 1 | 31 | 155 | 20.000000 | 0.44920 | 0 | 515 | 859 | 59.953434 | 0.85540 | 1 | 546 | 1014 | 53.84615 | 0.95350 | 1 | 134 | 916 | 14.62882 | 0.7033 | 0 | 251 | 3238 | 7.751699 | 0.5588 | 0 | 167 | 5.157505 | 0.03597 | 0 | 169 | 5.219271 | 0.02111 | 0 | 323 | 1667.0000 | 19.37612 | 0.7205 | 0 | 94 | 277.0000 | 33.93502 | 0.9040 | 1 | 0 | 3164 | 0.0000000 | 0.09479 | 0 | 1045 | 3238.0000 | 32.27301 | 0.5125 | 0 | 1459 | 607 | 41.6038382 | 0.9185 | 1 | 65 | 4.4551062 | 0.6949 | 0 | 24 | 1014 | 2.3668639 | 0.57900 | 0 | 85 | 1014.0000 | 8.382643 | 0.6775 | 0 | 1402 | 3238 | 43.2983323 | 0.9876 | 1 | 4.16580 | 0.9263 | 3 | 1.77637 | 0.1225 | 1 | 0.5125 | 0.5082 | 0 | 3.85750 | 0.9661 | 2 | 10.31217 | 0.8160 | 6 | 0 | 0 | 0 | 0 | 0 | Yes | Census Tract 21.01, Calhoun County, Alabama | 4968 | 92000 | 9312 | 153500 | 5762.88 | 106720 | 3549.12 | 0.6158587 | 46780 | 0.4383433 | NA | NA | Calhoun County, Alabama | Anniston-Oxford, AL MSA | C1150 |
| 01015002300 | 01015 | 002300 | AL | Alabama | Calhoun County | 3 | South Region | 6 | East South Central Division | 3882 | 1861 | 1608 | 1366 | 3882 | 35.18805 | 0.7753 | 1 | 186 | 1539 | 12.085770 | 0.80740 | 1 | 284 | 1109 | 25.60866 | 0.35530 | 0 | 202 | 499 | 40.48096 | 0.39670 | 0 | 486 | 1608 | 30.22388 | 0.34700 | 0 | 727 | 2610 | 27.85441 | 0.8534 | 1 | 547 | 3706 | 14.759849 | 0.5669 | 0 | 716 | 18.444101 | 0.82530 | 1 | 904 | 23.286966 | 0.45720 | 0 | 719 | 2919 | 24.63172 | 0.8986 | 1 | 207 | 1191 | 17.38035 | 0.5923 | 0 | 0 | 3720 | 0.0000000 | 0.09298 | 0 | 490 | 3882 | 12.62236 | 0.3118 | 0 | 1861 | 38 | 2.0419130 | 0.4070 | 0 | 199 | 10.6931757 | 0.7836 | 1 | 52 | 1608 | 3.2338308 | 0.6986 | 0 | 166 | 1608 | 10.323383 | 0.7304 | 0 | 0 | 3882 | 0.00000 | 0.3640 | 0 | 3.35000 | 0.7384 | 3 | 2.86638 | 0.6919 | 2 | 0.3118 | 0.3089 | 0 | 2.9836 | 0.7289 | 1 | 9.51178 | 0.7100 | 6 | 3265 | 1774 | 1329 | 1103 | 3265 | 33.78254 | 0.7880 | 1 | 122 | 1422 | 8.579465 | 0.8131 | 1 | 101 | 844 | 11.966825 | 0.10960 | 0 | 126 | 485 | 25.979381 | 0.15930 | 0 | 227 | 1329 | 17.08051 | 0.11070 | 0 | 267 | 2122 | 12.58247 | 0.6388 | 0 | 328 | 3265 | 10.045942 | 0.6808 | 0 | 440 | 13.476263 | 0.36070 | 0 | 843 | 25.819296 | 0.74470 | 0 | 530 | 2422.0000 | 21.88274 | 0.8097 | 1 | 254 | 861.0000 | 29.50058 | 0.8574 | 1 | 0 | 3026 | 0.0000000 | 0.09479 | 0 | 811 | 3265.0000 | 24.83920 | 0.4221 | 0 | 1774 | 7 | 0.3945885 | 0.2444 | 0 | 338 | 19.0529876 | 0.8924 | 1 | 19 | 1329 | 1.4296464 | 0.44520 | 0 | 120 | 1329.0000 | 9.029345 | 0.7016 | 0 | 0 | 3265 | 0.0000000 | 0.1831 | 0 | 3.03140 | 0.6608 | 2 | 2.86729 | 0.7016 | 2 | 0.4221 | 0.4185 | 0 | 2.46670 | 0.4669 | 1 | 8.78749 | 0.6230 | 5 | 0 | 0 | 0 | 0 | 0 | Yes | Census Tract 23, Calhoun County, Alabama | 15086 | 77500 | 21540 | 78500 | 17499.76 | 89900 | 4040.24 | 0.2308740 | -11400 | -0.1268076 | 120.54 | 131.82 | Calhoun County, Alabama | Anniston-Oxford, AL MSA | C1150 |
| 01023956700 | 01023 | 956700 | AL | Alabama | Choctaw County | 3 | South Region | 6 | East South Central Division | 3011 | 1772 | 1179 | 1715 | 3011 | 56.95782 | 0.9531 | 1 | 266 | 890 | 29.887640 | 0.99100 | 1 | 267 | 1035 | 25.79710 | 0.36240 | 0 | 79 | 144 | 54.86111 | 0.73440 | 0 | 346 | 1179 | 29.34690 | 0.31850 | 0 | 738 | 2053 | 35.94739 | 0.9287 | 1 | 543 | 2904 | 18.698347 | 0.7133 | 0 | 569 | 18.897376 | 0.84040 | 1 | 648 | 21.521089 | 0.33840 | 0 | 813 | 2273 | 35.76771 | 0.9901 | 1 | 252 | 771 | 32.68482 | 0.8778 | 1 | 0 | 2880 | 0.0000000 | 0.09298 | 0 | 2455 | 3011 | 81.53437 | 0.8712 | 1 | 1772 | 38 | 2.1444695 | 0.4136 | 0 | 485 | 27.3702032 | 0.9349 | 1 | 72 | 1179 | 6.1068702 | 0.8435 | 1 | 109 | 1179 | 9.245123 | 0.6964 | 0 | 0 | 3011 | 0.00000 | 0.3640 | 0 | 3.90460 | 0.8597 | 3 | 3.13968 | 0.8131 | 3 | 0.8712 | 0.8631 | 1 | 3.2524 | 0.8387 | 2 | 11.16788 | 0.8840 | 9 | 3335 | 1912 | 1362 | 1135 | 3313 | 34.25898 | 0.7948 | 1 | 188 | 1147 | 16.390584 | 0.9686 | 1 | 212 | 1058 | 20.037807 | 0.45090 | 0 | 27 | 304 | 8.881579 | 0.02679 | 0 | 239 | 1362 | 17.54772 | 0.12350 | 0 | 466 | 2537 | 18.36815 | 0.7948 | 1 | 495 | 3335 | 14.842579 | 0.8413 | 1 | 791 | 23.718141 | 0.85250 | 1 | 613 | 18.380810 | 0.27840 | 0 | 884 | 2714.0000 | 32.57185 | 0.9752 | 1 | 230 | 918.0000 | 25.05447 | 0.7925 | 1 | 25 | 3103 | 0.8056719 | 0.41920 | 0 | 2637 | 3335.0000 | 79.07046 | 0.8436 | 1 | 1912 | 0 | 0.0000000 | 0.1079 | 0 | 758 | 39.6443515 | 0.9799 | 1 | 16 | 1362 | 1.1747430 | 0.40060 | 0 | 75 | 1362.0000 | 5.506608 | 0.5316 | 0 | 8 | 3335 | 0.2398801 | 0.4965 | 0 | 3.52300 | 0.7901 | 4 | 3.31780 | 0.8870 | 3 | 0.8436 | 0.8365 | 1 | 2.51650 | 0.4924 | 1 | 10.20090 | 0.8033 | 9 | 0 | 0 | 0 | 0 | 0 | Yes | Census Tract 9567, Choctaw County, Alabama | 12737 | 60900 | 16852 | 63400 | 14774.92 | 70644 | 2077.08 | 0.1405815 | -7244 | -0.1025423 | NA | NA | NA | NA | NA |
| 01023957000 | 01023 | 957000 | AL | Alabama | Choctaw County | 3 | South Region | 6 | East South Central Division | 2567 | 1187 | 916 | 767 | 2567 | 29.87924 | 0.6933 | 0 | 145 | 1060 | 13.679245 | 0.86050 | 1 | 101 | 719 | 14.04729 | 0.04540 | 0 | 43 | 197 | 21.82741 | 0.09791 | 0 | 144 | 916 | 15.72052 | 0.02333 | 0 | 355 | 1704 | 20.83333 | 0.7366 | 0 | 289 | 2296 | 12.587108 | 0.4736 | 0 | 324 | 12.621737 | 0.51120 | 0 | 688 | 26.801714 | 0.68810 | 0 | 572 | 1746 | 32.76060 | 0.9809 | 1 | 121 | 636 | 19.02516 | 0.6414 | 0 | 5 | 2283 | 0.2190101 | 0.22520 | 0 | 1314 | 2567 | 51.18816 | 0.7225 | 0 | 1187 | 0 | 0.0000000 | 0.1224 | 0 | 335 | 28.2224094 | 0.9394 | 1 | 13 | 916 | 1.4192140 | 0.4834 | 0 | 70 | 916 | 7.641921 | 0.6353 | 0 | 0 | 2567 | 0.00000 | 0.3640 | 0 | 2.78733 | 0.5903 | 1 | 3.04680 | 0.7745 | 1 | 0.7225 | 0.7158 | 0 | 2.5445 | 0.5114 | 1 | 9.10113 | 0.6601 | 3 | 2077 | 1158 | 866 | 759 | 2072 | 36.63127 | 0.8256 | 1 | 61 | 780 | 7.820513 | 0.7726 | 1 | 106 | 735 | 14.421769 | 0.19760 | 0 | 11 | 131 | 8.396947 | 0.02525 | 0 | 117 | 866 | 13.51039 | 0.04053 | 0 | 351 | 1464 | 23.97541 | 0.8815 | 1 | 205 | 2077 | 9.870005 | 0.6729 | 0 | 402 | 19.354839 | 0.68820 | 0 | 496 | 23.880597 | 0.63430 | 0 | 466 | 1576.0000 | 29.56853 | 0.9544 | 1 | 154 | 612.0000 | 25.16340 | 0.7942 | 1 | 0 | 2002 | 0.0000000 | 0.09479 | 0 | 1018 | 2077.0000 | 49.01300 | 0.6638 | 0 | 1158 | 0 | 0.0000000 | 0.1079 | 0 | 439 | 37.9101900 | 0.9766 | 1 | 0 | 866 | 0.0000000 | 0.09796 | 0 | 42 | 866.0000 | 4.849884 | 0.4884 | 0 | 5 | 2077 | 0.2407318 | 0.4971 | 0 | 3.19313 | 0.7061 | 3 | 3.16589 | 0.8369 | 2 | 0.6638 | 0.6582 | 0 | 2.16796 | 0.3247 | 1 | 9.19078 | 0.6792 | 6 | 0 | 0 | 0 | 0 | 0 | Yes | Census Tract 9570, Choctaw County, Alabama | 16224 | 51600 | 21740 | 74000 | 18819.84 | 59856 | 2920.16 | 0.1551639 | 14144 | 0.2363005 | NA | NA | NA | NA | NA |
| 01031010500 | 01031 | 010500 | AL | Alabama | Coffee County | 3 | South Region | 6 | East South Central Division | 4529 | 1950 | 1664 | 1649 | 4022 | 40.99950 | 0.8432 | 1 | 114 | 1424 | 8.005618 | 0.56260 | 0 | 309 | 1057 | 29.23368 | 0.48130 | 0 | 251 | 607 | 41.35091 | 0.41690 | 0 | 560 | 1664 | 33.65385 | 0.45740 | 0 | 1269 | 3370 | 37.65579 | 0.9387 | 1 | 516 | 4279 | 12.058892 | 0.4492 | 0 | 832 | 18.370501 | 0.82310 | 1 | 894 | 19.739457 | 0.23950 | 0 | 1023 | 3404 | 30.05288 | 0.9666 | 1 | 303 | 1112 | 27.24820 | 0.8108 | 1 | 43 | 4270 | 1.0070258 | 0.44510 | 0 | 1761 | 4529 | 38.88276 | 0.6383 | 0 | 1950 | 6 | 0.3076923 | 0.2576 | 0 | 276 | 14.1538462 | 0.8279 | 1 | 8 | 1664 | 0.4807692 | 0.2925 | 0 | 125 | 1664 | 7.512019 | 0.6289 | 0 | 507 | 4529 | 11.19452 | 0.9441 | 1 | 3.25110 | 0.7138 | 2 | 3.28510 | 0.8639 | 3 | 0.6383 | 0.6324 | 0 | 2.9510 | 0.7136 | 2 | 10.12550 | 0.7794 | 7 | 4815 | 2118 | 1731 | 1329 | 4470 | 29.73154 | 0.7256 | 0 | 147 | 1903 | 7.724645 | 0.7670 | 1 | 209 | 1256 | 16.640127 | 0.29310 | 0 | 208 | 475 | 43.789474 | 0.51620 | 0 | 417 | 1731 | 24.09012 | 0.33700 | 0 | 953 | 3728 | 25.56330 | 0.8985 | 1 | 668 | 4485 | 14.894091 | 0.8425 | 1 | 1053 | 21.869159 | 0.79500 | 1 | 766 | 15.908619 | 0.16760 | 0 | 1010 | 3719.0000 | 27.15784 | 0.9262 | 1 | 243 | 1133.0000 | 21.44748 | 0.7184 | 0 | 1 | 4577 | 0.0218484 | 0.19150 | 0 | 1643 | 4815.0000 | 34.12253 | 0.5321 | 0 | 2118 | 0 | 0.0000000 | 0.1079 | 0 | 475 | 22.4268178 | 0.9157 | 1 | 37 | 1731 | 2.1374928 | 0.55080 | 0 | 144 | 1731.0000 | 8.318891 | 0.6750 | 0 | 330 | 4815 | 6.8535826 | 0.9282 | 1 | 3.57060 | 0.8018 | 3 | 2.79870 | 0.6649 | 2 | 0.5321 | 0.5276 | 0 | 3.17760 | 0.7990 | 2 | 10.07900 | 0.7892 | 7 | 0 | 0 | 0 | 0 | 0 | Yes | Census Tract 105, Coffee County, Alabama | 14641 | 88000 | 21367 | 78100 | 16983.56 | 102080 | 4383.44 | 0.2580990 | -23980 | -0.2349138 | 128.88 | 137.26 | Coffee County, Alabama | Dothan-Enterprise-Ozark, AL CSA | CS222 |
Log NMTC and LIHTC Variables
svi_national_nmtc_df$Median_Income_10adj_log <- log(svi_national_nmtc_df$Median_Income_10adj)
svi_national_nmtc_df$Median_Income_19_log <- log(svi_national_nmtc_df$Median_Income_19)

svi_national_nmtc_df$Median_Home_Value_10adj_log = log(svi_national_nmtc_df$Median_Home_Value_10adj)
svi_national_nmtc_df$Median_Home_Value_19_log = log(svi_national_nmtc_df$Median_Home_Value_19)

svi_national_nmtc_df$housing_price_index10_log = log(svi_national_nmtc_df$housing_price_index10)
svi_national_nmtc_df$housing_price_index20_log = log(svi_national_nmtc_df$housing_price_index20)

svi_divisional_nmtc_df$Median_Income_10adj_log <- log(svi_divisional_nmtc_df$Median_Income_10adj)
svi_divisional_nmtc_df$Median_Income_19_log <- log(svi_divisional_nmtc_df$Median_Income_19)

svi_divisional_nmtc_df$Median_Home_Value_10adj_log = log(svi_divisional_nmtc_df$Median_Home_Value_10adj)
svi_divisional_nmtc_df$Median_Home_Value_19_log = log(svi_divisional_nmtc_df$Median_Home_Value_19)

svi_divisional_nmtc_df$housing_price_index10_log = log(svi_divisional_nmtc_df$housing_price_index10)
svi_divisional_nmtc_df$housing_price_index20_log = log(svi_divisional_nmtc_df$housing_price_index20)

svi_national_lihtc_df$Median_Income_10adj_log <- log(svi_national_lihtc_df$Median_Income_10adj)
svi_national_lihtc_df$Median_Income_19_log <- log(svi_national_lihtc_df$Median_Income_19)

svi_national_lihtc_df$Median_Home_Value_10adj_log = log(svi_national_lihtc_df$Median_Home_Value_10adj)
svi_national_lihtc_df$Median_Home_Value_19_log = log(svi_national_lihtc_df$Median_Home_Value_19)

svi_national_lihtc_df$housing_price_index10_log = log(svi_national_lihtc_df$housing_price_index10)
svi_national_lihtc_df$housing_price_index20_log = log(svi_national_lihtc_df$housing_price_index20)

svi_divisional_lihtc_df$Median_Income_10adj_log <- log(svi_divisional_lihtc_df$Median_Income_10adj)
svi_divisional_lihtc_df$Median_Income_19_log <- log(svi_divisional_lihtc_df$Median_Income_19)

svi_divisional_lihtc_df$Median_Home_Value_10adj_log = log(svi_divisional_lihtc_df$Median_Home_Value_10adj)
svi_divisional_lihtc_df$Median_Home_Value_19_log = log(svi_divisional_lihtc_df$Median_Home_Value_19)

svi_divisional_lihtc_df$housing_price_index10_log = log(svi_divisional_lihtc_df$housing_price_index10)
svi_divisional_lihtc_df$housing_price_index20_log = log(svi_divisional_lihtc_df$housing_price_index20)
Diff-in-Diff Models
NMTC Evaluation
Divisional SVI
# Create 2010 df, create post variable and set to 0, create year variable and set to 2010
nmtc_did10_div_svi <- svi_divisional_nmtc_df %>%
  select(GEOID_2010_trt, cbsa, F_THEME1_10, F_THEME2_10, F_THEME3_10, F_THEME4_10, F_TOTAL_10, nmtc_flag) %>%
  mutate(post = 0,
         year = 2010) %>%
  rename("treat" = "nmtc_flag",
         "SVI_FLAG_COUNT_SES" = "F_THEME1_10",
         "SVI_FLAG_COUNT_HHCHAR" = "F_THEME2_10",
         "SVI_FLAG_COUNT_REM" = "F_THEME3_10",
         "SVI_FLAG_COUNT_HOUSETRANSPT" = "F_THEME4_10",
         "SVI_FLAG_COUNT_OVERALL" = "F_TOTAL_10")

nrow(nmtc_did10_div_svi)
## [1] 1855
# Create 2020 df, create post variable and set to 1, create year variable and set to 2020
nmtc_did20_div_svi <- svi_divisional_nmtc_df %>%
  select(GEOID_2010_trt, cbsa, F_THEME1_20, F_THEME2_20, F_THEME3_20, F_THEME4_20, F_TOTAL_20, nmtc_flag) %>%
  mutate(post = 1,
         year = 2020) %>%
  rename("treat" = "nmtc_flag",
         "SVI_FLAG_COUNT_SES" = "F_THEME1_20",
         "SVI_FLAG_COUNT_HHCHAR" = "F_THEME2_20",
         "SVI_FLAG_COUNT_REM" = "F_THEME3_20",
         "SVI_FLAG_COUNT_HOUSETRANSPT" = "F_THEME4_20",
         "SVI_FLAG_COUNT_OVERALL" = "F_TOTAL_20"
  )


nrow(nmtc_did20_div_svi)
## [1] 1855
nmtc_diff_in_diff_div_svi <- bind_rows(nmtc_did10_div_svi, nmtc_did20_div_svi)

nmtc_diff_in_diff_div_svi <- nmtc_diff_in_diff_div_svi %>% arrange(post, treat, GEOID_2010_trt)

nrow(nmtc_diff_in_diff_div_svi)
## [1] 3710
Divisional Median Income
# Create 2010 df, create post variable and set to 0, create year variable and set to 2010, remove any tracts that don't have data for 2010 and 2019
nmtc_did10_div_inc <- svi_divisional_nmtc_df %>%
  filter(!is.na(Median_Income_10adj_log)) %>% filter(!is.na(Median_Income_19_log)) %>%
  select(GEOID_2010_trt, cbsa, Median_Income_10adj_log, nmtc_flag) %>%
  mutate(post = 0,
         year = 2010) %>%
  rename("treat" = "nmtc_flag",
         "MEDIAN_INCOME" = "Median_Income_10adj_log")


nrow(nmtc_did10_div_inc)
## [1] 1852
# Create 2019 df, create post variable and set to 1, create year variable and set to 2019, remove any tracts that don't have data for 2010 and 2019
nmtc_did19_div_inc <- svi_divisional_nmtc_df %>%
  filter(!is.na(Median_Income_10adj_log)) %>% filter(!is.na(Median_Income_19_log)) %>%
  select(GEOID_2010_trt, cbsa, Median_Income_19_log, nmtc_flag) %>%
  mutate(post = 1,
         year = 2019) %>%
  rename("treat" = "nmtc_flag",
         "MEDIAN_INCOME" = "Median_Income_19_log")


nrow(nmtc_did19_div_inc)
## [1] 1852
nmtc_diff_in_diff_div_inc <- bind_rows(nmtc_did10_div_inc, nmtc_did19_div_inc)

nmtc_diff_in_diff_div_inc <- nmtc_diff_in_diff_div_inc %>% arrange(post, treat, GEOID_2010_trt)

nrow(nmtc_diff_in_diff_div_inc)
## [1] 3704
Divisional Home Value
nmtc_did10_div_mhv <- svi_divisional_nmtc_df %>%
  filter(!is.na(Median_Home_Value_10adj_log)) %>% filter(!is.na(Median_Home_Value_19_log)) %>%
  select(GEOID_2010_trt, cbsa, Median_Home_Value_10adj_log, nmtc_flag) %>%
  mutate(post = 0,
         year = 2010) %>%
  rename("treat" = "nmtc_flag",
         "MEDIAN_HOME_VALUE" = "Median_Home_Value_10adj_log")


nrow(nmtc_did10_div_mhv)
## [1] 1824
nmtc_did19_div_mhv <- svi_divisional_nmtc_df %>%
  filter(!is.na(Median_Home_Value_10adj_log)) %>% filter(!is.na(Median_Home_Value_19_log)) %>%
  select(GEOID_2010_trt, cbsa, Median_Home_Value_19_log, nmtc_flag) %>%
  mutate(post = 1,
         year = 2019) %>%
  rename("treat" = "nmtc_flag",
         "MEDIAN_HOME_VALUE" = "Median_Home_Value_19_log")


nrow(nmtc_did19_div_mhv)
## [1] 1824
nmtc_diff_in_diff_div_mhv <- bind_rows(nmtc_did10_div_mhv, nmtc_did19_div_mhv)

nmtc_diff_in_diff_div_mhv <- nmtc_diff_in_diff_div_mhv %>% arrange(post, treat, GEOID_2010_trt)

nrow(nmtc_diff_in_diff_div_mhv)
## [1] 3648
Divisional House Price Index
nmtc_did10_div_hpi <- svi_divisional_nmtc_df %>%
  filter(!is.na(housing_price_index10_log)) %>% filter(!is.na(housing_price_index20_log)) %>%
  select(GEOID_2010_trt, cbsa, housing_price_index10_log, nmtc_flag) %>%
  mutate(post = 0,
         year = 2010) %>%
  rename("treat" = "nmtc_flag",
         "HOUSE_PRICE_INDEX" = "housing_price_index10_log")


nrow(nmtc_did10_div_hpi)
## [1] 1147
nmtc_did20_div_hpi <- svi_divisional_nmtc_df %>%
  filter(!is.na(housing_price_index10_log)) %>% filter(!is.na(housing_price_index20_log)) %>%
  select(GEOID_2010_trt, cbsa, housing_price_index20_log, nmtc_flag) %>%
  mutate(post = 1,
         year = 2020) %>%
  rename("treat" = "nmtc_flag",
         "HOUSE_PRICE_INDEX" = "housing_price_index20_log")


nrow(nmtc_did20_div_hpi)
## [1] 1147
nmtc_diff_in_diff_div_hpi <- bind_rows(nmtc_did10_div_hpi, nmtc_did20_div_hpi)

nmtc_diff_in_diff_div_hpi <- nmtc_diff_in_diff_div_hpi %>% arrange(post, treat, GEOID_2010_trt)

nrow(nmtc_diff_in_diff_div_hpi)
## [1] 2294
NMTC Divisional Model
# SVI & Economic Models

m1_nmtc_div <- lm( SVI_FLAG_COUNT_SES ~ treat + post + treat*post + cbsa, data=nmtc_diff_in_diff_div_svi )

m2_nmtc_div <- lm( SVI_FLAG_COUNT_HHCHAR ~ treat + post + treat*post + cbsa, data=nmtc_diff_in_diff_div_svi )

m3_nmtc_div <- lm( SVI_FLAG_COUNT_REM ~ treat + post + treat*post + cbsa, data=nmtc_diff_in_diff_div_svi )

m4_nmtc_div <- lm( SVI_FLAG_COUNT_HOUSETRANSPT ~ treat + post + treat*post + cbsa, data=nmtc_diff_in_diff_div_svi )

m5_nmtc_div <- lm( SVI_FLAG_COUNT_OVERALL  ~ treat + post + treat*post + cbsa, data=nmtc_diff_in_diff_div_svi)

m6_nmtc_div <- lm( MEDIAN_INCOME ~ treat + post + treat*post + cbsa, data=nmtc_diff_in_diff_div_inc )

m7_nmtc_div <- lm( MEDIAN_HOME_VALUE ~ treat + post + treat*post + cbsa, data=nmtc_diff_in_diff_div_mhv )

m8_nmtc_div <- lm( HOUSE_PRICE_INDEX ~ treat + post + treat*post + cbsa, data=nmtc_diff_in_diff_div_hpi )

# Add all models to a list
models <- list(

  "SES" = m1_nmtc_div,
  "HHChar"  = m2_nmtc_div,
  "REM" = m3_nmtc_div,
  "HOUSETRANSPT" = m4_nmtc_div,
  "OVERALL" = m5_nmtc_div,
  "Median Income (USD, logged)" = m6_nmtc_div,
  "Median Home Value (USD, logged)" = m7_nmtc_div,
  "House Price Index (logged)" = m8_nmtc_div
)


# Display model results
modelsummary(models,  fmt = 2, stars = c('*' = .05, '**' = .01, '***' = .001), coef_omit = "cbsa", gof_omit = "IC|Log",
             notes = list('All models include metro-level fixed effects by core-based statistical area (cbsa).'),
             title = paste0("Differences-in-Differences Linear Regression Analysis of NMTC in ", census_division)) %>%
  group_tt(j = list("Social Vulnerability" = 2:6, "Economic Outcomes" = 7:9))
| Social Vulnerability | Economic Outcomes | |||||||
|---|---|---|---|---|---|---|---|---|
| SES | HHChar | REM | HOUSETRANSPT | OVERALL | Median Income (USD, logged) | Median Home Value (USD, logged) | House Price Index (logged) | |
| (Intercept) | 1.67 | 1.67* | 0.28 | 3.16*** | 6.77*** | 9.95*** | 11.66*** | 4.95*** |
| (1.04) | (0.73) | (0.30) | (0.75) | (2.04) | (0.20) | (0.24) | (0.18) | |
| treat | 1.01*** | 0.42*** | 0.21*** | 0.31*** | 1.95*** | -0.12*** | -0.11*** | -0.07** |
| (0.11) | (0.07) | (0.03) | (0.08) | (0.21) | (0.02) | (0.02) | (0.03) | |
| post | -0.02 | -0.02 | 0.01 | -0.00 | -0.03 | 0.05*** | -0.07*** | 0.28*** |
| (0.06) | (0.04) | (0.02) | (0.04) | (0.12) | (0.01) | (0.01) | (0.01) | |
| treat × post | -0.33* | -0.16 | 0.00 | 0.07 | -0.42 | 0.00 | -0.06 | 0.01 |
| (0.14) | (0.10) | (0.04) | (0.10) | (0.28) | (0.03) | (0.03) | (0.03) | |
| Num.Obs. | 2828 | 2828 | 2828 | 2828 | 2828 | 2828 | 2772 | 1868 |
| R2 | 0.194 | 0.171 | 0.312 | 0.112 | 0.178 | 0.211 | 0.518 | 0.418 |
| R2 Adj. | 0.165 | 0.140 | 0.287 | 0.080 | 0.148 | 0.182 | 0.500 | 0.388 |
| RMSE | 1.44 | 1.00 | 0.41 | 1.03 | 2.82 | 0.28 | 0.33 | 0.25 |
|
||||||||
| All models include metro-level fixed effects by core-based statistical area (cbsa). | ||||||||
Differences-in-Differences Linear Regression Analysis of NMTC in West North Central Division
In the West North Central division, the DiD interaction (treat × post) is –0.33 (p < .05) on the SES flag count—indicating that NMTC-funded tracts experienced a modest but statistically significant reduction in socioeconomic vulnerability relative to non-funded tracts. No other SVI themes or economic outcomes showed significant DiD effects at the 5% level.
Visualize SES
status <- c("NMTC Non-Participant",
             "NMTC Participant Counterfactual",
             "NMTC Participant",
             "NMTC Non-Participant",
             "NMTC Participant Counterfactual",
             "NMTC Participant")
year <- c(2010,
          2010,
          2010,
          2020,
          2020,
          2020)
outcome <- c(m1_nmtc_div$coefficients[1],
           m1_nmtc_div$coefficients[1] + m1_nmtc_div$coefficients[2],
           m1_nmtc_div$coefficients[1] + m1_nmtc_div$coefficients[2],
           m1_nmtc_div$coefficients[1] + m1_nmtc_div$coefficients[3],
           m1_nmtc_div$coefficients[1] + m1_nmtc_div$coefficients[2] + m1_nmtc_div$coefficients[3],
           m1_nmtc_div$coefficients[1] + m1_nmtc_div$coefficients[2] + m1_nmtc_div$coefficients[3] + m1_nmtc_div$coefficients[length(m1_nmtc_div$coefficients)])

svidiv_viz_ses_nmtc <- data.frame(status, year, outcome)
svidiv_viz_ses_nmtc$outcome_label <- round(svidiv_viz_ses_nmtc$outcome, 2)
svidiv_viz_ses_nmtc
##                            status year  outcome outcome_label
## 1            NMTC Non-Participant 2010 1.671491          1.67
## 2 NMTC Participant Counterfactual 2010 2.677291          2.68
## 3                NMTC Participant 2010 2.677291          2.68
## 4            NMTC Non-Participant 2020 1.649995          1.65
## 5 NMTC Participant Counterfactual 2020 2.655795          2.66
## 6                NMTC Participant 2020 2.322709          2.32
slopegraph_plot (svidiv_viz_ses_nmtc, "NMTC Participant", "NMTC Non-Participant","Impact of NMTC Program on SVI SES Flag Count", paste0(census_division, " | 2010 - 2020"))
 The
slopegraph shows non-participant tracts’ SES flags remain essentially
flat from 2010 to 2020, while NMTC tracts decline from ~2.68 to ~2.32
flags, mirroring our estimated, –0.33 DiD effect.
The
slopegraph shows non-participant tracts’ SES flags remain essentially
flat from 2010 to 2020, while NMTC tracts decline from ~2.68 to ~2.32
flags, mirroring our estimated, –0.33 DiD effect.
Visualize Median Home Value
status <- c("NMTC Non-Participant",
             "NMTC Participant Counterfactual",
             "NMTC Participant",
             "NMTC Non-Participant",
             "NMTC Participant Counterfactual",
             "NMTC Participant")
year <- c(2010,
          2010,
          2010,
          2020,
          2020,
          2020)
outcome <- c(exp(m7_nmtc_div$coefficients[1]),
           exp(m7_nmtc_div$coefficients[1])*exp(m7_nmtc_div$coefficients[2]),
           exp(m7_nmtc_div$coefficients[1])*exp(m7_nmtc_div$coefficients[2]),
           exp(m7_nmtc_div$coefficients[1])*exp(m7_nmtc_div$coefficients[3]),
           exp(m7_nmtc_div$coefficients[1])*exp(m7_nmtc_div$coefficients[2])*exp(m7_nmtc_div$coefficients[3]),
           exp(m7_nmtc_div$coefficients[1])*exp(m7_nmtc_div$coefficients[2])*exp(m7_nmtc_div$coefficients[3])*exp(m7_nmtc_div$coefficients[length(m7_nmtc_div$coefficients)])
)

svidiv_viz_medhmv_nmtc <- data.frame(status, year, outcome)

### Note that instead of rounding like we did for SVI variables, we will be formatting our outcome as US dollars
svidiv_viz_medhmv_nmtc$outcome_label <- scales::dollar_format()(svidiv_viz_medhmv_nmtc$outcome)

svidiv_viz_medhmv_nmtc
##                            status year   outcome outcome_label
## 1            NMTC Non-Participant 2010 115814.93      $115,815
## 2 NMTC Participant Counterfactual 2010 103578.32      $103,578
## 3                NMTC Participant 2010 103578.32      $103,578
## 4            NMTC Non-Participant 2020 107780.24      $107,780
## 5 NMTC Participant Counterfactual 2020  96392.55       $96,393
## 6                NMTC Participant 2020  90602.19       $90,602
slopegraph_plot (svidiv_viz_medhmv_nmtc, "NMTC Participant", "NMTC Non-Participant", "Impact of NMTC Program on Average Median Home Value", paste0(census_division, " | 2010 - 2020"))
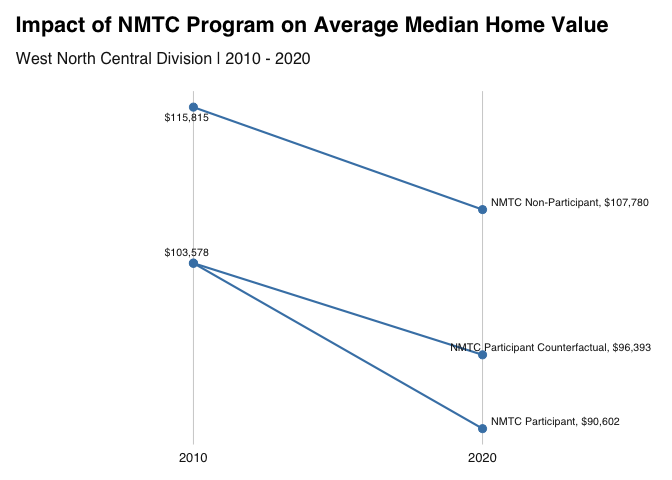
The home-value slopegraph reveals that participant tracts’ median home values rose from $103,578 in 2010 to $90,602 in 2020 (inflation-adjusted), compared with 115,815 to 107,780 in non-participant tracts, suggesting smaller gains in NMTC areas over the decade.
LIHTC Evaluation
Divisional SVI
# Create 2010 df, create post variable and set to 0, create year variable and set to 2010
lihtc_did10_div_svi <- svi_divisional_lihtc_df %>%
  select(GEOID_2010_trt, cbsa, F_THEME1_10, F_THEME2_10, F_THEME3_10, F_THEME4_10, F_TOTAL_10, lihtc_flag) %>%
  mutate(post = 0,
         year = 2010) %>%
  rename("treat" = "lihtc_flag",
         "SVI_FLAG_COUNT_SES" = "F_THEME1_10",
         "SVI_FLAG_COUNT_HHCHAR" = "F_THEME2_10",
         "SVI_FLAG_COUNT_REM" = "F_THEME3_10",
         "SVI_FLAG_COUNT_HOUSETRANSPT" = "F_THEME4_10",
         "SVI_FLAG_COUNT_OVERALL" = "F_TOTAL_10")

nrow(lihtc_did10_div_svi)
## [1] 118
# Create 2020 df, create post variable and set to 1, create year variable and set to 2020
lihtc_did20_div_svi <- svi_divisional_lihtc_df %>%
  select(GEOID_2010_trt, cbsa, F_THEME1_20, F_THEME2_20, F_THEME3_20, F_THEME4_20, F_TOTAL_20, lihtc_flag) %>%
  mutate(post = 1,
         year = 2020) %>%
  rename("treat" = "lihtc_flag",
         "SVI_FLAG_COUNT_SES" = "F_THEME1_20",
         "SVI_FLAG_COUNT_HHCHAR" = "F_THEME2_20",
         "SVI_FLAG_COUNT_REM" = "F_THEME3_20",
         "SVI_FLAG_COUNT_HOUSETRANSPT" = "F_THEME4_20",
         "SVI_FLAG_COUNT_OVERALL" = "F_TOTAL_20"
  )


nrow(lihtc_did20_div_svi)
## [1] 118
lihtc_diff_in_diff_div_svi <- bind_rows(lihtc_did10_div_svi, lihtc_did20_div_svi)

lihtc_diff_in_diff_div_svi <- lihtc_diff_in_diff_div_svi %>% arrange(post, treat, GEOID_2010_trt)

nrow(lihtc_diff_in_diff_div_svi)
## [1] 236
Divisional Median Income
# Create 2010 df, create post variable and set to 0, create year variable and set to 2010, remove any tracts that don't have data for 2010 and 2019
lihtc_did10_div_inc <- svi_divisional_lihtc_df %>%
  filter(!is.na(Median_Income_10adj_log)) %>% filter(!is.na(Median_Income_19_log)) %>%
  select(GEOID_2010_trt, cbsa, Median_Income_10adj_log, lihtc_flag) %>%
  mutate(post = 0,
         year = 2010) %>%
  rename("treat" = "lihtc_flag",
         "MEDIAN_INCOME" = "Median_Income_10adj_log")


nrow(lihtc_did10_div_inc)
## [1] 117
# Create 2019 df, create post variable and set to 1, create year variable and set to 2019, remove any tracts that don't have data for 2010 and 2019
lihtc_did19_div_inc <- svi_divisional_lihtc_df %>%
  filter(!is.na(Median_Income_10adj_log)) %>% filter(!is.na(Median_Income_19_log)) %>%
  select(GEOID_2010_trt, cbsa, Median_Income_19_log, lihtc_flag) %>%
  mutate(post = 1,
         year = 2019) %>%
  rename("treat" = "lihtc_flag",
         "MEDIAN_INCOME" = "Median_Income_19_log")


nrow(lihtc_did19_div_inc)
## [1] 117
lihtc_diff_in_diff_div_inc <- bind_rows(lihtc_did10_div_inc, lihtc_did19_div_inc)

lihtc_diff_in_diff_div_inc <- lihtc_diff_in_diff_div_inc %>% arrange(post, treat, GEOID_2010_trt)

nrow(lihtc_diff_in_diff_div_inc)
## [1] 234
Divisional Median Home Value
lihtc_did10_div_mhv <- svi_divisional_lihtc_df %>%
  filter(!is.na(Median_Home_Value_10adj_log)) %>% filter(!is.na(Median_Home_Value_19_log)) %>%
  select(GEOID_2010_trt, cbsa, Median_Home_Value_10adj_log, lihtc_flag) %>%
  mutate(post = 0,
         year = 2010) %>%
  rename("treat" = "lihtc_flag",
         "MEDIAN_HOME_VALUE" = "Median_Home_Value_10adj_log")


nrow(lihtc_did10_div_mhv)
## [1] 111
lihtc_did19_div_mhv <- svi_divisional_lihtc_df %>%
  filter(!is.na(Median_Home_Value_10adj_log)) %>% filter(!is.na(Median_Home_Value_19_log)) %>%
  select(GEOID_2010_trt, cbsa, Median_Home_Value_19_log, lihtc_flag) %>%
  mutate(post = 1,
         year = 2019) %>%
  rename("treat" = "lihtc_flag",
         "MEDIAN_HOME_VALUE" = "Median_Home_Value_19_log")


nrow(lihtc_did19_div_mhv)
## [1] 111
lihtc_diff_in_diff_div_mhv <- bind_rows(lihtc_did10_div_mhv, lihtc_did19_div_mhv)

lihtc_diff_in_diff_div_mhv <- lihtc_diff_in_diff_div_mhv %>% arrange(post, treat, GEOID_2010_trt)

nrow(lihtc_diff_in_diff_div_mhv)
## [1] 222
Divisional House Price Index
lihtc_did10_div_hpi <- svi_divisional_lihtc_df %>%
  filter(!is.na(housing_price_index10_log)) %>% filter(!is.na(housing_price_index20_log)) %>%
  select(GEOID_2010_trt, cbsa, housing_price_index10_log, lihtc_flag) %>%
  mutate(post = 0,
         year = 2010) %>%
  rename("treat" = "lihtc_flag",
         "HOUSE_PRICE_INDEX" = "housing_price_index10_log")


nrow(lihtc_did10_div_hpi)
## [1] 45
lihtc_did20_div_hpi <- svi_divisional_lihtc_df %>%
  filter(!is.na(housing_price_index10_log)) %>% filter(!is.na(housing_price_index20_log)) %>%
  select(GEOID_2010_trt, cbsa, housing_price_index20_log, lihtc_flag) %>%
  mutate(post = 1,
         year = 2020) %>%
  rename("treat" = "lihtc_flag",
         "HOUSE_PRICE_INDEX" = "housing_price_index20_log")


nrow(lihtc_did20_div_hpi)
## [1] 45
lihtc_diff_in_diff_div_hpi <- bind_rows(lihtc_did10_div_hpi, lihtc_did20_div_hpi)

lihtc_diff_in_diff_div_hpi <- lihtc_diff_in_diff_div_hpi %>% arrange(post, treat, GEOID_2010_trt)

nrow(lihtc_diff_in_diff_div_hpi)
## [1] 90
LIHTC Divisional Model
# SVI & Economic Models

m1_lihtc_div <- lm( SVI_FLAG_COUNT_SES ~ treat + post + treat*post + cbsa, data=lihtc_diff_in_diff_div_svi )

m2_lihtc_div <- lm( SVI_FLAG_COUNT_HHCHAR ~ treat + post + treat*post + cbsa, data=lihtc_diff_in_diff_div_svi )

m3_lihtc_div <- lm( SVI_FLAG_COUNT_REM ~ treat + post + treat*post + cbsa, data=lihtc_diff_in_diff_div_svi )

m4_lihtc_div <- lm( SVI_FLAG_COUNT_HOUSETRANSPT ~ treat + post + treat*post + cbsa, data=lihtc_diff_in_diff_div_svi )

m5_lihtc_div <- lm( SVI_FLAG_COUNT_OVERALL  ~ treat + post + treat*post + cbsa, data=lihtc_diff_in_diff_div_svi)

m6_lihtc_div <- lm( MEDIAN_INCOME ~ treat + post + treat*post + cbsa, data=lihtc_diff_in_diff_div_inc )

m7_lihtc_div <- lm( MEDIAN_HOME_VALUE ~ treat + post + treat*post + cbsa, data=lihtc_diff_in_diff_div_mhv )

m8_lihtc_div <- lm( HOUSE_PRICE_INDEX ~ treat + post + treat*post + cbsa, data=lihtc_diff_in_diff_div_hpi )

# Add all models to a list
models <- list(

  "SES" = m1_lihtc_div,
  "HHChar"  = m2_lihtc_div,
  "REM" = m3_lihtc_div,
  "HOUSETRANSPT" = m4_lihtc_div,
  "OVERALL" = m5_lihtc_div,
  "Median Income (USD, logged)" = m6_lihtc_div,
  "Median Home Value (USD, logged)" = m7_lihtc_div,
  "House Price Index (logged)" = m8_lihtc_div
)


# Display model results
modelsummary(models,  fmt = 2, stars = c('*' = .05, '**' = .01, '***' = .001), coef_omit = "cbsa", gof_omit = "IC|Log",
             notes = list('All models include metro-level fixed effects by core-based statistical area (cbsa).'),
             title = paste0("Differences-in-Differences Linear Regression Analysis of LIHTC in ", census_division)) %>%
  group_tt(j = list("Social Vulnerability" = 2:6, "Economic Outcomes" = 7:9))
| Social Vulnerability | Economic Outcomes | |||||||
|---|---|---|---|---|---|---|---|---|
| SES | HHChar | REM | HOUSETRANSPT | OVERALL | Median Income (USD, logged) | Median Home Value (USD, logged) | House Price Index (logged) | |
| (Intercept) | 2.69*** | 0.46 | 0.34*** | 2.91*** | 6.40*** | 9.10*** | 12.43*** | 5.11*** |
| (0.40) | (0.39) | (0.10) | (0.34) | (0.78) | (0.13) | (0.18) | (0.23) | |
| treat | 0.30 | 0.08 | -0.05 | 0.30 | 0.63 | 0.11 | 0.16 | -0.24 |
| (0.26) | (0.25) | (0.06) | (0.22) | (0.50) | (0.09) | (0.10) | (0.12) | |
| post | -0.37* | -0.26 | -0.01 | -0.16 | -0.80** | 0.13** | -0.11 | 0.34*** |
| (0.15) | (0.14) | (0.04) | (0.12) | (0.29) | (0.05) | (0.06) | (0.08) | |
| treat × post | -0.33 | 0.26 | 0.06 | 0.01 | 0.00 | 0.06 | 0.03 | 0.18 |
| (0.34) | (0.33) | (0.08) | (0.29) | (0.66) | (0.11) | (0.13) | (0.16) | |
| Num.Obs. | 212 | 212 | 212 | 212 | 212 | 212 | 200 | 88 |
| R2 | 0.349 | 0.496 | 0.670 | 0.391 | 0.465 | 0.407 | 0.732 | 0.539 |
| R2 Adj. | 0.266 | 0.432 | 0.627 | 0.313 | 0.396 | 0.331 | 0.695 | 0.419 |
| RMSE | 0.91 | 0.88 | 0.22 | 0.77 | 1.77 | 0.30 | 0.34 | 0.28 |
|
||||||||
| All models include metro-level fixed effects by core-based statistical area (cbsa). | ||||||||
Differences-in-Differences Linear Regression Analysis of LIHTC in West North Central Division
Results from the LIHTC divisional model show that, while all tracts experienced a modest but statistically significant decrease in SES-related vulnerability (post = –0.37, p < .05) and in overall SVI flag count (post = –0.80, p < .01) between 2010 and 2020, the treatment-by-period interaction (“treat × post”) is small and never reaches significance across any of the five SVI dimensions. In other words, although social vulnerability declined over time in this division, LIHTC-supported tracts did not exhibit an additional differential change in SVI relative to non-participating tracts.