COURSE CONTENT:
- Semester Overview
- Week 1 - Counterfactual Analysis
- Week 2 - Varieties of the Counterfactual
- Week 3 - Campbell Scores
- Week 4 - More Campbell Scores
- Week 5
- Week 6
Semester Overview
In the intro evaluation course you learned the basics of creating program input-output functions using regression models: for an additional input of X into the program (dollars of funding, time spent tutoring kids, reduction of class size) we expect to see a b1*X change in Y - the expected program effect.
You also learned that this estimate will only be causal if the program intervention is completely exogenous, or uncorrelated with all other competing explanations for the observed change in the data. This will only be true if the data is generated in an experimental setting so the treatment levels can be randomly assigned to program participants. That is the only way to ensure the policy or program variable (level of treatment received, for example the amount of caffeine in the pill) is uncorrelated with all other variables in the model.
Outside of an experimental setting each participant will choose their own behaviors, so caffeine consumption will be correlated with lifestyle, sleep deprivation, and income status - all things that can also influence the outcome. As a result, the slope b1 in the model will always contain bias from the omitted variables.
Heart Rate = b0 + b1*Caffeine + e
The sad reality of regression analysis using cross-section observational data is that you can almost NEVER add enough control variables to reliably eliminate omitted variable bias. At the same time, it is often impossible, unethical, or impractical to use randomized control trials to study program impacts. Many impact studies are requested after the policy or program has been implemented and thus rely on observational data, or else they are forced to use administrative data because experimental manipulation is unfeasible.
As a result, to produce causal estimates of program impact using observational or administrative data you will need to build a quasi-experimental toolkit that allows you to manipulate your data to create reasonable counterfactual comparisons that approximate causal estimates.
This course teaches the skills needed to design an impact evaluation using a counterfactual framework, select the most appropriate quasi-experimental estimator, and conduct the necessary checks to ensure that enough model assumptions have been met and sufficient competing hypotheses have been eliminated to comfortably claim you have identified an unbiased estimate of program impact.
No single study is ever definitive and no model produces a flawless estimate of policy or program impact. But that does not mean that program impact is not knowable or all estimates are equally as good. One of the goals of this course is for you to develop an intuitive sense of the quality of evidence presented in a study so that you can become a more astute consumer and producer of evaluations.
Randomized Control Trials (RCTs) are the gold standard in evaluation because they tend to produce the most accurate (least biased) estimates of program impact. But it actually takes a lot less skill and creativity to design an RCT than it does to design a rigorous quasi-experimental study. The tools taught in this course and in CPP 525 Advanced Regression are the things that will differentiate a talented and employable evaluation specialist that is sought out when the programs are high-stakes and stakeholders want actionable information versus a general evaluation specialist that is hired to produce compliance reports that will usually go into a file cabinet and not lead to program improvements or funding re-allocations.
Overview of Causality in Regression Studies
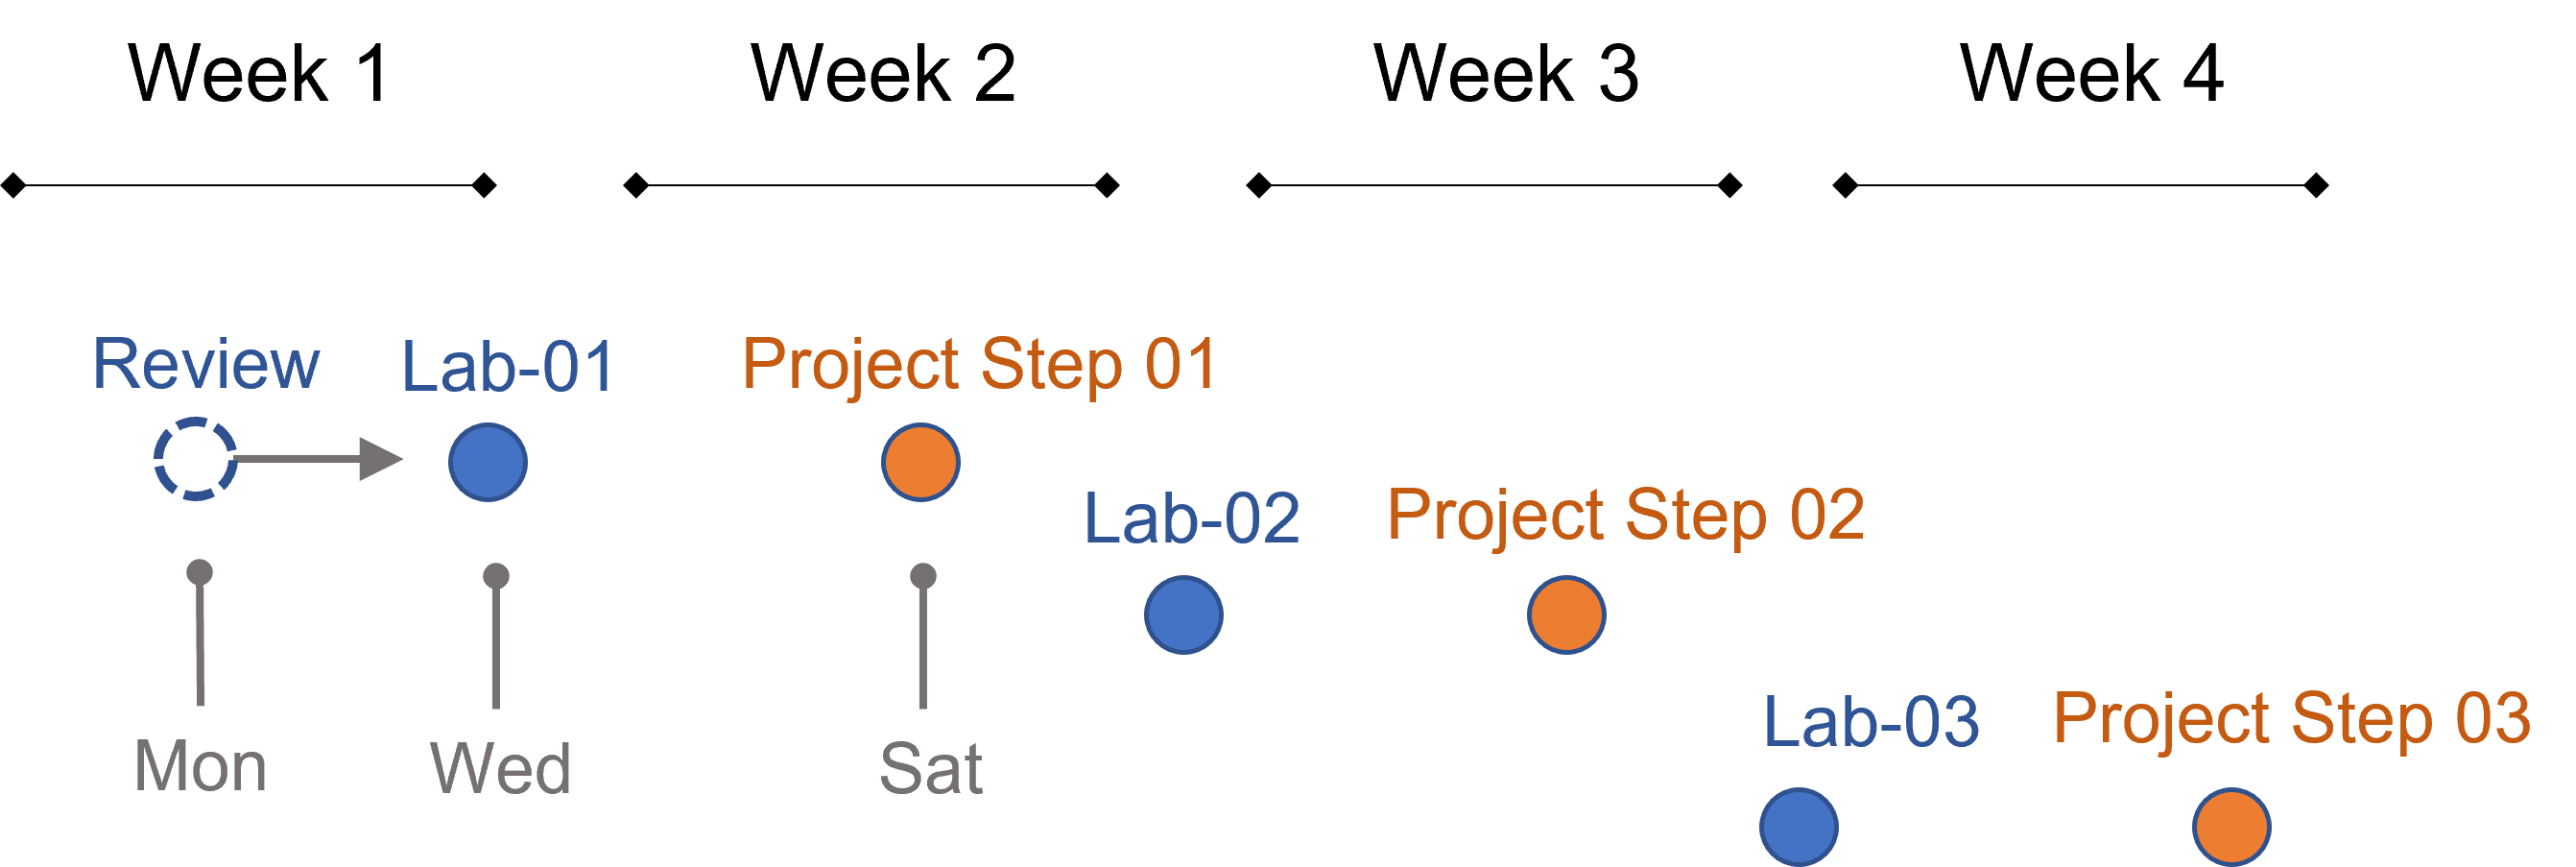
Course Cadence
You have weekly labs, a final project that requires you to design (but not implement) a hypothetical evaluation of a program or policy of your choice), and a low-stakes (10 point) final exam that gives you an opportunity to review and synthesize all of the course content so you can consolidate the information in your brain.
Each week labs are due Wednesday and a step for your research design project on Saturday. If you keep up with the research design steps and incorporate feedback you can minimize the end-of-semester bottleneck.
Get started early on labs so you have time to ask questions on the discussion board if you get stuck.
Labs are graded pass-fail. The criteria is that you demonstrate an understanding of the topics covered, which is typically operationalized as getting over half of the questions on the assignment correct.
The project steps are not graded until the final design proposal is submitted at the end, but you will recieve feedback on how much work needs to be done to improve each step to earn an A on the project.
The final exam is an open-book two-hour exam taken via Canvas. You can start it at any time during the final week of class, but once you start it you can’t pause it and finish it later.
Tips for Success
Similar to other core courses in this program there is no way to learn and retain all of this material in a semester.
We repeat some concepts from CPP 523 and introduce other concepts you will revisit in CPP 525 so that material is reinforced. Labs are an opportunity to test yourself and expand your vocabulary and regression skills. Active engagement on discussion boards and in review sessions is a great way to consolidate information in your brain. The biggest barrier to learning is often your own ego or lack of curiosity.
You are investing in a skill-set that you will build over time. You will find some material organized for quick reference on the Resources page.
You are encouraged to build your own library of sources you find useful and keep them for future reference.
Getting Help
Learning how to seek help and use discussion boards will accelerate learning and facilitate collaboration. Social coding tools like GitHub use these features extensively.
We are going to throw a lot at you, but also provide a lot of support. Over these first couple of weeks feel free to reach out for anything you might need.
If you find something confusing let us know (likely others will find it confusing as well).
- You can post a question to the homework discussion board.
- You can schedule a Zoom call to do a screen share if you want to walk through anything.
- Or you can request a walk-through of a problem. The instructor will provide an example with the solution.
As a general rule of thumb, if you are stuck on the math or code for a problem, need clarification about what the question is asking, want to make sure you understand a formula, or are having similar issues then the help discussion page is the easiest and quickest way to get help.
If you are confused about concepts or having a hard time even formulating your question then virtual office hours are your best option.
Note that the discussion board is hosted by the GitHub issues feature. It is a great forum because:
- You can format code and math using standard markdown syntax.
- You can cut and paste images directly into the message.
- You can direction responses using @username mentions.
Please preview your responses before posting to ensure proper formatting. Note that you format code by placing fences around the code:
```
# your code here
lm( y ~ x1 + x2 )

# formulas
y = b0 + b1•X1 + b2•X2 + e
b1 = cov(x,y) / var(x)
```
The fences are three back-ticks. These look like quotation marks, but are actually the character at the top left of your keyboard.
Week 1 - Counterfactual Analysis
Overview
This section provides introduces the concept of a counterfactual reasoning. Key terms include:
- randomized control trials (RCTs)
- average treatment effects
- internal validity
- null hypothesis
Learning Objectives
Once you have completed this section you will be able to construct key elements of a randomized control trial to determine if it has been implemented correctly.
Lab Preview
For Lab-01 you will read an example of a Randomized Control Trial used to study a nutrition and early childhood education program in Columbia.
Bingham, R., & Felbinger, C. (2002). Evaluation in practice: A methodological approach. CQ Press.
- CH-05: Improving Cognitive Ability in Chronically Deprived Children [pdf]
The lab asks for you to report on features of the research design and identify core concepts in the study:
- The control group
- The program theory
- The treatment
- Treatment duration vs study length
- Confounding factors
Required Reading:
Core Concepts in Research Design
Gertler, P. J., Martinez, S., Premand, P., Rawlings, L. B., & Vermeersch, C. M. (2016). Impact evaluation in practice. The World Bank. [pdf]
- Chapter 3. Causal Inference and Counterfactuals
- Chapter 4. Randomized Selection Methods
Background:
Reichardt, C. S., & Bormann, C. A. (1994). Using regression models to estimate program effects. Handbook of practical program evaluation, 417-455. [ pdf ]
Lab 01
Due Wednesday, Oct 20th
This lab covers Counterfactual Reasoning with RCTs
- Randomization processes
- Complex control groups
- Program “treatment”
- Theory of change
Read: Bingham, R., & Felbinger, C. (2002). Evaluation in practice: A methodological approach. CQ Press.
- CH-05: Improving Cognitive Ability in Chronically Deprived Children [pdf]
Answer the questions in the word document:
Save it using the naming convention:
Lab-##-LastName.doc
And submit via Canvas.
Final Project Step-01
Due Saturday, Oct 23rd
Your final project in this course is a memo that outlines a proposed research design that would be necessary to measure impact of a policy or program if a Randomized Control Trial is disallowed for practical or financial reasons (pedagogically because it solves many of your internal validity issues - this class is an opportunity to practice quasi-experimental approaches to causal inference).
Step 01 - Pick Your Topic
For the first step of your project you will fill out a one-page form to describe your proposed study with details on the program you will evaluate, the outcome of interest, and the population targetted by the program.
This first step is designed to get feedback from the instructor in order to ensure you have picked an appropriate topic for the assignment.
See page 4 of the project instructions PDF for an example of Step 01 memo format:
Week 2 - Varieties of the Counterfactual
Overview
This week introduces the notion of counterfactual reasoning using quasi-experimental design.
Learning Objectives
- Be able to define and explain what is meant by “counterfactual reasoning” broadly.
- Explain the three primary counterfactuals in all statistics models.
- Pre-post with comparison group design
- Post-test only design
- Reflexive design
- Apply the appropriate tests to determine whether the counterfactual is appropriate and robust.
- Pre-study equivalence
- Tests for non-random attrition
Lecture Materials
Introduction to Counterfactuals
Testing the Counterfactual Validity
Varieties of the Counterfactual
Review Use of Dummy Variables in Regression:
Suggested Reading:
Cook, T. D., Scriven, M., Coryn, C. L., & Evergreen, S. D. (2010). Contemporary thinking about causation in evaluation: A dialogue with Tom Cook and Michael Scriven. American Journal of Evaluation, 31(1), 105-117. [ LINK ]
Skim: Gertler, P. J., Martinez, S., Premand, P., Rawlings, L. B., & Vermeersch, C. M. (2016). Impact evaluation in practice. The World Bank.
- CH5 Regression Discontinuity Design
- CH6 Difference in Difference Models
- CH7 Matching
Key Take-Aways
We rarely have the resources or opportunity to utilize Randomized Control Trials (RCTs) in policy and management. There is a growing field of quasi-experimental methodologies that allow us to reproduce many of the features of RCTs to make strong causal claims when certain conditions are met.
Lab 02
Due Wednesday, Oct 27th
PART I: TESTS FOR GROUP EQUIVALENCE
PART II: IN THE NEWS
Apples to Apples:
Counterfactuals are simultaneously very intuitive and very challenging.
Most people are familiar with the concept, if not the term. How often do you hear the phrase:
That’s not an apples to apples comparison!
There’s even a board game based off of this expression.
On the other hand, it can be hard to tell whether a comparison is REALLY apples to apples.
Hidden Counterfactuals
This assignment is designed to help you be a more astute reader of research, or evidence-adjacent claims. For the sake of this class we will think of evidence primary in terms of claims of causality after some intervention occurred.
Ideally you don’t listen to new scientific findings and immediately categorize it in your mind as TRUE or FALSE. Rather, the quality of research can be described as a spectrum, or perhaps a 10-point scale.
If you get really good at research design then you will start to consume news stories that make causal claims differently. When you hear a surprising or interesting finding the first question should be, how do we know this? What type of evidence do we have?
The best way to assess the quality of evidence is focusing on how the study created the counterfactual, and whether we believe it is a proper way to make inferences about the intervention described.
This is often quite challenging! Partly because it is challenging creating strong counterfactuals within a study. And partly because the media often does a poor job at describing research design while reporting on results. If it’s published it must be true, right?
This short video presents lots of good examples from popular media where apples to oranges comparisons are used to provide evidence for a theory or position:
For your discussion this week, search through recent news stories until you find a story that is reporting on scientific work and making a claim. You can pull from whatever research you like, but limit studies to ones that look at topics that can be packaged as treatments (exercise prevents dimentia, people that drink coffee make more money, etc.). In other words, the recent support for string theory based upon data from the Hedron collider would be hard to package as an intervention. I recommend going to Google news and looking in the health or science sections.
Find a story reporting on research that was published in PEER-REVIEWED academic outlets. From what you can find in the news story, can you tell whether the study used an apples to apples comparison? How much information do you have about the study group, and how much detail do they provide about the construction of a “treatment” group and a “comparison” group?
Report your findings on YellowDig with a link to the news story.
As an example, here is an excerpt from the story, Meat-free diet may lower severe disease risk.
People on meat-free diets had lower odds of contracting moderate to severe COVID-19, according to a six-country study published on Monday in BMJ Nutrition, Prevention & Health. Plant-based diets were tied to a 73% lower risk of severe disease, researchers found in a survey of 2,884 healthcare providers who cared for COVID-19 patients. Combining those on a plant-based diet and people who also ate fish but no meat, researchers found 59% lower odds of severe disease.
But plant-based diets are rich in nutrients, vitamins and minerals that are important for healthy immune systems, the researchers noted, and fish provide vitamin D and omega-3 fatty acids, which have anti-inflammatory properties.
Is this an apples to apples comparison?
Do we believe that vegetarians are identical to those that eat meat in all ways except that one behavior (there was no assignment to groups, it is observational)?
Is this a causal story? Or is the mechanism something besides diet?
Final Project Step-02
Due Saturday, Oct 30th
Measure Your Outcome
You need to identify one to three metrics that will be used to measure the outcome in your study.
(1) Start by defining the outcome conceptually in terms of what you actually want to measure, i.e. kids in school should develop quantitative reasoning skills (concept) and not standardized math scores (the measure used to proxy quantitative reasoning). In microfinance the impact might be quality of life, not repayment rates or daily income measures.
(2) After you have identified the types of impact the program wishes to achieve you will find validated instruments that can be used to measure the outcome. See the instructions for details about validated instruments.
You will report the instrument(s) and their reliability measures.
What is an “instrument” in social science?
Many variables studied by psychologists are straightforward and simple to measure. These include sex, age, height, weight, and birth order. Age is measured as days since birth. Weight can be measured with a scale. Other variables studied by psychologists—perhaps the majority—are not so straightforward or simple to measure. We cannot accurately assess people’s level of intelligence by looking at them, and we certainly cannot put their self-esteem on a bathroom scale. These kinds of variables are called LATENT CONSTRUCTS (pronounced CON-structs) and include personality traits (e.g., extraversion), emotional states (e.g., fear), attitudes (e.g., toward taxes), and abilities (e.g., athleticism).
[ From: Understanding Psychological Measurement ]
Often times the outcomes in evaluation studies are latent constructs (for example wealth, health, and happiness as well as almost anything related to performance). As a result, they cannot be directly observed or measured through physical instruments. They are typically measured through social science instruments, which are typically questionaires that contain sets of questions that are combined into an index. The index is designed to capture the underlying construct with high fidelity, and present a quantitative measure of the level of the underlying construct. For example, an IQ test provides a robust predictor of a person’s ability to perform on reasoning exercises and cognitive tasks. The underlying construct is “general intelligence” (the thing correlated across a person’s ability in all individual subjects), and the instrument is the specific IQ exam that is used to assign a score on a scale of 50 to 150 (lower and higher scores are possible, but they are often considered dubious). These are construct measures.
The process of developing a valid and reliable instrument that serves as a construct measure is extremely time and resource intensive. It involves the careful consideration of the actual construct of interest andd process of trial, error, and calibration to create a small set of items that can accurately measure the latent construct.
We are so accostomed to using proxy measures that we often forget they are just a placeholder for the thing we really care about. For example, the early field of economics crystalized around the construct of societal well-being. As it evolved into a mathematical science that required empirical, quantitative measures of societal well-being it began using the short-hand that utility increases with wealth, so wealthier societies are better off. Progress became measured in Gross Domestic Product (GDP) instead of utils (units of utility). We now frequently rank countries by per capita income, assuming it is more rigorous than a squishy construct like Gross National Happiness (GDH), even though that is closer to the original construct of well-being.
Social science instruments have typically been created by enumerating a large number of questions or observations that might capture a specific construct, then field-testing them to generate raw data, which is then used to look for items (questions on the questionaire) that are highly-correlated, suggesting they are all measures of the same underlying construct. They are then calibrated and potentially weighted to determine each question’s contribution to the final index score.
The result is a tool that can be used by a wide variety of researchers or evaluators to derive a quantitative measure of the thing that is very difficult to observe passively. If the tool is valid and reliable, then it should provide consistent metrics that can be used to compare individuals and groups.
If your desire more backgroud, the following textbook chapter provides a nice summary of measurement theory in social science research:
Kimberlin, C. L., & Winterstein, A. G. (2008). Validity and reliability of measurement instruments used in research. American journal of health-system pharmacy, 65(23), 2276-2284. [ pdf ]
INSTRUCTIONS:
This project step has two parts:
PART ONE:
Get familiar with existing valid instruments used frequently in social sciences.
(1) Select one of these four instruments:
- SF-36 Measure of Health [ questions ] [ benchmarks pp 3135-3136 ]
- Oxford Happiness Index [ questions & benchmarks ] [ reliability ]
- Grit (Duckworth index) [ questions ] [ benchmarks & reliability ]
- The Big Five (personality index) [ questions & benchmarks ] [ scoring ]
Select a different instrument if you have done this exercise in another class, or find an instrument not mentioned here.
(2) Complete the questionaire and calculate your score using the instructions provided for each instrument.
(3) Use the guides to determine if your score is low, average, or high relative to the general population.
(4) After completing (1)-(3) present an evaluation of the instrument to your classmates via a YellowDig post.
Specifically, reflect on the challenges of creating strong instruments. Did you find your questionaire easy to complete? Do you think it will really capture the underlying latent constructs it was designed to measure? What is hard about measuring the construct of interest?
Is there something else you have learned about instrument design through this exercise? Something you found interesting? Questions that were raised by the exercise?
You do NOT have to report your scores from (2) and (3) on YellowDig.
You will spend more time on instrument development in other courses, so this exercise is meant as an introduction (or review), and a chance to familiarize yourself with some popular instruments.
PART TWO:
Question 1:
Identify a potential outcome in your proposed study that is a latent construct. In very general terms describe the construct and explain why it is an appropriate outcome for the study.
Question 2:
Explain what makes it a latent construct.
Question 3:
Identify a valid and reliable instrument that can be used to measure the latent construct.
I would suggest using a google search to identify some possible measures of your construct with search terms like “measure of”, “instrument”, “items”, “reliability”, etc.
Then search within an academic database like Google Scholar for an academic paper that has created a reliability score for the measure you found.
For example, you could use “instrument” + “grit” to identify the survey used by Duckworth to measure grit in the examples above.
For the instrument to produce a reliable measure of your construct there must be a scientific article published in a peer-reviewed journal that explains the instrument development process and reports a Cronbach’s Alpha or similar alpha score above a 0.7.
In this context alpha refers to a reliability measure for the instrument on a scale of zero to one, NOT the confidence level in a hypothesis test (also called alpha).
You will cover Cronbach’s Alpha more in other courses as well. For now note it is a measure of reliability (scale of 0 to 1) and most importantly a signal that the instrument was developed by trained psychometricians using appropriate scientific methods. There are many instruments that have not been properly tested and subjected to peer-review, and thus might not actually measure what it claims to measure.
Report your selected instrement and describe the questionaire (number of items, example questions, how they are aggregated into a single score, etc.).
As a professional evaluator, if you are ever hired to work in a new field you will often begin the work by finding some validated instruments that would be appropriate for the program of interest, so it is useful getting familiar with the process of searching for new ones and evaluating their quality.
Question 4:
Save a PDF of the academic article that describes the instrument. Submit this with your answers to questions 1-3.
PART THREE: CPP 523 REVIEW
Question 1:
How does measurement error in the DEPENDENT VARIABLE impact your estimate of program impact?
Question 2:
How does measurement error in the POLICY VARIABLE impact your estimate of program impact?
For example, classroom size is taken from administrative records from the first day of class, but a few students change sections in the second week so actual classroom size throughout the year might be off by a few.
Question 3:
Does the alpha metric (like Cronbach’s alpha) describe measurement error in a variable?
When you have completed the steps:
Measurement Theory
Useful background reading or reference chapters:
Measurement Theory and Practice, from: Smith, F. (2002). Research methods in pharmacy practice. Pharmaceutical Press. [ pdf ]
MacKenzie, S. B., Podsakoff, P. M., & Podsakoff, N. P. (2011). Construct measurement and validation procedures in MIS and behavioral research: Integrating new and existing techniques. MIS quarterly, 35(2), 293-334. [ pdf ]
Schäffer, U. (2007). Management accounting & control scales handbook. Springer Science & Business Media. [ full text ]
Week 3 - Campbell Scores
Overview
This unit introduces a framework for evaluating the internal validity of a study using a 10-item “Campbell Score”.
The tool helps you develop the skill of reading research in a systematic fashion to identify the subtle details that impact research quality. In doing so it also helps you develop intuition about how to better design your own studies, and how to communicate study design to stakeholders.
Learning Objectives
After mastering Campbell Scores you will be able to:
- Identify weaknesses in the design or implementation of evaluation studies that pose threats to internal validity and can possibly undermine the results.
- More efficiently read evaluation studies by knowing specific tests the author should present to make their case.
- Develop intuition about how to best design your own evaluation studies and how to package the description of your research design so that it is accessible to others.
Lecture Materials
From Last Week:
Introduction to Counterfactuals
The Three Counterfactual Estimators
New This Week:
Lab 03
Due Wednesday, Nov 3rd
Campbell Scores
This lab is a chance to practice an essential skill in evaluation - critical evaluation of research design to assess the strength of claims made by the study.
You will be reviewing the following chapters from Bingham, R., & Felbinger, C. (2002). Evaluation in practice: A methodological approach. CQ Press.:
You will report the result for each item of the Campbell Score for each study and give your reasoning for the score on each item (a +1 if the threat to validity or competing hypothesis is adequately neutralized in the study, and +0 if the threat was not eliminated). Here are some example solutions based upon CH5 that you reviewed for the first lab.
Final Project Step-03
Due Saturday, Nov 6th
Step 03 - Theory of Change
Each program has a theory of change that is used to articulate the intended program steps and the relationships between program activities and client outcomes.
For this step you will learn how to diagram a theory of change and describe your program elements.
Before completing Step 03, read the following documents that describe the theory of change methodology. Start with an example that walks through the steps for a specific program:
Then read the guide to creating a theory of change:
These steps are marked for feedback but not graded.
When you are complete submit your section draft:
You may find these additional background readings helpful:
Week 4 - More Campbell Scores
Overview
This week you will continue with your critical assessment of research design to assess internal validity in the case studies using the Campbell Scores framework.
Lecture Materials
There are no new lecture materials. But these exercises will again draw from the notes on counterfactual reasoning and Campbell Score rules:
- Introduction to Counterfactuals
- Tests for CF Validity
- The Three Counterfactual Estimators
- Campbell Scores Overview
- Campbell Scores Examples
Case studies will again be from Bingham, R., & Felbinger, C. (2002). Evaluation in practice: A methodological approach. CQ Press.
Lab 04
Due Wednesday, Nov 10th
For this lab you will again apply Campbell Scores to two more chapters, but this time both chapters are using the same data to answer the same research question. This is a nice case study because it shows how two groups of skilled researchers can make different choices about how to analyze data, and as a result arrive at different conclusions about program effectiveness.
Evaluation of School Choice Program
The last two chapters present a bit of a riddle. You have two studies evaluating the exact same program using the same data, but they come to different conclusions (CH20 concludes that the program is ineffective, CH21 concludes it is effective). So how do the studies differ?
CH21 uses a strong counter-factual whereas CH20 uses a weak comparison group. This itself could account for the difference in results. But more importantly, each chapter uses a different calculation for the program effects (recall the choices are pre-post reflexive designs, post-test only comparisons, and the difference-in-difference estimates). If you can figure out how the authors are calculating program effects, you will have much better insight into why the conclusions diverge.
There is a lot of material in CH20, so focus on Tables 10A-10D and the regression models in 11A and 11B.
Also, what are the time-frames used for analysis in each chapter? Be careful about how you define time-frame in this assignment. In these chapters, the time-frame is a function of how the authors are calculating program effects more than the period over which data was collected.
Here is the hint: if a study collects data over four years but then only uses data from one of the years for analysis, what would the time frame of the study be, four years or one?
When you are complete:
Final Project Step-04
Due Saturday, Nov 13th
Step 04 - Diagram Your Counterfactual
Review the following example that walks through the steps of diagramming a counterfactual as part of a research design exercise.
Then complete the following project step:
When you are complete submit your section draft:
Week 5
Overview
This final lab offers an opportunity to synthesize material on counterfactuals by calculating program impact in a couple of different ways with the same data set and thinking about which estimator (counterfactual) best suits the research question.
You will revisit the evaluation from Lab 1:
Bingham, R., & Felbinger, C. (2002). Evaluation in practice: A methodological approach. CQ Press.
- CH-05: Improving Cognitive Ability in Chronically Deprived Children [pdf]
You will compare program effects generated by the three different estimators (reflexive, post-test only, and diff-in-diff), as well as run identification tests to see if model assumptions are met. The regression models are provided. Your job is to see whether you are able to interpret the coefficients correctly in each model and determine which counterfactual is deployed in each case.
Some estimators will be valid in this context (will accurately capture program effects), and some will not. Your job is to compare models, check assumptions, and determine which estimates you believe to be appropriate. Write up your argument and submit via Canvas.
Lab 05
Due Wednesday, Nov 17th
Week 6
Optional Labs
Due Friday, Dec 3rd
Lab 6 is an optional lab that you can complete to get more exercise with regression models, or if you missed a previous lab and would like to recover points.
Research Design Memo
Due Sat Nov 27
Choose a well-established program that has a clear goal, a clear scope, and where you expect to achieve impact in a relatively short time frame (a few years). The point of the assignment is to practice thinking through and communicating important evaluation considerations.
Keep the program model simple! If you select a complicated program that has poorly-defined goals and has a complex implementation environment it will be difficult to tell whether things are not clear because you do not understand the program or you do not understand the material. So keep the program model as simple as possible. You can limit the scope by designing the evaluation for a small part of a larger program.
By the time you are done writing up details you will likely have 10 to 20 pages of text (double-spaced).
Submit Your Paper
Final Exam
The final exam will be open: Mon Nov 29 - Fri Dec 3
You will have 2 hours to complete the exam once you start, but you cannot start, pause, and come back to it.