Join the MS-PEDA Community
Join the MS-PEDA groups on Linked-In or Facebook to meet alumni and stay connected to the program.
Resources
Here are some resources to get you started with the course and to help with projects, as well as offer background on cool data science projects in the social sector.
Just like learning a new language, there is no way to become fluent in a semester or a year. You can, however, become conversant enough to start traveling extensively in this new world of data science. Much of it has been built in virtual settings, and you will be amazed at how many free resources are available when you know how and where to look.
R Cheat Sheets
Cheat sheets are parsimonious and stylized notes that help organizat functions and syntax so it is easier to learn and find. R Studio has an extensive list of R Cheat Sheets that you might find helpful.
R Studio Resources for Beginners
R Exercises
Short exercises on basic R skills [ link ] Tutorials from Rexercises [ link ]
The Data Science Ecosystem
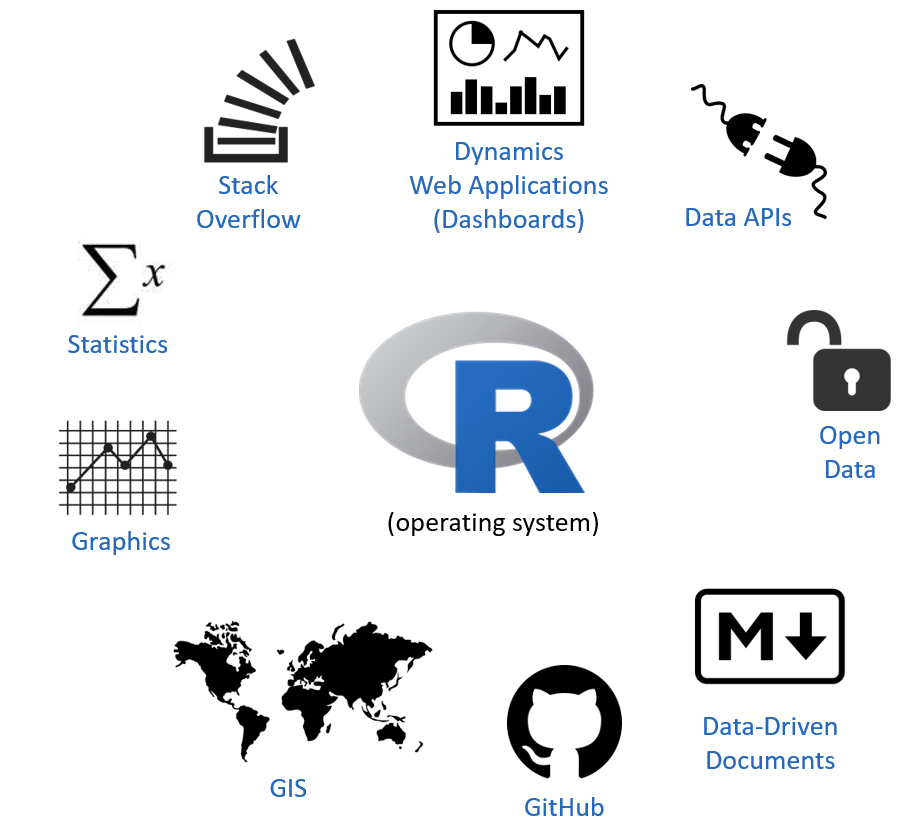
Pete Warden created one of the first data science toolkits, which was a collection of open-source tools for common tasks in data science like turning street addresses into geo-coordinates, extracting sentiments from text, and identifying people’s names in documents. The original toolkit started out as a simple website with a couple of dozen of these tools (the original website is defunct but you can still use the tools through the RDSTK Package ).
The R community has taken this to another scale. There are currently 13,000 free and open-source packages available in R. It is better to think about R as an operating system, and the contributed packages as the programs you use for specific tasks.
In addition to packages created for R, there are also powerful tools that make it easier to share data, collaborate on work, and share your results in creative ways. One of the reasons R has become an industry favorite is that it is highly integrated into this ecosystem. Many of these tools are built-right into R Studio, making it easier to manage large projects or collaborate.
A big part of this course is learning about some of these resources and how they fit together to improve work-flow, analysis, and reporting. The most powerful tool that you will discover, however, is the community of smart and creative people active in the field of data science. Some are engineers working on solutions to hard technical problems in the open source space, but most are regular users such as data analysts, artists, educators and activists. Once you understand a few foundational concepts and develop a rudimentary vocabulary you can tap into the community through message boards and list-serves. See the Get Help tab for rules to follow as a good community member.
Data-Driven Documents
For the purpose of transparency and reproducibility, as well as simple convenience, there is high demand for documents that combine typical elements of publications and reports such as text, tables, graphs and images, and the code that was used to create the analysis presented in the text. These efforts have largely converged on Markdown as a simple publishing language, and derivations like R Markdown to incorporate output from models into documents.
Markdown is a simple set of rules used to format text and images. Formatting it accomplished by adding tags to text.
# H1
## H2
### H3
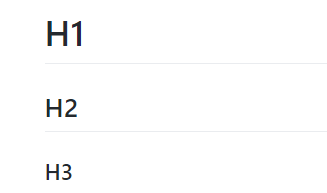
The basics are very easy to master by referencing a basic Cheat Sheet.
But don’t let the simplicity fool you. Markdown documents are extremely versatile and powerful. Using the same text and code in a document, minor changes can be made to select a variety of document outputs that best meet the needs of the client or team. For example, check out the diversity of formats available in the R Markdown Gallery.
R Studio makes it easy to create R Markdown documents, and you can select the format by changing the output type. Perhaps you have a regular report created as an HTML page:
---
output: html_document
---
And you want to re-organize the material into a dashboard. Simply change the output type:
---
output: flexdashboard
---
Then add a few page dividers, and your analysis will now be organized something like this StoryBoard.
Markdown is used on GitHub, Stack Overflow, and in R Markdown documents. Familiarity with the basics offers a lot of power in controlling how your analysis is presented to your audience.
You can see some advanced R Markdown features HERE.
Shiny Apps
Want to build dynamic applications? Learn more about R Shiny apps and fully custom R Shiny Dashboards.
Collaboration Tools
Working in groups is hard. Most work is done in groups. As a result, project management is a non-trivial task that should not be approached in an ad-hoc fashion. The field of data science has inherited many great collaboration tools that were developed to manage large teams of software engineers, but are being used for many other creative purposes:
Install GitHub in R Studio
This course will introduce students to GitHub, one of the most popular collaboration and publishing platforms used by the open source community. GitHub is integrated into R Studio for easy deployment.
Here are some resources for configuring GitHub to work with R Studio:
Installing R
R is a programming langauge that was designed specifically for data analysis. Along with Python, it is the most popular tool used by data scientists, data journalists, and quantitative social scientists.
R in 60 Seconds:
See some tips on installing R and R Studio.
Installing Packages in R
A large part of R’s popularity is it’s enormous library of custom programs, called packages. If you know the package name, they are easy to install and load.
install.packages( "dplyr" )
library( dplyr )
Note that quotation marks are mandatory during the install phase, but optional during the load phase. There are good reasons for this that will not be discussed here. Be sure to remember the quotes or you will get an error.
With 13,000 available packages, it can be hard to find the ones that are most useful for your task at hand. The R Team has tried to make it a little easier by organizing packages into a Task Views library.
One of the most useful packages is called The Tidyverse. It’s actually a collection of packages developed by the R Studio team to make basic data processing steps faster and more reliable. They also make it easy to install all of the packages at once by calling:
install.packages("tidyverse")
library(tidyverse)
More Resources
For those that are new to data science, I have compiled some useful resources for getting acquainted with R and the data science community, as well as some notable applications of data science in the public and nonprofit sectors.
DS4PS (Data Science for the Public Sector) Site