
Part I - Custom Reporting Functions
For Part I on this lab you will learn how to create a template function for use in RMD docs.
You will convert the following R Epidemics Member Gallery into a RMD format:
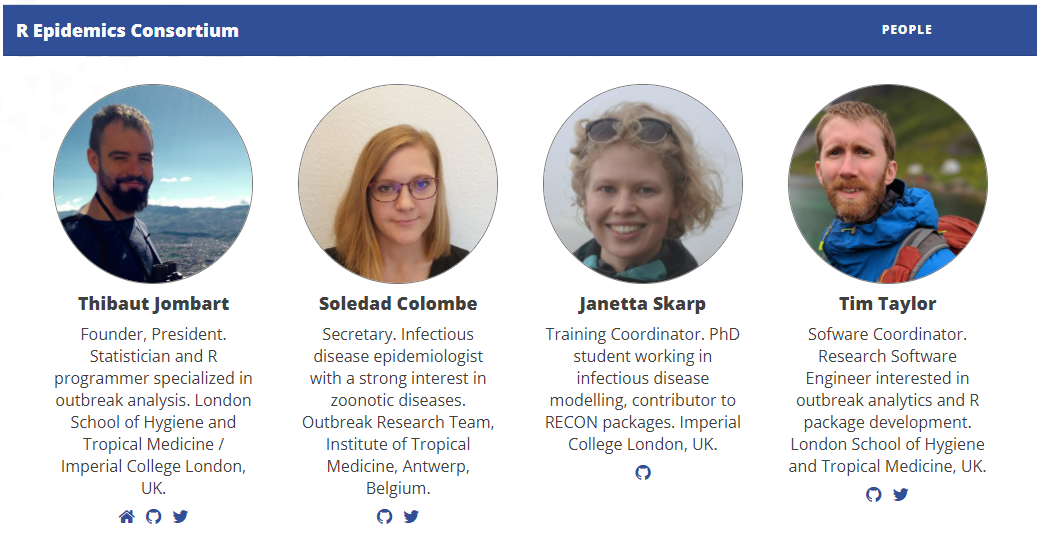
In order to do this you will replicate the existing gallery template (HTML template using liquid tags) by creating your own R function to build this identical gallery in an RMD doc.
The YAML data on the website looks like this:
people-list:
  - name: Thibaut Jombart
    img: /img/people/thibaut-jombart.jpg
    desc: Founder of RECON. Statistician and R programmer specialized in outbreak analysis. Imperial College London, UK.
    website: https://sites.google.com/site/thibautjombart/
    url: https://sites.google.com/site/thibautjombart/
    github: https://github.com/thibautjombart/
    twitter: https://twitter.com/TeebzR
  - name: Dean Attali
    img: /img/people/dean-attali.jpg
    desc: Web and R developer, designer of the RECON website. Canada.
    website: http://deanattali.com/
    url: http://deanattali.com/
    github: https://github.com/daattali/
    twitter: https://twitter.com/daattali
You can view the original HTML template in the file list-circles.html. It uses liquid tags to convert all of the team member data from the YAML fields into HTML profiles.
Intuition
When the YAML data is rendered by the gallery template it is converted to HTML sections like the following:
Data:
  - name: Thibaut Jombart
    img: /img/people/thibaut-jombart.jpg
    desc: Founder of RECON. Statistician and R programmer specialized in outbreak analysis. Imperial College London, UK.
    website: https://sites.google.com/site/thibautjombart/
    url: https://sites.google.com/site/thibautjombart/
    github: https://github.com/thibautjombart/
    twitter: https://twitter.com/TeebzR
Data after conversion to HTML will look like this:
<div class="list-circles-item">

	<a href="https://thibautjombart.netlify.com/"><img src="/img/people/thibaut-jombart.jpg" class="item-img"></a>

	<h4 class="item-name">Thibaut Jombart</h4>
	<div class="item-desc">Founder, President. Statistician and R programmer specialized in outbreak analysis. London School of Hygiene and Tropical Medicine / Imperial College London, UK.</div>

	<div class="item-links">

	   <a class="item-link" href="https://thibautjombart.netlify.com/" title="Website">
	   <svg><path d="..."/></svg>   /* --- abbreviated --- */
	   </a>

	   <a class="item-link" href="https://github.com/thibautjombart/" title="GitHub">
	   <svg><path d="..."/></svg>   /* --- abbreviated --- */
	   </a>

	   <a class="item-link" href="https://twitter.com/TeebzR" title="Twitter">
	   <svg><path d="..."/></svg>   /* --- abbreviated --- */
	   </a>

	</div>

</div>
So you basically need to add HTML tags around all of the data stored in the YAML table to replicate the HTML code above.
Step 1
Create a new RMD file using the following settings:
---
title: 'Lab 06'
output:
  html_document:
    theme: readable
    df_print: paged
    highlight: zenburn
    toc: true
---
Step 2
Select three team members from the R Epidemics Consortium page and create a data frame with their information from the YAML fields (see Step 3 for the variable names).
Create the data frame manually:
- Create vectors for each information type (WEBSITE, NAME, etc) and add items from three people on the team.
- If a person does not list information for an item use an empty string (“”) as a placeholder in the vector.
- Bind the vectors together into a data frame using the data.frame() function and call it dat.
Step 3
Write an R function called build_circle() that will create a single member profile for the team gallery page.
It should use the following arguments:
- WEBSITE - personal website URL
- IMG - full URL of profile photo of a team member
- NAME - team member full name
- DESC - one sentence bio
- GITHUB - URL of personal GitHub page
- TWITTER - Twitter URL
Note that IMG in the YAML header is a relative path “/img/people/thibaut-jombart.jpg”
For the assignment use the full URL: “https://www.repidemicsconsortium.org/img/people/thibaut-jombart.jpg”
This loads the image from their site. It’s not a good practice to embed images using an external URL because if they make changes it can impact your page. But this is a demo assignment and it gets more complicated if you need to bundle an images directory to do a simple demo.
Example use - create a circle item for one team member:
build_circle( WEBSITE="https://sites.google.com/site/thibautjombart/",
  IMG="https://www.repidemicsconsortium.org/img/people/thibaut-jombart.jpg",
  NAME="Thibaut Jombart",
  DESC="Founder of RECON. Statistician and R programmer specialized in outbreak analysis. Imperial College London, UK.",
  GITHUB="https://github.com/thibautjombart/",
  TWITTER="https://twitter.com/TeebzR"
)
Your function will convert R objects to HTML using the following code logic:
- add the appropriate tags to the strings using paste0()
- return the string literal from the function using cat()
name <- "RUBY TUESDAY"
title <- "TOP DOG"

add_tags <- function( name, title )
{

  cat( paste0( '<tag> ', name, ' </tag>' ) )
  cat( '\n' )  # line break
  cat( paste0( '<div class="title"> ', title, ' </div>' ) )
  cat( '\n' )  # line break

}

add_tags( name, title )  # test it:

<tag> RUBY TUESDAY </tag>
<div class="title"> TOP DOG </div>
The function should return the following HTML code with the argument names (anything in caps like WEBSITE, IMG, etc) replaced with their actual values (Thibaut Jombart, etc):
<div class="list-circles-item">

	<a href="WEBSITE"><img src="IMG" class="item-img"></a>

	<h4 class="item-name">NAME</h4>
	<div class="item-desc">DESC</div>

	<div class="item-links">

	   <a class="item-link" href="WEBSITE" title="Website">
	   <svg><path d="..."/></svg>   /* --- abbreviated fa.home svg --- */
	   </a>

	   <a class="item-link" href="GITHUB" title="GitHub">
	   <svg><path d="..."/></svg>   /* --- abbreviated fa.github svg --- */
	   </a>

	   <a class="item-link" href="TWITTER" title="Twitter">
	   <svg><path d="..."/></svg>   /* --- abbreviated fa.twitter svg --- */
	   </a>

	</div>

</div>
NOTE:
- paste0() is a convenient way to call paste( …, sep=”” ) without the extra argument since the default separator for paste() is a space (sep=” “).
- HTML tags use double quotes around arguments inside the tags, so enclose the HTML elements with single quotes to avoid conflicts.
paste0( '<a href="', WEBSITE, '"><img src="', IMG, '" class="item-img"></a>' )
Here is some code to get you started:
build_circles <- function( WEBSITE, IMG )
{

  cat( '<div class="list-circles-item">' )
  cat( '\n' )  # line break
  cat( paste0( '  <a href="', WEBSITE, '">' ) )
  cat( '\n' )  # line break
  cat( paste0( '  <img src="', IMG, '" class="item-img"></a>' ) )
  cat( '\n' )  # line break

}

build_circles( WEBSITE="https://sites.google.com/site/thibautjombart/",
               IMG="https://www.repidemicsconsortium.org/img/people/thibaut-jombart.jpg" )
<div class="list-circles-item">
  <a href="https://sites.google.com/site/thibautjombart/">
  <img src="https://www.repidemicsconsortium.org/img/people/thibaut-jombart.jpg" class="item-img"></a>
Tips for Adding Icons
You will add icons to the HTML using the fontawesome package. This will insert the icons as SVG objects (svg tags) instead of using span tags like in the example above.
Some code to get you started:
install.packages("fontawesome")
fontawesome::fa( name="github" )
fontawesome::fa( name="twitter" )
fontawesome::fa( name="home" )
Advice on turning the fa objects into text:
# - get icon svg object from font awesome
# - implicitly recast as text when added to HTML tags
# - cat() to export HTML from the chunk
# - make sure to include the chunk argument {r, results="asis"}

GITHUB <- "https://github.com/thibautjombart/"
fa.github <- fontawesome::fa( name="github" )
x <- paste0( '<a href="', GITHUB, '">', fa.github, '</a>' )
cat( x )
<a href="https://github.com/thibautjombart/">
<svg><path></svg>   /* --- abbreviated fa.github svg --- */
</a>
The full SVG+PATH tag will contain coordinates that the browser uses to draw the icon. It will look something like this:
<a href="https://github.com/thibautjombart/">

/* --- start fa.github svg --- */
<svg aria-hidden="true" role="img" viewBox="0 0 496 512" style="height:1em;width:0.97em;vertical-align:-0.125em;margin-left:auto;margin-right:auto;font-size:inherit;fill:currentColor;overflow:visible;position:relative;">
<path d="M165.9 397.4c0 2-2.3 3.6-5.2 3.6-3.3.3-5.6-1.3-5.6-3.6 0-2 2.3-3.6 5.2-3.6 3-.3 5.6 1.3 5.6 3.6zm-31.1-4.5c-.7 2 1.3 4.3 4.3 4.9 2.6 1 5.6 0 6.2-2s-1.3-4.3-4.3-5.2c-2.6-.7-5.5.3-6.2 2.3zm44.2-1.7c-2.9.7-4.9 2.6-4.6 4.9.3 2 2.9 3.3 5.9 2.6 2.9-.7 4.9-2.6 4.6-4.6-.3-1.9-3-3.2-5.9-2.9zM244.8 8C106.1 8 0 113.3 0 252c0 110.9 69.8 205.8 169.5 239.2 12.8 2.3 17.3-5.6 17.3-12.1 0-6.2-.3-40.4-.3-61.4 0 0-70 15-84.7-29.8 0 0-11.4-29.1-27.8-36.6 0 0-22.9-15.7 1.6-15.4 0 0 24.9 2 38.6 25.8 21.9 38.6 58.6 27.5 72.9 20.9 2.3-16 8.8-27.1 16-33.7-55.9-6.2-112.3-14.3-112.3-110.5 0-27.5 7.6-41.3 23.6-58.9-2.6-6.5-11.1-33.3 2.6-67.9 20.9-6.5 69 27 69 27 20-5.6 41.5-8.5 62.8-8.5s42.8 2.9 62.8 8.5c0 0 48.1-33.6 69-27 13.7 34.7 5.2 61.4 2.6 67.9 16 17.7 25.8 31.5 25.8 58.9 0 96.5-58.9 104.2-114.8 110.5 9.2 7.9 17 22.9 17 46.4 0 33.7-.3 75.4-.3 83.6 0 6.5 4.6 14.4 17.3 12.1C428.2 457.8 496 362.9 496 252 496 113.3 383.5 8 244.8 8zM97.2 352.9c-1.3 1-1 3.3.7 5.2 1.6 1.6 3.9 2.3 5.2 1 1.3-1 1-3.3-.7-5.2-1.6-1.6-3.9-2.3-5.2-1zm-10.8-8.1c-.7 1.3.3 2.9 2.3 3.9 1.6 1 3.6.7 4.3-.7.7-1.3-.3-2.9-2.3-3.9-2-.6-3.6-.3-4.3.7zm32.4 35.6c-1.6 1.3-1 4.3 1.3 6.2 2.3 2.3 5.2 2.6 6.5 1 1.3-1.3.7-4.3-1.3-6.2-2.2-2.3-5.2-2.6-6.5-1zm-11.4-14.7c-1.6 1-1.6 3.6 0 5.9 1.6 2.3 4.3 3.3 5.6 2.3 1.6-1.3 1.6-3.9 0-6.2-1.4-2.3-4-3.3-5.6-2z"/>
</svg>
/* --- end fa.github svg --- */

</a>
Note that if you are borrowing an HTML container from a website you like by copying the HTML+CSS to create a new template there may be some small differences between the website versions and the RMD template versions.
In this case browsers import font awesome libraries and embed icons using span tags. R uses the icons::fontawesome function and embeds svg tags. These create equivalent results using different HTML conventions:
# website version visible with "inspect"
<a><span class="fa fa-github"></span></a>

# RMD docs version
<a><svg><path></svg></a>
Step 4
Create a loop to generate profile sections for 3 team members using the following chunk:
```{r, results="asis"}

cat( '<div class="list-circles">' )

for( i in ??? )
{
   df <- dat[ i , ] # select one row (one team member)
   build_circle( WEBSITE=df$WEBSITE,
     IMG=df$IMG,
     NAME=df$NAME,
     DESC=df$DESC,
     GITHUB=df$GITHUB,
     TWITTER=df$TWITTER  )
}

cat( '</div>' )

```
The cat() function is similar to print() in R.
Step 5
You will also need the custome CSS items contained in the site main.css file in order to replicate the style of the gallery:
Add the list-cicles CSS items to the bottom of your RMD file in a CSS code chunk as follows:
```{css}

<style>
/* --- css elements here --- */
</style>

```
Necessary CSS elements from the R Epidemics Hub website:
/* --- Lists of circles --- */

div { display: block }

.list-circles {
  text-align: center;
}

@media only screen and (min-width: 1200px) {
  .list-circles {
    width: 150%;
    margin-left: -25%;
  }
}


.list-circles-item {
  display: inline-block;
  width: 240px;
  vertical-align: top;
  margin: 0;
  padding: 20px;
}

.list-circles-item:hover {
  background: #fafafa;
}

.list-circles-item .item-img {
  max-width: 200px;
  height: 200px;
  -webkit-border-radius: 50%;
  -moz-border-radius: 50%;
  border-radius: 50%;
  border: 1px solid #777;
}

.list-circles-item .item-desc {
  font-size: 16px;
  font-family: 'Open Sans', 'Helvetica Neue', Helvetica, Arial, sans-serif;
}

.list-circles-item .item-links {
  margin-top: 10px;
  padding-right: 5px;
  display: flex;
  justify-content: center;
  align-items: center;
}

.list-circles-item .item-link {
  margin:0 3px;
  color: #314f96;
  text-decoration: none !important;
}

.list-circles-item .item-link:hover {
  color: #042265;
}

.svg-icon {
  display: inline-flex;
  align-self: center;
}
Step 6
Knit your HTML file.
- Include a chunk showing how you create the dataframe with the 3 team members.
- Include a chunk with your build_circles() function and do NOT hide the code.
- Include a chunk with your loop to add all profiles to the page.
You will submit your RMD file and rendered HTML file for this step.
Challenge
Instead of creating your data frame manually from YAML table items, write a custom parser that reads the table as text and returns a well-structured data frame:
x <-
c("
  - name: Thibaut Jombart
    img: /img/people/thibaut-jombart.jpg
    desc: Founder of RECON. Statistician and R programmer specialized in outbreak analysis. Imperial College London, UK.
    website: https://sites.google.com/site/thibautjombart/
    url: https://sites.google.com/site/thibautjombart/
    github: https://github.com/thibautjombart/
    twitter: https://twitter.com/TeebzR
  - name: Dean Attali
    img: /img/people/dean-attali.jpg
    desc: Web and R developer, designer of the RECON website. Canada.
    website: http://deanattali.com/
    url: http://deanattali.com/
    github: https://github.com/daattali/
    twitter: https://twitter.com/daattali" )

yaml_to_df( x )
Part II - Automated Report Generation
This assignment teaches you to use RMD templates to simplify and automate the process of generating reports.
We will explore the process by reverse-engineering a simple example that was created to build resumes:
Tour of an Report Template
There are three basic parts of this report:
- RMD template
- helper R functions
- CSV file with the job info that gets added to the template
To see how all of the parts fit together and to preview the helper R functions see:
Step 1
For this assignment you will need to clone a version Nick Strayer’s CV project that has been archived on the DS4PS site:
You can do this in the GitHub desktop application under File » Clone » URL then type in the project URL:
https://github.com/DS4PS/cv
Note, since the project is actively being developed this version on DS4PS is frozen in time for pedagogical purposes. You can follow the link to his repo to see what he has added.
Cloning vs Forking
A quick note on the difference between “cloning” a project and “forking” a GitHub project:
A fork is a copy of a repository that allows you to freely experiment with changes without affecting the original project, althgouh a connection exists between your fork and the original repository itself. In this way, your fork acts as a bridge between the original repository and your personal copy where you can contribute back to the original project using Pull Requests.
Unlike forking, when cloning you won’t be able to pull down changes from the original repository you cloned from, and if the project is owned by someone else you won’t be able to contribute back to it unless you are specifically invited as a collaborator. Cloning is ideal for instances when you need a way to quickly get your own copy of a repository where you may not be contributing to the original project.
In this instance we are not contributing back to the project to improve it. We just want our own local copy to work with, so cloning is the best option.
Step 2
After cloning the files, you should have local copies on your desktop. You will need to edit at least two files:
- select either the resume.Rmd file (short resume format) or the index.Rmd file for a longer version (CV format) to serve as a template
- the positions.csv file that will hold your content (past education and employment history)
In the US context a resume is a short (usually two-page) summary of professional highlights and a curriculum vitae (CV) is a full list of professional activities and accomplishments. Typically resumes are used when applying to professional jobs and CVs are used when applying for academic jobs.
You will need to adapt either “resume.Rmd” or “index.Rmd” as a template to generate your resume:
- Be sure to retain the helper functions, as you are required to pull position data from the CSV file instead of hard-coding it in the file.
- You can create your own section titles and content.
- List as many positions, projects, or internships as you can to reach at least 2 pages.
Step 3
Delete Nick’s content form the “positions.csv” file and replace it with your own professional history. For the purpose of the assignment your positions can be aspirational, not factual. But make it obvious and add a note somewhere on the resume if the informational is fictional so that you are not accused of lying on a resume.
Step 4
Knit your RMD file to generate the rendered HTML version of your resume.
Step 5
Go into settings and activate your GitHub page for this repository. Do not select a template.
You should now be able to view your HTML resume online.
Update the description section at the top right of your GitHub repo and add the link to your resume.
Submission Instructions
For the assignment submit the following:
- The RMD and HTML from Part I (do not zip).
- The URL of your GitHub CV repository from Part II
- The URL of your live resume or CV from Part II
- A zipped folder with all of the files in your CV repo from Part II
Submit to Canvas
Optional:
Start a Portfolio
Consider creating a GitHub site to host a portfolio of projects you are working on.
You can add the CV and your code-through assignments to the site.
Note, you might want to highlight projects you have done in this program but do NOT share solutions to any labs or assignments in a public archive.
Challenge Question
If you want more practice with templates, how would you create a template for the following resume format in R Markdown?