COURSE CONTENT:
- Course Overview
- Week 1 - Control Structures
- Week 2 - Simulations
- Week 3 - Regular Expressions
- Week 4 - Text Analysis
- Week 5 - GitHub Pages
- Week 6 - Creating Report Templates
- Week 7 - FINAL PROJECTS
Course Overview
Topics We Will Cover
Due Dates
For easy reference, you have the following due dates this term:
Labs:
- Thursday, Aug 26th
- Tuesday, August 31st
- Thursday, September 9th
- Tuesday, September 14th
- Tuesday, September 21st
- Monday, October 1st
Post Practice Problems on YellowDig:
- Friday, August 20th
- Friday, August 27th
- Friday, September 3rd
- Friday, September 10th
- Friday, September 17th
- Friday, September 24th
- Friday, October 4th
Projects:
- R Package: Friday, September 10th
- Code Through: Optional
- Customized Report Template: Friday, October 8th
Practice Problem Warmup
Post on Friday, August 20th
Non-obvious bugs can EASILY work there way into your code. Once you identify the problem always seems obvious in retrospect. But it is often unclear why code is not working as expected.
These practice problems are largely an opportunity to review content from CPP 526 and develop a sensitivity for the importance of writing robust and maintainable code and testing for unexpected behaviors.
Many of these questions are similar to riddles or brain teasers that help sharpen your critical thinking skills when working with code. Work through them on your own, then discuss your ideas on YellowDig with classmates.
For the topics this week, you will find that reviewing the lecture notes on one-dimensional data types useful: VECTORS IN R.
Each question has it’s own pin. Share your solutions by adding comments to the pins.
Week 1 - Control Structures
Unit Overview
Description
This section introduces control structures that will allow you to incorporate decision-making into computer code. It enables things like if-then logic to determine what code should be used based upon whether specified conditions are met.
Learning Objectives
Once you have completed this unit you will be able to:
- divide or “factor” your code into distinct tasks
- use functions as steps in problem-solving
- review compound statements
- implement if-else statements
- identify “edge cases” and their impact on code
Lecture Notes
Lab-01: Control Structures
Due Thursday, Aug 26th
This lab is based upon the famous Monty Hall Problem.
There was famously much debate about the correct solution when the problem was initially introduced. It is now a popular example used to teach conditional probability in statistics.
Using Computing Logic to Build the Game
The Monty Hall Problem is a great example of a mathematical problem that might be hard to solve using proofs, but it is fairly easy to solve using simulation.
Since it is a game with simple and explicit rules we can build our own virtual version. Then we can compare how outcomes differ when we deploy the two different strategies for selecting doors.
In Lab 01 we will use functions and control structures to build a virtual version of the game.
### STEP 01 OF GAME
# 1: create a vector of 3 doors: 2 goats and 1 car
# 2: randomize the position of the car for a new game
# 3: return the new game setup (vector of prizes)

create_game <- function( )
{
    prizes <- c("goat","goat","car")
    a.game <- sample( x=prizes, size=3, replace=F )
    return( a.game )
}
In Lab 02 we will use simulation to play the game thousands of times so that we can get stable estimates of the payoff of each strategy.
Practice Problems
Post on Friday, August 27th
Week 2 - Simulations
Unit Overview
Description
This section introduces loops. We will use them to create simulations.
Learning Objectives
Once you have completed this section you will be able to
- use a loop responsibly in your code
- select appropriate iterators
- be mindful of the collector vector needed for the loop
“I was working on my master’s degree before I realized … that code was intuitive to me, but math notation was not.” ~ JD Long
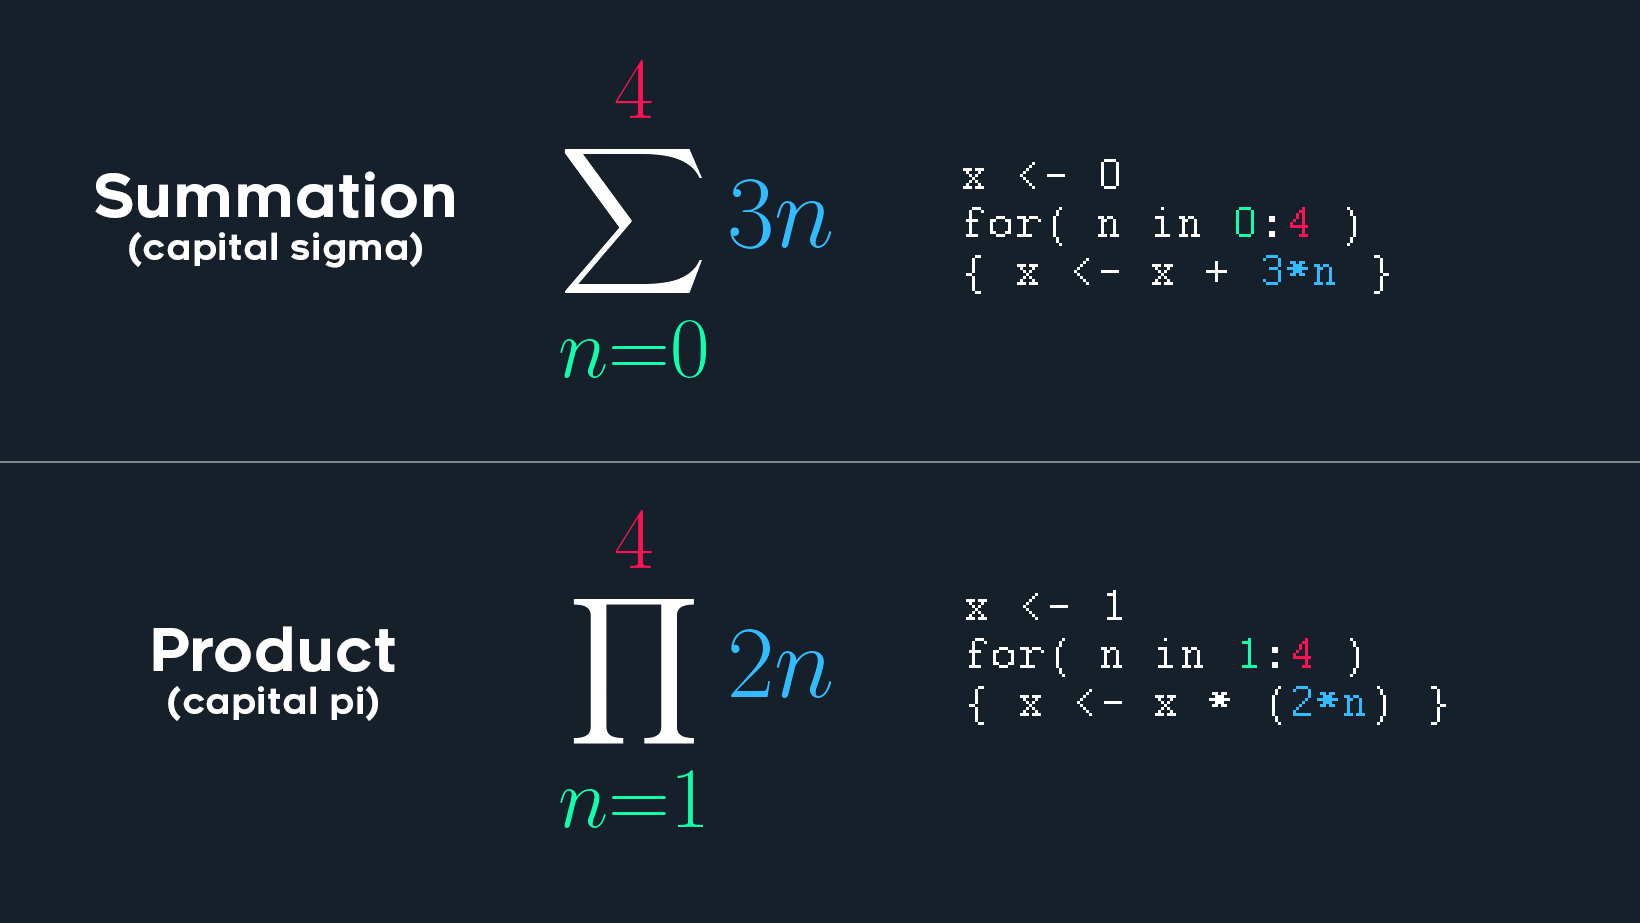
Lecture Notes:
Building Simulations in R: Mastering Loops
Creating Animations with Loops
Example:
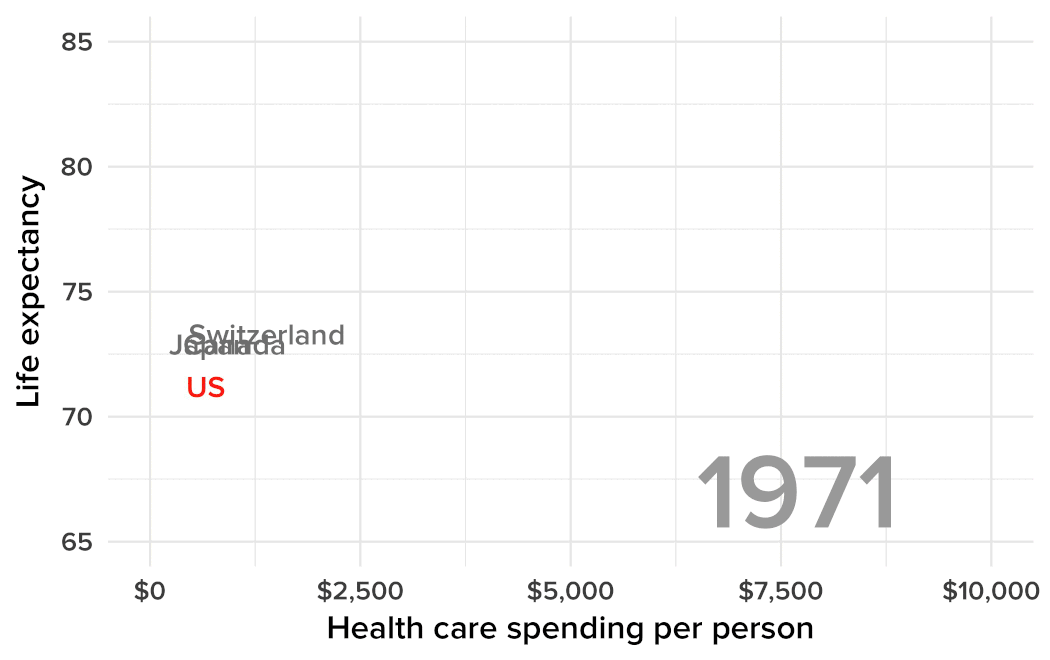
Buzzfeed published a recent story with a dynamic visualization of the change in health care costs over time.
It uses loops to create effective data visualization:
Why Americans Are So Damn Unhealthy, In 4 Shocking Charts Buzzfeed Replication Files
Lab 02: Simulations
Due Tuesday, August 31st
Practice Problems
Post on Friday, September 3rd
PROJECT: Build Your Own R Package
Due Friday, September 10th
To receive credit for the assignment, submit the URL to your package on GitHub through Canvas.
At some point you might develop a tool that you want to upload to the CRAN so it is widely available.
More likely, if you are working with a team of analysts within an organization you will begin building a library of functions that are specific to the project.
Even if not sharing the package widely it is often a more efficient method for the team to maintain project code so that it can be easily updated and functions enhanced. Project updates are then easily shared simply by re-installing the package.
This tutorial will teach you how to build and share a package in R. You will “package” your R code from Labs 01 and 02 into a new montyhall package to make it easier to run simulations to evaluate game strategies.
Grading:
Your package will be installed and submitted to a series of testing scripts that ensure each function operates as expected.
The documentation will also be inspected to ensure there are complete instructions and sample code available for each of the functions.
You will receive a grade of zero if you package cannot be installed or run, and you will lose 5 points if documentation is unavailable.
Week 3 - Regular Expressions
Unit Overview
Text as Data:
This week comes with an up-front warning. You can get a PhD in Natural Language Processing, which is an entire field devote to computation analysis using text as data. We have two weeks to cover the topic! We obviously cannot go deep into this interesting field, but we can introduce some foundational tools and R functions for text processing.
Let’s get started by motivating the topic with a couple of cool examples.
Which Hip-Hop Artist Has the Largest Vocabulary?
Who is the Anonymous Op-Ed Writer inside the Trump Administration?
These examples all demonstrate interesting uses of text as data. They are also examples of the types of insight that can come from analysis with big data - the patterns are hiding in plain sight but our brains cannot hold enough information at one time to see it. Once we can find a system to extract hidden patterns from language we can go beyond seeking large public databases to generate insights, and we can start using all of Twitter, all published news stories, or all of the internet to identify trends and detect outliers.
Lecture Notes
Lab-03: Regular Expressions
Due Thursday, September 9th
Practice Problems
Post on Friday, September 10th
Week 4 - Text Analysis
Unit Overview
This week will use regular expressions you developed during the prior week and some additional text analysis tools from the package quanteda to practice working with text as data.
Required Reading
Motivation for the topic this week comes from the Urban Institute’s new Racial Equity Analytics Lab.
One of the challenges of bringing a data-driven approach to issues like racial equity is that tracking patterns and trends requires the ability to observe groups that might not be explicitly included in the data.
One useful application of text analysis is using words to identify whether specific entities belong to a study group of interest. In this case, do foundations and nonprofits work with diverse communities? See:
Addressing Racial Funding Gaps in the Nonprofit Sector Requires New Data Approaches
Quanteda
There are several text analysis packages in R, but Quanteda is one of the most popular and robust.
Text analysis packages contain functions that assist in the manipulation of text as data in order to convert raw text files into structured databases, apply a variety of pre-processing steps that clean and standardize the data, and functions that assist in identifying patterns in text.
Read the Quanteda Quick-start Guide to familiarize your self with some basic components of text analysis.
Focus on:
- Vocabulary:
- Document: a file consisting primarily of text
- Corpus: a collection of documents in a study
- Tokens: single words or phrases
- Cleaning text:
- Removing punctuation and often numbers and symbols
- Pre-Processing Steps:
- Stemming words to remove variant components: running, runner, runs -> run
- Identify proper nouns
- Combine compound words into single words: George Bush -> george_bush
- Analysis
- Tokenization of pre-processed documents
- Identification of patterns in use of words
Lab-04: Text Analysis
Due Tuesday, September 14th
Practice Problems
Post on Friday, September 17th
Week 5 - GitHub Pages
Unit Overview
A big part of every analysts job is trying to find ways to distill large volumes of data and information down to meaningful bites of knowledge, often for diverse stakeholder audiences that have varying degrees of technical expertise. For this reason, communication skills are extremely valuable for data scientists. You will constantly be challenged to find the interesting story that emerges from an overwhelming amount of data, and find creative ways to tell the story so that information becomes actionable.
Although it might not sound as edgy as building a machine learning classifier, the ability to create customized reporting formats and automate various steps of analysis will both make you more efficient and also more effective at communication.
This lab introduces you to one powerful tool for your toolkit - using GitHub pages to build a website quickly and inexpensively (for free, actually). Then use it to host various components of projects including public-facing reports and RMD documents after rendering.
More generally, we will learn how to build templates that can be used in websites or to batch process R Markdown reports.
Templates use the same basic tools for both HTML pages and R Markdown reports. Some basic familiarity with CSS, page containers, and responsive design can go a long way toward empowering you to automate organizational reporting processes.
Lecture Notes
Lab 05: GitHub Pages
Also share your page link on YellowDig:
Due Tuesday, September 21st
Practice Problems
Post on Friday, September 24th
Week 6 - Creating Report Templates
Unit Overview
Lab 06: Creating RMD Templates
Due Monday, October 1st
Practice Problems
Post on Friday, October 4th
Week 7 - FINAL PROJECTS
Project Lifecycle Lab
Due Friday, October 8th
This final project is worth 15 points, compared to 10 points for regular labs. It is not meant to be a big final project that you spend lots of time one, rather a nice well-scoped task (creating reports that break out salaries by job title and gender), but it requires data cleaning, agmentation, and wrangling in order to complete the task. It also requires the use of loops to replicate the steps across a bunch of units within an organization.
It is designed to be integrative where you can see various skills you have learned throughout the semester come together into the type of work-flow needed to structure larger tasks. I have provided code for the most time-intensive tasks (creating a crosswalk from raw job descriptions to five well-structured job categories and creating a customized graphing function tailored to this data). You will need to implement functions to accomplish some steps on your own, then gather all of the functions into a “utilities” script (utils.R). The RMD document loads the data and “sources” these functions to control the work flow and execute the steps at a high level.
A key learning outcome is understanding how the basic building blocks of data programming and content packaging come together to create your deliverable. You will get more practice with these skills in CPP 528 when you do a deep dive into project management frameworks.
Code-Through
Due Optional
Since you are sharing your code-through with your classmates on Yellowdig, it will serve as your discussion topic this week.
Add your codethrough files (the HTML specifically) to your new website on GitHub repository and generate an active URL for your tutorial so that you can share with classmates. Note that you cannot host Shiny apps or other dynamic apps on GitHub - they must be static HTML pages.
Submit to Canvas:
Post on Yellowdig:
Optional code-through assignment: if you are looking for topics we invite you to select one of the placeholder chapters from the open-source course lecture notes.
For example, Converting Data Types:
https://ds4ps.org/dp4ss/#one-dimensional-datasets
These notes are used as background reading for course units, but the main intent is to create a catalog of useful topics that can be referenced quickly to remind yourself about a topic. Syntax and arguments are difficult to memorize, so even experienced programmers need working examples as reference.
Cheat sheets and reference chapters do not need to include a lot of explanation, but rather a list of important considerations under a topic and useful examples that differentiate cases.
For example, in a chapter on factors you could include things like:
- creating factors (the factor function)
- printing unique factor levels
- counting factor levels
- creating new factor level labels
- changing factor level labels
- conversion to factors
- conversion from factors to characters
- conversion from factors to numeric
- regular versus ordered factors
- default versus custom factor orders
Note that these are rules related to one single vector type! It can be helpful to choose what appears to be a narrow topic and test yourself on how much you know about that topic, as well as whether you can find some parsimonious examples to show the right and wrong ways to implement your code. Often times examples that show what NOT to do can be more instructive than correct code.