
Course Overview
CPP 527 is the second course in the Foundations of Data Science sequence.
This semester is designed to extend your working knowledge of data programming by introducing programming topics that will make you a more adaptive and creative analyst.
This course will cover:
- control structures like loops
- new data structures like lists
- regular expressions for working with text
- creation of packages in R
- creating of websites in GitHub
- building RMD templates to automate reporting
We will also cover the foundations of document design using both GitHub pages (free websites like this one) and customized RMD templates to enable you to better structure results from analytical projects.
The skills you learn this term can be used to build simulations in R, codify common workflows, and create specialized applications.
Course Cadence
The class is designed around labs each week due on Tuesdays, and practice problems that you can discuss with classmates on YellowDig.
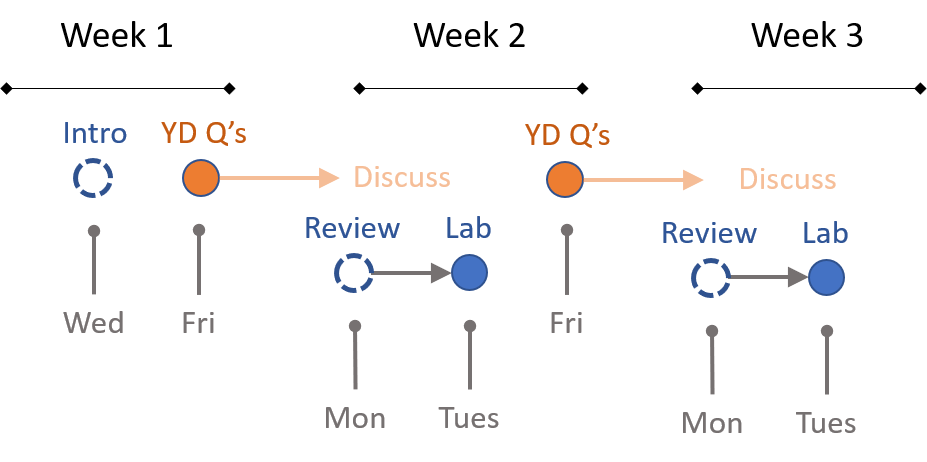
Review sessions are scheduled Monday so that you have a chance to start your labs, work over the weekend, and come with questions.
Each week 2-3 R programming practice problems will be posted. These problems will focus on common errors people make with R, or useful tricks that are good to know.
You are encouraged to try all of the practice problems, but pick one that you will explain to classmates on YellowDig. Post your solution on Friday (not before) so that everyone has a chance to share solutions. You can discuss the posted solutions throughout the week.
There are three additional projects you must complete throughout the term. They are small projects, but require more autonomy than labs. Keep an eye out for these deadlines.
- Building an R package from code you develop on Labs 01-02 (due mid term)
- Build a report template (due end of term)
- Create a code-through tutorial (due end of term)
Practice Problems
It is easy for non-obvious bugs to EASILY work their way into your code. Once you see the problem, it will seem obvious. But until you see it the code often looks fine and it’s unclear why it is not working as expected.
These practice problems are largely an opportunity to review content from CPP 526 and develop a sensitivity to the nuances of R. It also demonstrates the importance of testing your code for unexpected behaviors and writing robust and maintainable scripts.
These questions are similar to riddles or brain teasers that help sharpen your critical thinking skills when working with code. Work through each on your own, then discuss solutions on YellowDig with classmates.
Getting Help
Note that similar to other courses the discussion board is run through the GitHub issues feature. It is a great forum tool because:
- You can format code and math using standard markdown syntax.
- You can cut and paste images directly into the message.
- You can direction responses using @username mentions.
Please use the discussion boards to practice your social coding etiquette.
- Ask clear questions.
- Provide sufficient code for the reader to diagnose the problem.
- When possible, use reproducible examples.
- Preview your responses before posting to ensure proper formatting.
Recall that you format code by placing fences around the code:
```
# your code here
lm( y ~ x1 + x2 )
```
The fences are three back-ticks. These look like quotation marks, but are actually the character at the top left of your keyboard (if you have a US or European keyboard).
GitHub does not have a native math rendering language (RMD documents, on the other hand, support formulas).
You have two options when using formulas: type them as regular text and use code formatting to make them clear (this option is usually sufficient).
```
y = b0 + b1•X1 + b2•X2 + e

b1 = cov(x,y) / var(x)
```
Or type your formula in a formula editor and copy and paste an image.
Use dput() to share R objects for reproducible examples.
dat
      x y
1   9.8 A
2   9.2 B
3   9.0 C
4  10.5 D
5   9.5 E
6   9.4 F
7  10.4 G
8  11.1 H
9   9.6 I
10  9.4 J

dput(x)  # outputs numeric vector
c(9.8, 9.2, 9, 10.5, 9.5, 9.4, 10.4, 11.1, 9.6, 9.4)

dput(y)  # outputs character vector
c("A", "B", "C", "D", "E", "F", "G", "H", "I", "J")

dput( dat )  # outputs a data frame
structure(list(x = c(9.8, 9.2, 9, 10.5, 9.5, 9.4, 10.4, 11.1,
9.6, 9.4), y = c("A", "B", "C", "D", "E", "F", "G", "H", "I",
"J")), class = "data.frame", row.names = c(NA, -10L))
This code can be copied from the forum and pasted into R to recreate the vectors or data frames.
If your object is large just share a small portion for a reproducible example:
dput( head(dat,25) ) # first 25 rows