
Week 06
YellowDig Instructions
DATA APIs IN R:
For your YellowDig assignment this week, find an API package in R and demonstrate it’s functionality.
If you are curious about specific APIs I would start by finding a cool public API then searching around to see if someone has created an R package to make it easier to use.
Public here means that the API is not a paid service behind a firewall, though many free APIs require a registered account, a key, or authentication of some sort.
Alternatively, you can visit the CRAN Task View for Web Technologies and search for API on the page:
https://cran.r-project.org/web/views/WebTechnologies.html
This is hardly an exhaustive list, but a good place to start.
Once you have found an API package report what you have learned to your classmates on YellowDig.
- Describe your API package and it’s primary purpose.
- Describe the data or the tool available through the API (the google maps API converts a street address to longitude-latitude coordinates, for example).
- Explain the primary get_data() or do_something() function in the package including (1) main arguments, (2) what information you need to provide, and (3) what the returned data looks like.
- What is the data type of the return data (regular text, csv, json, xml, etc.)?
What is an API?
An application programming interface, or API, is a way for two programs to communicate.
An API might provide a way to change the color of a light bulb on a “smart” christmas tree or post a message on Twitter. In the case of data APIs, they offer a way to get some small slice of some large data set that lives on a server.
APIs let you use other people’s databases and coding wizardry to enhance your own applications or analysis scripts. For instance you might have a spreadsheet with street addresses you need to turn into GPS coordinates so you can map them.
Data journalists explain the value of APIs.
Example APIs:
There is one API that you likely use every single day: Google. Your query takes the form of the search words you type into the box, and the data is sent back as a nicely-formatted list of websites: the page title, URL, and the first few sentences of text on the page.
The Data Science Toolkit site has a lot of nice examples of these type of APIs in action.
These mostly have user interfaces where you paste some input data into a search box and it returns data based upon your inputs.
For example, you can type an address and it will return a set of latitude and longitude coordinates.
The original website Data Science Toolkit is not defunct but all of the APIs have all been added to an R package called RDSTK (R data science toolkit):
Airport Status API
The FAA has an API that provides information about airports, including delays and weather. You give it an airport code, like “JFK” or “BDL” for Bradley International Airport, and it tells you what’s up at that airport.
To get data for an airport, you just go to this specially formed web address.
# root API URL
http://services.faa.gov/airport/status/
You just need to include an airport code and data return type. It even works in a browser (go ahead, try it):
http://services.faa.gov/airport/status/JFK?format=application/json
The “JFK” part can be replaced with any valid airport code, and the “format” can be set to other data options like “application/xml”.
The response looks like this, a JSON string:
{ "delay":"true",
  "IATA":"JFK",
  "state":"New York",
  "name":"John F Kennedy International",
  "weather":{ "visibility":10.00,
              "weather":"Mostly Cloudy",
              "meta":{"credit":"NOAA's National Weather Service","updated":"9:51 AM Local","url":"http://weather.gov/"},
              "temp":"42.0 F (5.6 C)",
              "wind":"Northwest at 16.1mph" },
  "ICAO":"KJFK",
  "city":"New York",
  "status":{ "reason":"WX:Wind",
             "closureBegin":"",
             "endTime":"",
             "minDelay":"31 minutes",
             "avgDelay":"",
             "maxDelay":"45 minutes",
             "closureEnd":"",
             "trend":"Increasing","type":"Departure" }
}
Side note, what would this data look like as a tidy dataframe?
Music API (Artists, Albums, & Lyrics)
Recall the vignette that introduced text analysis by analyzing the vocabulary of rap artists:
Unique Words Used Within Artist’s First 35,000 Lyrics
This analysis was done by importing song lyrics from the Genius music API.
An R wrapper for the API has been created and packaged as geniusr:
News APIs
If you want to query news sources for stories on specific topics check out:
How do APIs Work?
APIs function like calls to a database. You send parameters, and the server sends the appropriate response - the data that matches your query.
The interface for many APIs functions a lot like a dplyr::filter call. You specify which slice of data you would like through the values you designate:
data %>%
  filter(  gender=="male"   &  age=="20-25"  &  state %in% c("AZ","NY","PA") )
The main difference is that this is a filter function manipulating data on your own computer. Data APIs allow you to query a database that lives on a server.
Data APIs consist of a base URL that serves as the address of the data on the server and a set of allowable queries.
Each API defines it’s own set of allowable queries. Similar to a filter() function there are rules about how to construct your statements so they identify the proper slice of data. Unlike R, if you violate the defined rules of the API then instead of an error you just get an empty set with no data.
For demonstration purposes, assume that we want to download some census data from a nice Graphical User Interface (GUI) someone has created for us in order to make the Census API easier to use. It might look something like this:
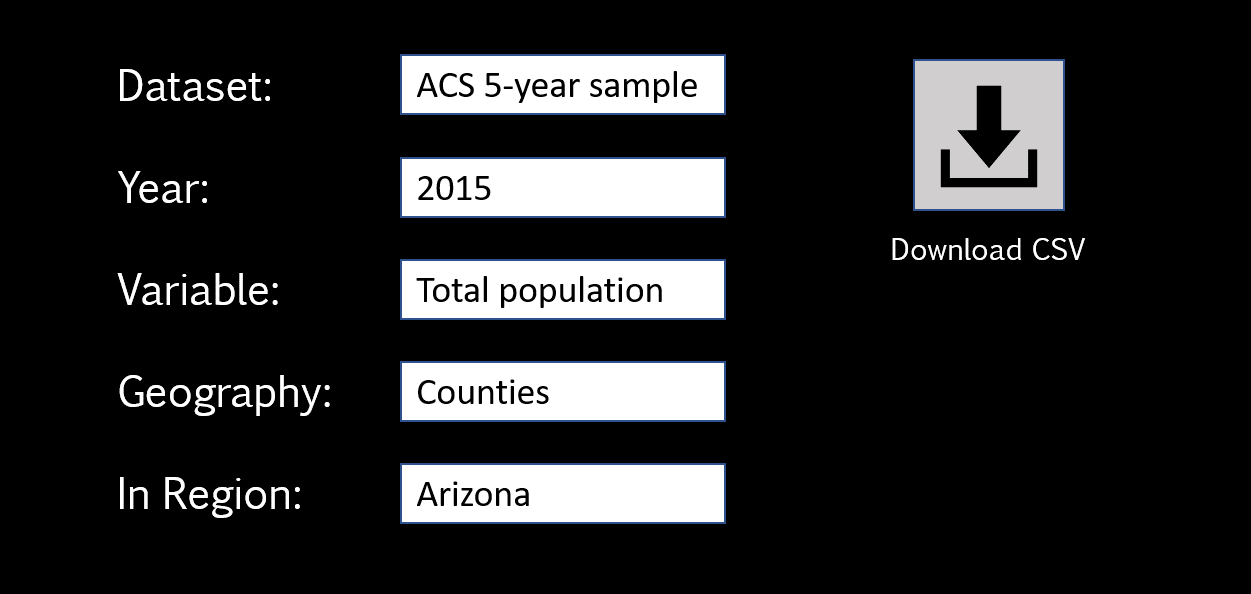
All we need to do is select options from drop-down lists and click “download” to receive all of the data as a CSV file.
APIs operate basically the same, but we would use the API documentation to convert the same query in this GUI into the API URL directly.
To run this example, you will need to get your own free Census API key and replace “your.unique.census.key.goes.here” with the actual key you receive from the Census.
I have selected the population variable B01001_001E but you can find other variable names in the Census catalog: https://api.census.gov/data/2015/acs/acs5/variables.html.
library( censusapi )
library( jsonlite )
library( httr )

##################################################################
####      API QUERY:
##################################################################

API.BASE     <- "https://api.census.gov/data"
API.VINTAGE  <- "2015"
API.NAME     <- "acs/acs5"
VARIABLE     <- "B01001_001E"      # TOTAL POPULATION (E for Estimate)
STATE        <- "04"               # AZ STATE FIPS CODE
KEY          <- "your.unique.census.key.goes.here"

##################################################################

BASE.URL <- paste( API.BASE, API.VINTAGE, API.NAME, sep="/" )
BASE.URL

# [1] "https://api.census.gov/data/2015/acs/acs5"

FULL.URL <- paste( BASE.URL, "?get=NAME,", VARIABLE, "&for=state:", STATE, "&key=", KEY, sep="" )
FULL.URL

# [1] "https://api.census.gov/data/2015/acs/acs5?get=NAME,B01001_001E&for=state:04&key=your.unique.census.key.goes.here"
Now, pasting this URL into a browser is the equivalent of sending a query to a database. Similar to the filter() function you are referencing variable names and specific values (logical statements) and separating them with an &:
?get=                  # start of the query
NAME,B01001_001E       # list of variable names
&
for=state:04           # geography
&
key=your.unique.census.key.goes.here
The data is returned in a JSON format:
# Population of Arizona
[["NAME","B01001_001E","state"],
["Arizona","6641928","04"]]
That’s it! It’s that easy.
Just like functions in R, you will look up the API arguments in the documentation.
The documentation should also tell you the types of values that each argument expects. For example, the state geography uses FIPS codes (state:04) instead of the normal two-letter abbreviation (state:AZ).
In order to import the data into R we need a couple more steps.
- We need to retrieve the data from the API URL that we have built.
- We need to convert from JSON to a matrix, then the matrix to a data frame.
We can write a couple of functions to make this easier:
api.data.raw <- httr::GET( FULL.URL )

matrix_to_df <- function( m )
{
  d <- as.data.frame(m)
  col.names <- d[ 1, ]    # get first row
  names(d) <- col.names   # assign as column names
  d <- d[ -1 , ]          # delete first row
  return(d)
}


json_to_data_frame <- function( api.data.raw )
{
    data.as.json <- httr::content( api.data.raw, as = "text" )
    data.as.matrix <- jsonlite::fromJSON( data.as.json )
    data.as.df <- matrix_to_df( data.as.matrix )
    return( data.as.df )

}


json_to_data_frame( api.data.raw )  # returns a data frame
     NAME   B01001_001E   state
2 Arizona       6641928      04

# intermediate data formats for reference

data.as.json
[1] "[[\"NAME\",\"B01001_001E\",\"state\"],\n[\"Arizona\",\"6246816\",\"04\"]]"

data.as.matrix
     [,1]      [,2]          [,3]
[1,] "NAME"    "B01001_001E" "state"
[2,] "Arizona" "6246816"     "04"
Another example grabbing data from all of the states instead of one at a time:
KEY           <- "your.unique.census.key.goes.here"
API.BASE      <- "https://api.census.gov/data"
API.VINTAGE   <- "2015"
API.NAME      <- "acs/acs5"
VARIABLE      <- "B01001_001E"      # TOTAL POPULATION (E for Estimate)
STATE         <- "*"                # ALL STATES

BASE.URL <- paste( API.BASE, API.VINTAGE, API.NAME, sep="/" )
FULL.URL <- paste( BASE.URL, "?get=NAME,", VARIABLE, "&for=state:", STATE, "&key=", KEY, sep="" )

api.data.raw <- httr::GET( FULL.URL )

json_to_data_frame( api.data.raw )

                   NAME B01001_001E state
2               Alabama     4830620    01
3                Alaska      733375    02
4               Arizona     6641928    04
5              Arkansas     2958208    05
6            California    38421464    06
7              Colorado     5278906    08
8           Connecticut     3593222    09
9              Delaware      926454    10
...etc
You can drill down further and further depending upon the API options. For example to get the population of every county in the US we would use the following geography:
for=county:*&in=state:*
The Census API gets complicated quickly because there are several hundred datasets you can query, several dozen allowable geographies for each variable, and several thousand variables to choose from.
This is why packages like censusapi will include a bunch of functions that just list API options:
apis <- censusapi::listCensusApis()
head( apis[,1:3], 25 )
                                                                  title              name vintage
451                     Annual Economic Surveys: Annual Business Survey             abscb    2017
454                     Annual Economic Surveys: Annual Business Survey            abscbo    2017
458                     Annual Economic Surveys: Annual Business Survey             abscs    2017
391 American Community Survey: 1-Year Estimates: Detailed Tables 1-Year          acs/acs1    2005
395 American Community Survey: 1-Year Estimates: Detailed Tables 1-Year          acs/acs1    2006
397 American Community Survey: 1-Year Estimates: Detailed Tables 1-Year          acs/acs1    2007
399 American Community Survey: 1-Year Estimates: Detailed Tables 1-Year          acs/acs1    2008
403 American Community Survey: 1-Year Estimates: Detailed Tables 1-Year          acs/acs1    2009
71                                           ACS 1-Year Detailed Tables          acs/acs1    2010
86                                           ACS 1-Year Detailed Tables          acs/acs1    2011
97                                           ACS 1-Year Detailed Tables          acs/acs1    2012
179                                          ACS 1-Year Detailed Tables          acs/acs1    2013
202                                          ACS 1-Year Detailed Tables          acs/acs1    2014
243                                          ACS 1-Year Detailed Tables          acs/acs1    2015
265                                          ACS 1-Year Detailed Tables          acs/acs1    2016
288                                          ACS 1-Year Detailed Tables          acs/acs1    2017
365 American Community Survey: 1-Year Estimates: Detailed Tables 1-Year          acs/acs1    2018
501 American Community Survey: 1-Year Estimates: Detailed Tables 1-Year          acs/acs1    2019
72                                       ACS 1-Year Comparison Profiles acs/acs1/cprofile    2010
87                                       ACS 1-Year Comparison Profiles acs/acs1/cprofile    2011
100                                      ACS 1-Year Comparison Profiles acs/acs1/cprofile    2012
177                                      ACS 1-Year Comparison Profiles acs/acs1/cprofile    2013
204                                      ACS 1-Year Comparison Profiles acs/acs1/cprofile    2014
245                                      ACS 1-Year Comparison Profiles acs/acs1/cprofile    2015
266                                       ACS 1-Year Comparison Profile acs/acs1/cprofile    2016
In summary, this lecture introduces the basic concepts behind a data API.
You are doing this:
But manually by building your API query like this:
KEY           <- "your.unique.census.key.goes.here"
API.BASE      <- "https://api.census.gov/data"
API.VINTAGE   <- "2015"
API.NAME      <- "acs/acs5"
VARIABLE      <- "B01001_001E"      # TOTAL POPULATION (E for Estimate)
STATE         <- "04"               # AZ STATE FIPS CODE

BASE.URL <- paste( API.BASE, API.VINTAGE, API.NAME, sep="/" )
FULL.URL <- paste( BASE.URL, "?get=NAME,", VARIABLE, "&for=state:", STATE, "&key=", KEY, sep="" )
FULL.URL

# [1] "https://api.census.gov/data/2015/acs/acs5?get=NAME,B01001_001E&for=state:04&key=your.unique.census.key.goes.here"
Data APIs are often the fastest way to get data, but more importantly they also document the process used to acquire the data.
That makes the process easy to replicate later, and also easy to inspect if there are problems with the data.
The best part is that most useful APIs have already been turned into packages in R, so you don’t even need to read all of the documentation. You can download the package then use R functions directly. For example, the function for the Census API might look something like this:
get_census_data <- function( VINTAGE, API.NAME, VARIABLE, STATE, KEY )
{
   API.BASE <- "https://api.census.gov/data"
   BASE.URL <- paste( API.BASE, VINTAGE, API.NAME, sep="/" )
   FULL.URL <- paste( BASE.URL, "?get=NAME,", VARIABLE, "&for=state:", STATE, "&key=", KEY, sep="" )
   api.data.raw <- httr::GET( FULL.URL )
   df <- json_to_data_frame( api.data.raw )
   return( df )
}
If you are curious, you can view the source code for the censusapi package to see how the code is actually constructed. It is more complicated because it has to account for combinations of all of the different arguments using all of the APIs, along with error-checking. The devil is always in the details!
Additional Reading
If you have an important dataset that you would like to share with the world, you can also build your own API in R: