Visualizing The Intervention
Library
# Turn off scientific notation
options(scipen=999)

# Load packages
library(here)        # relative file paths for reproducibility
library(tidyverse)   # data wrangling
library(stringi)     # string data wrangling
library(tigris)      # US census TIGER/Line shapefiles
library(ggplot2)     # data visualization
library(cowplot)     # data visualization plotting
library(gridExtra)   # grid for data visualizations
library(biscale)     # bivariate mapping
library(kableExtra)  # table formatting
library(scales)      # palette and number formatting
library(cluster)     # clustering algorithms
library(factoextra)  # clustering algorithms & visualization
Functions
import::here( "fips_census_regions",
              "load_svi_data",
              "merge_svi_data",
              "census_division",
              "flag_summarize",
              "summarize_county_nmtc",
              "summarize_county_lihtc",
              "elbow_plot",
             # notice the use of here::here() that points to the .R file
             # where all these R objects are created
             .from = here::here("analysis/project_data_steps_dodson.R"),
             .character_only = TRUE)
census_division
Load SVI Data
# Load SVI data sets
svi_2010 <- readRDS(here::here("data/raw/Census_Data_SVI/svi_2010_trt10.rds"))
svi_2020 <- readRDS(here::here("data/raw/Census_Data_SVI/svi_2020_trt10.rds"))

# Load mapping data sets
svi_county_map2010 <- readRDS(here::here(paste0("data/wrangling/", str_replace_all(census_division, " ", "_"), "_county_svi_flags10.rds")))

svi_county_map2020 <- readRDS(here::here(paste0("data/wrangling/", str_replace_all(census_division, " ", "_"), "_county_svi_flags20.rds")))

divisional_st_sf <- readRDS(here::here(paste0("data/wrangling/", str_replace_all(census_division, " ", "_"), "_st_sf.rds")))
# Load NMTC & LIHTC Tract Eligibility Data

orig_nmtc <- readxl::read_excel(here::here("data/raw/NMTC_LIHTC_tracts/nmtc_2011-2015_lic_110217.xlsx"), sheet="NMTC LICs 2011-2015 ACS")

high_migration_nmtc <- readxl::read_excel(here::here("data/raw/NMTC_LIHTC_tracts/nmtc_2011-2015_lic_110217.xlsx"), sheet="High migration tracts", skip=1)

nmtc_awards_data <- readxl::read_excel(here::here("data/raw/NMTC_LIHTC_tracts/NMTC_Public_Data_Release_includes_FY_2021_Data_final.xlsx"), sheet = "Projects 2 - Data Set PUBLISH.P")

lihtc_eligible <- readxl::read_excel(here::here("data/raw/NMTC_LIHTC_tracts/qct_data_2010_2011_2012.xlsx"))

lihtc_projects <- read.csv(here::here("data/raw/NMTC_LIHTC_tracts/lihtcpub/LIHTCPUB.csv"))
Load 2010 Data
# National 2010 Data
svi_2010_national <- load_svi_data(svi_2010, percentile=.75)
svi_2010_national %>% head() %>% kbl() %>% kable_styling() %>% scroll_box(width = "100%")
| GEOID_2010_trt | FIPS_st | FIPS_county | FIPS_tract | state | state_name | county | region_number | region | division_number | division | E_TOTPOP_10 | E_HU_10 | E_HH_10 | E_POV150_10 | ET_POVSTATUS_10 | EP_POV150_10 | EPL_POV150_10 | F_POV150_10 | E_UNEMP_10 | ET_EMPSTATUS_10 | EP_UNEMP_10 | EPL_UNEMP_10 | F_UNEMP_10 | E_HBURD_OWN_10 | ET_HOUSINGCOST_OWN_10 | EP_HBURD_OWN_10 | EPL_HBURD_OWN_10 | F_HBURD_OWN_10 | E_HBURD_RENT_10 | ET_HOUSINGCOST_RENT_10 | EP_HBURD_RENT_10 | EPL_HBURD_RENT_10 | F_HBURD_RENT_10 | E_HBURD_10 | ET_HOUSINGCOST_10 | EP_HBURD_10 | EPL_HBURD_10 | F_HBURD_10 | E_NOHSDP_10 | ET_EDSTATUS_10 | EP_NOHSDP_10 | EPL_NOHSDP_10 | F_NOHSDP_10 | E_UNINSUR_12 | ET_INSURSTATUS_12 | EP_UNINSUR_12 | EPL_UNINSUR_12 | F_UNINSUR_12 | E_AGE65_10 | EP_AGE65_10 | EPL_AGE65_10 | F_AGE65_10 | E_AGE17_10 | EP_AGE17_10 | EPL_AGE17_10 | F_AGE17_10 | E_DISABL_12 | ET_DISABLSTATUS_12 | EP_DISABL_12 | EPL_DISABL_12 | F_DISABL_12 | E_SNGPNT_10 | ET_FAMILIES_10 | EP_SNGPNT_10 | EPL_SNGPNT_10 | F_SNGPNT_10 | E_LIMENG_10 | ET_POPAGE5UP_10 | EP_LIMENG_10 | EPL_LIMENG_10 | F_LIMENG_10 | E_MINRTY_10 | ET_POPETHRACE_10 | EP_MINRTY_10 | EPL_MINRTY_10 | F_MINRTY_10 | E_STRHU_10 | E_MUNIT_10 | EP_MUNIT_10 | EPL_MUNIT_10 | F_MUNIT_10 | E_MOBILE_10 | EP_MOBILE_10 | EPL_MOBILE_10 | F_MOBILE_10 | E_CROWD_10 | ET_OCCUPANTS_10 | EP_CROWD_10 | EPL_CROWD_10 | F_CROWD_10 | E_NOVEH_10 | ET_KNOWNVEH_10 | EP_NOVEH_10 | EPL_NOVEH_10 | F_NOVEH_10 | E_GROUPQ_10 | ET_HHTYPE_10 | EP_GROUPQ_10 | EPL_GROUPQ_10 | F_GROUPQ_10 | SPL_THEME1 | RPL_THEME1 | F_THEME1 | SPL_THEME2 | RPL_THEME2 | F_THEME2 | SPL_THEME3 | RPL_THEME3 | F_THEME3 | SPL_THEME4 | RPL_THEME4 | F_THEME4 | SPL_THEMES | RPL_THEMES | F_TOTAL |
|---|---|---|---|---|---|---|---|---|---|---|---|---|---|---|---|---|---|---|---|---|---|---|---|---|---|---|---|---|---|---|---|---|---|---|---|---|---|---|---|---|---|---|---|---|---|---|---|---|---|---|---|---|---|---|---|---|---|---|---|---|---|---|---|---|---|---|---|---|---|---|---|---|---|---|---|---|---|---|---|---|---|---|---|---|---|---|---|---|---|---|---|---|---|---|---|---|---|---|---|---|---|---|---|---|---|---|---|---|---|---|---|---|---|---|---|
| 01001020100 | 01 | 001 | 020100 | AL | Alabama | Autauga County | 3 | South Region | 6 | East South Central Division | 1809 | 771 | 696 | 297 | 1809 | 16.41791 | 0.3871 | 0 | 36 | 889 | 4.049494 | 0.1790 | 0 | 127 | 598 | 21.23746 | 0.20770 | 0 | 47 | 98 | 47.95918 | 0.5767 | 0 | 174 | 696 | 25.00000 | 0.18790 | 0 | 196 | 1242 | 15.780998 | 0.6093 | 0 | 186 | 1759 | 10.574190 | 0.3790 | 0 | 222 | 12.271973 | 0.4876 | 0 | 445 | 24.59923 | 0.5473 | 0 | 298 | 1335 | 22.32210 | 0.8454 | 1 | 27 | 545 | 4.954128 | 0.09275 | 0 | 36 | 1705 | 2.1114370 | 0.59040 | 0 | 385 | 1809 | 21.282477 | 0.4524 | 0 | 771 | 0 | 0.0000000 | 0.1224 | 0 | 92 | 11.9325551 | 0.8005 | 1 | 0 | 696 | 0.0000000 | 0.1238 | 0 | 50 | 696 | 7.183908 | 0.6134 | 0 | 0 | 1809 | 0 | 0.364 | 0 | 1.74230 | 0.28200 | 0 | 2.56345 | 0.5296 | 1 | 0.4524 | 0.4482 | 0 | 2.0241 | 0.2519 | 1 | 6.78225 | 0.3278 | 2 |
| 01001020200 | 01 | 001 | 020200 | AL | Alabama | Autauga County | 3 | South Region | 6 | East South Central Division | 2020 | 816 | 730 | 495 | 1992 | 24.84940 | 0.5954 | 0 | 68 | 834 | 8.153477 | 0.5754 | 0 | 49 | 439 | 11.16173 | 0.02067 | 0 | 105 | 291 | 36.08247 | 0.3019 | 0 | 154 | 730 | 21.09589 | 0.09312 | 0 | 339 | 1265 | 26.798419 | 0.8392 | 1 | 313 | 2012 | 15.556660 | 0.6000 | 0 | 204 | 10.099010 | 0.3419 | 0 | 597 | 29.55446 | 0.8192 | 1 | 359 | 1515 | 23.69637 | 0.8791 | 1 | 132 | 456 | 28.947368 | 0.83510 | 1 | 15 | 1890 | 0.7936508 | 0.40130 | 0 | 1243 | 2020 | 61.534653 | 0.7781 | 1 | 816 | 0 | 0.0000000 | 0.1224 | 0 | 34 | 4.1666667 | 0.6664 | 0 | 13 | 730 | 1.7808219 | 0.5406 | 0 | 115 | 730 | 15.753425 | 0.8382 | 1 | 0 | 2020 | 0 | 0.364 | 0 | 2.70312 | 0.56650 | 1 | 3.27660 | 0.8614 | 3 | 0.7781 | 0.7709 | 1 | 2.5316 | 0.5047 | 1 | 9.28942 | 0.6832 | 6 |
| 01001020300 | 01 | 001 | 020300 | AL | Alabama | Autauga County | 3 | South Region | 6 | East South Central Division | 3543 | 1403 | 1287 | 656 | 3533 | 18.56779 | 0.4443 | 0 | 93 | 1552 | 5.992268 | 0.3724 | 0 | 273 | 957 | 28.52665 | 0.45780 | 0 | 178 | 330 | 53.93939 | 0.7152 | 0 | 451 | 1287 | 35.04274 | 0.49930 | 0 | 346 | 2260 | 15.309734 | 0.5950 | 0 | 252 | 3102 | 8.123791 | 0.2596 | 0 | 487 | 13.745413 | 0.5868 | 0 | 998 | 28.16822 | 0.7606 | 1 | 371 | 2224 | 16.68165 | 0.6266 | 0 | 126 | 913 | 13.800657 | 0.46350 | 0 | 0 | 3365 | 0.0000000 | 0.09298 | 0 | 637 | 3543 | 17.979114 | 0.4049 | 0 | 1403 | 10 | 0.7127584 | 0.3015 | 0 | 2 | 0.1425517 | 0.4407 | 0 | 0 | 1287 | 0.0000000 | 0.1238 | 0 | 101 | 1287 | 7.847708 | 0.6443 | 0 | 0 | 3543 | 0 | 0.364 | 0 | 2.17060 | 0.41010 | 0 | 2.53048 | 0.5116 | 1 | 0.4049 | 0.4011 | 0 | 1.8743 | 0.1942 | 0 | 6.98028 | 0.3576 | 1 |
| 01001020400 | 01 | 001 | 020400 | AL | Alabama | Autauga County | 3 | South Region | 6 | East South Central Division | 4840 | 1957 | 1839 | 501 | 4840 | 10.35124 | 0.2177 | 0 | 101 | 2129 | 4.744011 | 0.2447 | 0 | 310 | 1549 | 20.01291 | 0.17080 | 0 | 89 | 290 | 30.68966 | 0.2044 | 0 | 399 | 1839 | 21.69657 | 0.10540 | 0 | 274 | 3280 | 8.353658 | 0.3205 | 0 | 399 | 4293 | 9.294200 | 0.3171 | 0 | 955 | 19.731405 | 0.8643 | 1 | 1195 | 24.69008 | 0.5530 | 0 | 625 | 3328 | 18.78005 | 0.7233 | 0 | 152 | 1374 | 11.062591 | 0.34710 | 0 | 10 | 4537 | 0.2204100 | 0.22560 | 0 | 297 | 4840 | 6.136364 | 0.1647 | 0 | 1957 | 33 | 1.6862545 | 0.3843 | 0 | 25 | 1.2774655 | 0.5516 | 0 | 14 | 1839 | 0.7612833 | 0.3564 | 0 | 19 | 1839 | 1.033170 | 0.1127 | 0 | 0 | 4840 | 0 | 0.364 | 0 | 1.20540 | 0.13470 | 0 | 2.71330 | 0.6129 | 1 | 0.1647 | 0.1632 | 0 | 1.7690 | 0.1591 | 0 | 5.85240 | 0.1954 | 1 |
| 01001020500 | 01 | 001 | 020500 | AL | Alabama | Autauga County | 3 | South Region | 6 | East South Central Division | 9938 | 3969 | 3741 | 1096 | 9938 | 11.02838 | 0.2364 | 0 | 188 | 4937 | 3.807981 | 0.1577 | 0 | 426 | 2406 | 17.70574 | 0.11050 | 0 | 528 | 1335 | 39.55056 | 0.3753 | 0 | 954 | 3741 | 25.50120 | 0.20140 | 0 | 293 | 5983 | 4.897209 | 0.1655 | 0 | 740 | 10110 | 7.319486 | 0.2211 | 0 | 837 | 8.422218 | 0.2408 | 0 | 3012 | 30.30791 | 0.8455 | 1 | 759 | 7155 | 10.60797 | 0.2668 | 0 | 476 | 2529 | 18.821669 | 0.63540 | 0 | 78 | 9297 | 0.8389803 | 0.41110 | 0 | 1970 | 9938 | 19.822902 | 0.4330 | 0 | 3969 | 306 | 7.7097506 | 0.6153 | 0 | 0 | 0.0000000 | 0.2198 | 0 | 7 | 3741 | 0.1871157 | 0.2535 | 0 | 223 | 3741 | 5.960973 | 0.5483 | 0 | 0 | 9938 | 0 | 0.364 | 0 | 0.98210 | 0.08468 | 0 | 2.39960 | 0.4381 | 1 | 0.4330 | 0.4290 | 0 | 2.0009 | 0.2430 | 0 | 5.81560 | 0.1905 | 1 |
| 01001020600 | 01 | 001 | 020600 | AL | Alabama | Autauga County | 3 | South Region | 6 | East South Central Division | 3402 | 1456 | 1308 | 735 | 3402 | 21.60494 | 0.5199 | 0 | 134 | 1720 | 7.790698 | 0.5436 | 0 | 242 | 1032 | 23.44961 | 0.28010 | 0 | 62 | 276 | 22.46377 | 0.1035 | 0 | 304 | 1308 | 23.24159 | 0.14070 | 0 | 301 | 2151 | 13.993491 | 0.5510 | 0 | 355 | 3445 | 10.304790 | 0.3656 | 0 | 386 | 11.346267 | 0.4232 | 0 | 931 | 27.36626 | 0.7200 | 0 | 440 | 2439 | 18.04018 | 0.6912 | 0 | 143 | 924 | 15.476190 | 0.52900 | 0 | 4 | 3254 | 0.1229256 | 0.19840 | 0 | 723 | 3402 | 21.252205 | 0.4519 | 0 | 1456 | 18 | 1.2362637 | 0.3507 | 0 | 433 | 29.7390110 | 0.9468 | 1 | 16 | 1308 | 1.2232416 | 0.4493 | 0 | 28 | 1308 | 2.140673 | 0.2298 | 0 | 0 | 3402 | 0 | 0.364 | 0 | 2.12080 | 0.39510 | 0 | 2.56180 | 0.5288 | 0 | 0.4519 | 0.4477 | 0 | 2.3406 | 0.4048 | 1 | 7.47510 | 0.4314 | 1 |
# Divisional 2010 Data
svi_2010_divisional <- load_svi_data(svi_2010, rank_by = "divisional", location = census_division, percentile=.75)
svi_2010_divisional %>% head() %>% kbl() %>% kable_styling() %>% scroll_box(width = "100%")
| GEOID_2010_trt | FIPS_st | FIPS_county | FIPS_tract | state | state_name | county | region_number | region | division_number | division | E_TOTPOP_10 | E_HU_10 | E_HH_10 | E_POV150_10 | ET_POVSTATUS_10 | EP_POV150_10 | EPL_POV150_10 | F_POV150_10 | E_UNEMP_10 | ET_EMPSTATUS_10 | EP_UNEMP_10 | EPL_UNEMP_10 | F_UNEMP_10 | E_HBURD_OWN_10 | ET_HOUSINGCOST_OWN_10 | EP_HBURD_OWN_10 | EPL_HBURD_OWN_10 | F_HBURD_OWN_10 | E_HBURD_RENT_10 | ET_HOUSINGCOST_RENT_10 | EP_HBURD_RENT_10 | EPL_HBURD_RENT_10 | F_HBURD_RENT_10 | E_HBURD_10 | ET_HOUSINGCOST_10 | EP_HBURD_10 | EPL_HBURD_10 | F_HBURD_10 | E_NOHSDP_10 | ET_EDSTATUS_10 | EP_NOHSDP_10 | EPL_NOHSDP_10 | F_NOHSDP_10 | E_UNINSUR_12 | ET_INSURSTATUS_12 | EP_UNINSUR_12 | EPL_UNINSUR_12 | F_UNINSUR_12 | E_AGE65_10 | EP_AGE65_10 | EPL_AGE65_10 | F_AGE65_10 | E_AGE17_10 | EP_AGE17_10 | EPL_AGE17_10 | F_AGE17_10 | E_DISABL_12 | ET_DISABLSTATUS_12 | EP_DISABL_12 | EPL_DISABL_12 | F_DISABL_12 | E_SNGPNT_10 | ET_FAMILIES_10 | EP_SNGPNT_10 | EPL_SNGPNT_10 | F_SNGPNT_10 | E_LIMENG_10 | ET_POPAGE5UP_10 | EP_LIMENG_10 | EPL_LIMENG_10 | F_LIMENG_10 | E_MINRTY_10 | ET_POPETHRACE_10 | EP_MINRTY_10 | EPL_MINRTY_10 | F_MINRTY_10 | E_STRHU_10 | E_MUNIT_10 | EP_MUNIT_10 | EPL_MUNIT_10 | F_MUNIT_10 | E_MOBILE_10 | EP_MOBILE_10 | EPL_MOBILE_10 | F_MOBILE_10 | E_CROWD_10 | ET_OCCUPANTS_10 | EP_CROWD_10 | EPL_CROWD_10 | F_CROWD_10 | E_NOVEH_10 | ET_KNOWNVEH_10 | EP_NOVEH_10 | EPL_NOVEH_10 | F_NOVEH_10 | E_GROUPQ_10 | ET_HHTYPE_10 | EP_GROUPQ_10 | EPL_GROUPQ_10 | F_GROUPQ_10 | SPL_THEME1 | RPL_THEME1 | F_THEME1 | SPL_THEME2 | RPL_THEME2 | F_THEME2 | SPL_THEME3 | RPL_THEME3 | F_THEME3 | SPL_THEME4 | RPL_THEME4 | F_THEME4 | SPL_THEMES | RPL_THEMES | F_TOTAL |
|---|---|---|---|---|---|---|---|---|---|---|---|---|---|---|---|---|---|---|---|---|---|---|---|---|---|---|---|---|---|---|---|---|---|---|---|---|---|---|---|---|---|---|---|---|---|---|---|---|---|---|---|---|---|---|---|---|---|---|---|---|---|---|---|---|---|---|---|---|---|---|---|---|---|---|---|---|---|---|---|---|---|---|---|---|---|---|---|---|---|---|---|---|---|---|---|---|---|---|---|---|---|---|---|---|---|---|---|---|---|---|---|---|---|---|---|
| 10001040100 | 10 | 001 | 040100 | DE | Delaware | Kent County | 3 | South Region | 5 | South Atlantic Division | 6468 | 2388 | 2272 | 868 | 6455 | 13.446940 | 0.2879 | 0 | 201 | 3230 | 6.222910 | 0.3819 | 0 | 708 | 2036 | 34.77407 | 0.6489 | 0 | 47 | 236 | 19.91525 | 0.07811 | 0 | 755 | 2272 | 33.23063 | 0.4315 | 0 | 691 | 4369 | 15.815976 | 0.5692 | 0 | 400 | 6594 | 6.066121 | 0.12090 | 0 | 688 | 10.636982 | 0.3706 | 0 | 1689 | 26.11317 | 0.6923 | 0 | 725 | 5107 | 14.19620 | 0.4566 | 0 | 209 | 1742 | 11.99770 | 0.3673 | 0 | 0 | 5993 | 0.0000000 | 0.1022 | 0 | 845 | 6468 | 13.06432 | 0.2341 | 0 | 2388 | 0 | 0.000000 | 0.1428 | 0 | 601 | 25.167504 | 0.8423 | 1 | 14 | 2272 | 0.6161972 | 0.3716 | 0 | 92 | 2272 | 4.049296 | 0.4329 | 0 | 0 | 6468 | 0.000000 | 0.3814 | 0 | 1.79140 | 0.2784 | 0 | 1.9890 | 0.2036 | 0 | 0.2341 | 0.2310 | 0 | 2.1710 | 0.3144 | 1 | 6.18550 | 0.2310 | 1 |
| 10001040201 | 10 | 001 | 040201 | DE | Delaware | Kent County | 3 | South Region | 5 | South Atlantic Division | 5208 | 1953 | 1809 | 850 | 5183 | 16.399769 | 0.3672 | 0 | 147 | 2550 | 5.764706 | 0.3364 | 0 | 385 | 1323 | 29.10053 | 0.4581 | 0 | 222 | 486 | 45.67901 | 0.49650 | 0 | 607 | 1809 | 33.55445 | 0.4431 | 0 | 459 | 3090 | 14.854369 | 0.5386 | 0 | 435 | 5283 | 8.233958 | 0.19610 | 0 | 454 | 8.717358 | 0.2561 | 0 | 1588 | 30.49155 | 0.8927 | 1 | 537 | 3716 | 14.45102 | 0.4708 | 0 | 417 | 1343 | 31.04989 | 0.8599 | 1 | 69 | 4835 | 1.4270941 | 0.5240 | 0 | 1881 | 5208 | 36.11751 | 0.5689 | 0 | 1953 | 87 | 4.454685 | 0.5392 | 0 | 148 | 7.578085 | 0.6495 | 0 | 39 | 1809 | 2.1558872 | 0.6471 | 0 | 121 | 1809 | 6.688778 | 0.6124 | 0 | 0 | 5208 | 0.000000 | 0.3814 | 0 | 1.88140 | 0.3053 | 0 | 3.0035 | 0.7667 | 2 | 0.5689 | 0.5614 | 0 | 2.8296 | 0.6516 | 0 | 8.28340 | 0.5452 | 2 |
| 10001040202 | 10 | 001 | 040202 | DE | Delaware | Kent County | 3 | South Region | 5 | South Atlantic Division | 11385 | 4350 | 4041 | 1680 | 10992 | 15.283843 | 0.3360 | 0 | 475 | 5262 | 9.026986 | 0.6217 | 0 | 1237 | 3491 | 35.43397 | 0.6683 | 0 | 255 | 550 | 46.36364 | 0.51190 | 0 | 1492 | 4041 | 36.92155 | 0.5546 | 0 | 751 | 7545 | 9.953612 | 0.3559 | 0 | 803 | 12478 | 6.435326 | 0.13310 | 0 | 1756 | 15.423803 | 0.6665 | 0 | 3042 | 26.71937 | 0.7280 | 0 | 1556 | 9021 | 17.24864 | 0.6195 | 0 | 336 | 3110 | 10.80386 | 0.3143 | 0 | 62 | 10616 | 0.5840241 | 0.3482 | 0 | 3295 | 11385 | 28.94159 | 0.4817 | 0 | 4350 | 100 | 2.298851 | 0.4559 | 0 | 478 | 10.988506 | 0.6962 | 0 | 20 | 4041 | 0.4949270 | 0.3450 | 0 | 192 | 4041 | 4.751299 | 0.4900 | 0 | 387 | 11385 | 3.399209 | 0.8606 | 1 | 2.00130 | 0.3396 | 0 | 2.6765 | 0.5915 | 0 | 0.4817 | 0.4753 | 0 | 2.8477 | 0.6611 | 1 | 8.00720 | 0.5007 | 1 |
| 10001040203 | 10 | 001 | 040203 | DE | Delaware | Kent County | 3 | South Region | 5 | South Atlantic Division | 4643 | 1865 | 1718 | 1441 | 4597 | 31.346530 | 0.7241 | 0 | 99 | 2296 | 4.311847 | 0.2007 | 0 | 362 | 1223 | 29.59935 | 0.4754 | 0 | 271 | 495 | 54.74747 | 0.70810 | 0 | 633 | 1718 | 36.84517 | 0.5523 | 0 | 436 | 2783 | 15.666547 | 0.5647 | 0 | 258 | 5110 | 5.048924 | 0.08961 | 0 | 505 | 10.876588 | 0.3849 | 0 | 1390 | 29.93754 | 0.8755 | 1 | 646 | 3590 | 17.99443 | 0.6562 | 0 | 292 | 1181 | 24.72481 | 0.7632 | 1 | 20 | 4310 | 0.4640371 | 0.3134 | 0 | 1780 | 4643 | 38.33728 | 0.5942 | 0 | 1865 | 91 | 4.879357 | 0.5508 | 0 | 252 | 13.512064 | 0.7236 | 0 | 52 | 1718 | 3.0267753 | 0.7465 | 0 | 197 | 1718 | 11.466822 | 0.7913 | 1 | 0 | 4643 | 0.000000 | 0.3814 | 0 | 2.13141 | 0.3754 | 0 | 2.9932 | 0.7618 | 2 | 0.5942 | 0.5863 | 0 | 3.1936 | 0.8133 | 1 | 8.91241 | 0.6347 | 3 |
| 10001040501 | 10 | 001 | 040501 | DE | Delaware | Kent County | 3 | South Region | 5 | South Atlantic Division | 5172 | 2061 | 1721 | 2008 | 5121 | 39.211092 | 0.8425 | 1 | 134 | 1988 | 6.740443 | 0.4302 | 0 | 443 | 1191 | 37.19563 | 0.7145 | 0 | 312 | 530 | 58.86792 | 0.78710 | 1 | 755 | 1721 | 43.86984 | 0.7444 | 0 | 486 | 3108 | 15.637066 | 0.5640 | 0 | 493 | 4902 | 10.057120 | 0.26220 | 0 | 700 | 13.534416 | 0.5573 | 0 | 1681 | 32.50193 | 0.9414 | 1 | 518 | 3508 | 14.76625 | 0.4887 | 0 | 580 | 1392 | 41.66667 | 0.9424 | 1 | 12 | 4692 | 0.2557545 | 0.2451 | 0 | 3222 | 5172 | 62.29698 | 0.7880 | 1 | 2061 | 281 | 13.634158 | 0.7133 | 0 | 223 | 10.819990 | 0.6938 | 0 | 139 | 1721 | 8.0766996 | 0.9538 | 1 | 63 | 1721 | 3.660662 | 0.3972 | 0 | 0 | 5172 | 0.000000 | 0.3814 | 0 | 2.84330 | 0.5967 | 1 | 3.1749 | 0.8372 | 2 | 0.7880 | 0.7776 | 1 | 3.1395 | 0.7936 | 1 | 9.94570 | 0.7681 | 5 |
| 10001040502 | 10 | 001 | 040502 | DE | Delaware | Kent County | 3 | South Region | 5 | South Atlantic Division | 2087 | 921 | 921 | 192 | 2087 | 9.199808 | 0.1738 | 0 | 35 | 722 | 4.847645 | 0.2495 | 0 | 281 | 700 | 40.14286 | 0.7819 | 1 | 64 | 221 | 28.95928 | 0.17110 | 0 | 345 | 921 | 37.45928 | 0.5710 | 0 | 284 | 1546 | 18.369987 | 0.6484 | 0 | 119 | 2121 | 5.610561 | 0.10710 | 0 | 518 | 24.820316 | 0.9068 | 1 | 480 | 22.99952 | 0.4910 | 0 | 328 | 1527 | 21.48003 | 0.7959 | 1 | 173 | 680 | 25.44118 | 0.7769 | 1 | 100 | 1998 | 5.0050050 | 0.7960 | 1 | 560 | 2087 | 26.83277 | 0.4524 | 0 | 921 | 0 | 0.000000 | 0.1428 | 0 | 273 | 29.641694 | 0.8785 | 1 | 0 | 921 | 0.0000000 | 0.1488 | 0 | 30 | 921 | 3.257329 | 0.3600 | 0 | 0 | 2087 | 0.000000 | 0.3814 | 0 | 1.74980 | 0.2670 | 0 | 3.7666 | 0.9666 | 4 | 0.4524 | 0.4464 | 0 | 1.9115 | 0.2071 | 1 | 7.88030 | 0.4785 | 5 |
# National 2020 Data
svi_2020_national <- load_svi_data(svi_2020, percentile=.75)
svi_2020_national %>% head() %>% kbl() %>% kable_styling() %>% scroll_box(width = "100%")
| GEOID_2010_trt | FIPS_st | FIPS_county | FIPS_tract | state | state_name | county | region_number | region | division_number | division | E_TOTPOP_20 | E_HU_20 | E_HH_20 | E_POV150_20 | ET_POVSTATUS_20 | EP_POV150_20 | EPL_POV150_20 | F_POV150_20 | E_UNEMP_20 | ET_EMPSTATUS_20 | EP_UNEMP_20 | EPL_UNEMP_20 | F_UNEMP_20 | E_HBURD_OWN_20 | ET_HOUSINGCOST_OWN_20 | EP_HBURD_OWN_20 | EPL_HBURD_OWN_20 | F_HBURD_OWN_20 | E_HBURD_RENT_20 | ET_HOUSINGCOST_RENT_20 | EP_HBURD_RENT_20 | EPL_HBURD_RENT_20 | F_HBURD_RENT_20 | E_HBURD_20 | ET_HOUSINGCOST_20 | EP_HBURD_20 | EPL_HBURD_20 | F_HBURD_20 | E_NOHSDP_20 | ET_EDSTATUS_20 | EP_NOHSDP_20 | EPL_NOHSDP_20 | F_NOHSDP_20 | E_UNINSUR_20 | ET_INSURSTATUS_20 | EP_UNINSUR_20 | EPL_UNINSUR_20 | F_UNINSUR_20 | E_AGE65_20 | EP_AGE65_20 | EPL_AGE65_20 | F_AGE65_20 | E_AGE17_20 | EP_AGE17_20 | EPL_AGE17_20 | F_AGE17_20 | E_DISABL_20 | ET_DISABLSTATUS_20 | EP_DISABL_20 | EPL_DISABL_20 | F_DISABL_20 | E_SNGPNT_20 | ET_FAMILIES_20 | EP_SNGPNT_20 | EPL_SNGPNT_20 | F_SNGPNT_20 | E_LIMENG_20 | ET_POPAGE5UP_20 | EP_LIMENG_20 | EPL_LIMENG_20 | F_LIMENG_20 | E_MINRTY_20 | ET_POPETHRACE_20 | EP_MINRTY_20 | EPL_MINRTY_20 | F_MINRTY_20 | E_STRHU_20 | E_MUNIT_20 | EP_MUNIT_20 | EPL_MUNIT_20 | F_MUNIT_20 | E_MOBILE_20 | EP_MOBILE_20 | EPL_MOBILE_20 | F_MOBILE_20 | E_CROWD_20 | ET_OCCUPANTS_20 | EP_CROWD_20 | EPL_CROWD_20 | F_CROWD_20 | E_NOVEH_20 | ET_KNOWNVEH_20 | EP_NOVEH_20 | EPL_NOVEH_20 | F_NOVEH_20 | E_GROUPQ_20 | ET_HHTYPE_20 | EP_GROUPQ_20 | EPL_GROUPQ_20 | F_GROUPQ_20 | SPL_THEME1 | RPL_THEME1 | F_THEME1 | SPL_THEME2 | RPL_THEME2 | F_THEME2 | SPL_THEME3 | RPL_THEME3 | F_THEME3 | SPL_THEME4 | RPL_THEME4 | F_THEME4 | SPL_THEMES | RPL_THEMES | F_TOTAL |
|---|---|---|---|---|---|---|---|---|---|---|---|---|---|---|---|---|---|---|---|---|---|---|---|---|---|---|---|---|---|---|---|---|---|---|---|---|---|---|---|---|---|---|---|---|---|---|---|---|---|---|---|---|---|---|---|---|---|---|---|---|---|---|---|---|---|---|---|---|---|---|---|---|---|---|---|---|---|---|---|---|---|---|---|---|---|---|---|---|---|---|---|---|---|---|---|---|---|---|---|---|---|---|---|---|---|---|---|---|---|---|---|---|---|---|---|
| 01001020100 | 01 | 001 | 020100 | AL | Alabama | Autauga County | 3 | South Region | 6 | East South Central Division | 1941 | 710 | 693 | 352 | 1941 | 18.13498 | 0.4630 | 0 | 18 | 852 | 2.112676 | 0.15070 | 0 | 81 | 507 | 15.976331 | 0.26320 | 0 | 63 | 186 | 33.87097 | 0.2913 | 0 | 144 | 693 | 20.77922 | 0.2230 | 0 | 187 | 1309 | 14.285714 | 0.6928 | 0 | 187 | 1941 | 9.634209 | 0.6617 | 0 | 295 | 15.19835 | 0.4601 | 0 | 415 | 21.38073 | 0.4681 | 0 | 391 | 1526 | 25.62254 | 0.9011 | 1 | 58 | 555 | 10.45045 | 0.3451 | 0 | 0 | 1843 | 0.0000000 | 0.09479 | 0 | 437 | 1941 | 22.51417 | 0.3902 | 0 | 710 | 0 | 0.0000000 | 0.1079 | 0 | 88 | 12.3943662 | 0.8263 | 1 | 0 | 693 | 0.0000000 | 0.09796 | 0 | 10 | 693 | 1.443001 | 0.1643 | 0 | 0 | 1941 | 0.000000 | 0.1831 | 0 | 2.19120 | 0.4084 | 0 | 2.26919 | 0.3503 | 1 | 0.3902 | 0.3869 | 0 | 1.37956 | 0.07216 | 1 | 6.23015 | 0.2314 | 2 |
| 01001020200 | 01 | 001 | 020200 | AL | Alabama | Autauga County | 3 | South Region | 6 | East South Central Division | 1757 | 720 | 573 | 384 | 1511 | 25.41363 | 0.6427 | 0 | 29 | 717 | 4.044630 | 0.41320 | 0 | 33 | 392 | 8.418367 | 0.03542 | 0 | 116 | 181 | 64.08840 | 0.9086 | 1 | 149 | 573 | 26.00349 | 0.4041 | 0 | 139 | 1313 | 10.586443 | 0.5601 | 0 | 91 | 1533 | 5.936073 | 0.4343 | 0 | 284 | 16.16392 | 0.5169 | 0 | 325 | 18.49744 | 0.2851 | 0 | 164 | 1208 | 13.57616 | 0.4127 | 0 | 42 | 359 | 11.69916 | 0.3998 | 0 | 0 | 1651 | 0.0000000 | 0.09479 | 0 | 1116 | 1757 | 63.51736 | 0.7591 | 1 | 720 | 3 | 0.4166667 | 0.2470 | 0 | 5 | 0.6944444 | 0.5106 | 0 | 9 | 573 | 1.5706806 | 0.46880 | 0 | 57 | 573 | 9.947644 | 0.7317 | 0 | 212 | 1757 | 12.066022 | 0.9549 | 1 | 2.45440 | 0.4888 | 0 | 1.70929 | 0.1025 | 0 | 0.7591 | 0.7527 | 1 | 2.91300 | 0.68620 | 1 | 7.83579 | 0.4802 | 2 |
| 01001020300 | 01 | 001 | 020300 | AL | Alabama | Autauga County | 3 | South Region | 6 | East South Central Division | 3694 | 1464 | 1351 | 842 | 3694 | 22.79372 | 0.5833 | 0 | 53 | 1994 | 2.657974 | 0.22050 | 0 | 117 | 967 | 12.099276 | 0.11370 | 0 | 147 | 384 | 38.28125 | 0.3856 | 0 | 264 | 1351 | 19.54108 | 0.1827 | 0 | 317 | 2477 | 12.797739 | 0.6460 | 0 | 127 | 3673 | 3.457664 | 0.2308 | 0 | 464 | 12.56091 | 0.3088 | 0 | 929 | 25.14889 | 0.7080 | 0 | 473 | 2744 | 17.23761 | 0.6211 | 0 | 263 | 975 | 26.97436 | 0.8234 | 1 | 128 | 3586 | 3.5694367 | 0.70770 | 0 | 1331 | 3694 | 36.03140 | 0.5515 | 0 | 1464 | 26 | 1.7759563 | 0.3675 | 0 | 14 | 0.9562842 | 0.5389 | 0 | 35 | 1351 | 2.5906736 | 0.60550 | 0 | 42 | 1351 | 3.108808 | 0.3415 | 0 | 0 | 3694 | 0.000000 | 0.1831 | 0 | 1.86330 | 0.3063 | 0 | 3.16900 | 0.8380 | 1 | 0.5515 | 0.5468 | 0 | 2.03650 | 0.26830 | 0 | 7.62030 | 0.4460 | 1 |
| 01001020400 | 01 | 001 | 020400 | AL | Alabama | Autauga County | 3 | South Region | 6 | East South Central Division | 3539 | 1741 | 1636 | 503 | 3539 | 14.21305 | 0.3472 | 0 | 39 | 1658 | 2.352232 | 0.17990 | 0 | 219 | 1290 | 16.976744 | 0.30880 | 0 | 74 | 346 | 21.38728 | 0.1037 | 0 | 293 | 1636 | 17.90954 | 0.1333 | 0 | 173 | 2775 | 6.234234 | 0.3351 | 0 | 169 | 3529 | 4.788892 | 0.3448 | 0 | 969 | 27.38062 | 0.9225 | 1 | 510 | 14.41085 | 0.1208 | 0 | 670 | 3019 | 22.19278 | 0.8194 | 1 | 148 | 1137 | 13.01671 | 0.4541 | 0 | 89 | 3409 | 2.6107363 | 0.64690 | 0 | 454 | 3539 | 12.82848 | 0.2364 | 0 | 1741 | 143 | 8.2136703 | 0.6028 | 0 | 0 | 0.0000000 | 0.2186 | 0 | 10 | 1636 | 0.6112469 | 0.28340 | 0 | 72 | 1636 | 4.400978 | 0.4538 | 0 | 0 | 3539 | 0.000000 | 0.1831 | 0 | 1.34030 | 0.1575 | 0 | 2.96370 | 0.7496 | 2 | 0.2364 | 0.2344 | 0 | 1.74170 | 0.16270 | 0 | 6.28210 | 0.2389 | 2 |
| 01001020500 | 01 | 001 | 020500 | AL | Alabama | Autauga County | 3 | South Region | 6 | East South Central Division | 10674 | 4504 | 4424 | 1626 | 10509 | 15.47245 | 0.3851 | 0 | 81 | 5048 | 1.604596 | 0.09431 | 0 | 321 | 2299 | 13.962592 | 0.17970 | 0 | 711 | 2125 | 33.45882 | 0.2836 | 0 | 1032 | 4424 | 23.32731 | 0.3109 | 0 | 531 | 6816 | 7.790493 | 0.4251 | 0 | 301 | 10046 | 2.996217 | 0.1894 | 0 | 1613 | 15.11149 | 0.4553 | 0 | 2765 | 25.90407 | 0.7494 | 0 | 1124 | 7281 | 15.43744 | 0.5253 | 0 | 342 | 2912 | 11.74451 | 0.4019 | 0 | 52 | 9920 | 0.5241935 | 0.35230 | 0 | 2603 | 10674 | 24.38636 | 0.4160 | 0 | 4504 | 703 | 15.6083481 | 0.7378 | 0 | 29 | 0.6438721 | 0.5037 | 0 | 37 | 4424 | 0.8363472 | 0.33420 | 0 | 207 | 4424 | 4.679023 | 0.4754 | 0 | 176 | 10674 | 1.648866 | 0.7598 | 1 | 1.40481 | 0.1743 | 0 | 2.48420 | 0.4802 | 0 | 0.4160 | 0.4125 | 0 | 2.81090 | 0.63730 | 1 | 7.11591 | 0.3654 | 1 |
| 01001020600 | 01 | 001 | 020600 | AL | Alabama | Autauga County | 3 | South Region | 6 | East South Central Division | 3536 | 1464 | 1330 | 1279 | 3523 | 36.30429 | 0.8215 | 1 | 34 | 1223 | 2.780049 | 0.23780 | 0 | 321 | 1111 | 28.892889 | 0.75870 | 1 | 67 | 219 | 30.59361 | 0.2305 | 0 | 388 | 1330 | 29.17293 | 0.5075 | 0 | 306 | 2380 | 12.857143 | 0.6480 | 0 | 415 | 3496 | 11.870709 | 0.7535 | 1 | 547 | 15.46946 | 0.4760 | 0 | 982 | 27.77149 | 0.8327 | 1 | 729 | 2514 | 28.99761 | 0.9488 | 1 | 95 | 880 | 10.79545 | 0.3601 | 0 | 0 | 3394 | 0.0000000 | 0.09479 | 0 | 985 | 3536 | 27.85633 | 0.4608 | 0 | 1464 | 0 | 0.0000000 | 0.1079 | 0 | 364 | 24.8633880 | 0.9300 | 1 | 0 | 1330 | 0.0000000 | 0.09796 | 0 | 17 | 1330 | 1.278196 | 0.1463 | 0 | 0 | 3536 | 0.000000 | 0.1831 | 0 | 2.96830 | 0.6434 | 2 | 2.71239 | 0.6156 | 2 | 0.4608 | 0.4569 | 0 | 1.46526 | 0.08976 | 1 | 7.60675 | 0.4440 | 5 |
# Divisional 2020 Data
svi_2020_divisional <- load_svi_data(svi_2020, rank_by = "divisional", location =  census_division, percentile=.75)
svi_2020_divisional %>% head() %>% kbl() %>% kable_styling() %>% scroll_box(width = "100%")
| GEOID_2010_trt | FIPS_st | FIPS_county | FIPS_tract | state | state_name | county | region_number | region | division_number | division | E_TOTPOP_20 | E_HU_20 | E_HH_20 | E_POV150_20 | ET_POVSTATUS_20 | EP_POV150_20 | EPL_POV150_20 | F_POV150_20 | E_UNEMP_20 | ET_EMPSTATUS_20 | EP_UNEMP_20 | EPL_UNEMP_20 | F_UNEMP_20 | E_HBURD_OWN_20 | ET_HOUSINGCOST_OWN_20 | EP_HBURD_OWN_20 | EPL_HBURD_OWN_20 | F_HBURD_OWN_20 | E_HBURD_RENT_20 | ET_HOUSINGCOST_RENT_20 | EP_HBURD_RENT_20 | EPL_HBURD_RENT_20 | F_HBURD_RENT_20 | E_HBURD_20 | ET_HOUSINGCOST_20 | EP_HBURD_20 | EPL_HBURD_20 | F_HBURD_20 | E_NOHSDP_20 | ET_EDSTATUS_20 | EP_NOHSDP_20 | EPL_NOHSDP_20 | F_NOHSDP_20 | E_UNINSUR_20 | ET_INSURSTATUS_20 | EP_UNINSUR_20 | EPL_UNINSUR_20 | F_UNINSUR_20 | E_AGE65_20 | EP_AGE65_20 | EPL_AGE65_20 | F_AGE65_20 | E_AGE17_20 | EP_AGE17_20 | EPL_AGE17_20 | F_AGE17_20 | E_DISABL_20 | ET_DISABLSTATUS_20 | EP_DISABL_20 | EPL_DISABL_20 | F_DISABL_20 | E_SNGPNT_20 | ET_FAMILIES_20 | EP_SNGPNT_20 | EPL_SNGPNT_20 | F_SNGPNT_20 | E_LIMENG_20 | ET_POPAGE5UP_20 | EP_LIMENG_20 | EPL_LIMENG_20 | F_LIMENG_20 | E_MINRTY_20 | ET_POPETHRACE_20 | EP_MINRTY_20 | EPL_MINRTY_20 | F_MINRTY_20 | E_STRHU_20 | E_MUNIT_20 | EP_MUNIT_20 | EPL_MUNIT_20 | F_MUNIT_20 | E_MOBILE_20 | EP_MOBILE_20 | EPL_MOBILE_20 | F_MOBILE_20 | E_CROWD_20 | ET_OCCUPANTS_20 | EP_CROWD_20 | EPL_CROWD_20 | F_CROWD_20 | E_NOVEH_20 | ET_KNOWNVEH_20 | EP_NOVEH_20 | EPL_NOVEH_20 | F_NOVEH_20 | E_GROUPQ_20 | ET_HHTYPE_20 | EP_GROUPQ_20 | EPL_GROUPQ_20 | F_GROUPQ_20 | SPL_THEME1 | RPL_THEME1 | F_THEME1 | SPL_THEME2 | RPL_THEME2 | F_THEME2 | SPL_THEME3 | RPL_THEME3 | F_THEME3 | SPL_THEME4 | RPL_THEME4 | F_THEME4 | SPL_THEMES | RPL_THEMES | F_TOTAL |
|---|---|---|---|---|---|---|---|---|---|---|---|---|---|---|---|---|---|---|---|---|---|---|---|---|---|---|---|---|---|---|---|---|---|---|---|---|---|---|---|---|---|---|---|---|---|---|---|---|---|---|---|---|---|---|---|---|---|---|---|---|---|---|---|---|---|---|---|---|---|---|---|---|---|---|---|---|---|---|---|---|---|---|---|---|---|---|---|---|---|---|---|---|---|---|---|---|---|---|---|---|---|---|---|---|---|---|---|---|---|---|---|---|---|---|---|
| 10001040100 | 10 | 001 | 040100 | DE | Delaware | Kent County | 3 | South Region | 5 | South Atlantic Division | 7531 | 2850 | 2587 | 2226 | 7519 | 29.60500 | 0.7109 | 0 | 392 | 3820 | 10.261780 | 0.8786 | 1 | 527 | 2067 | 25.49589 | 0.6863 | 0 | 180 | 520 | 34.61538 | 0.2805 | 0 | 707 | 2587 | 27.32895 | 0.4528 | 0 | 765 | 4950 | 15.454546 | 0.7234 | 0 | 353 | 7523 | 4.692277 | 0.2050 | 0 | 1007 | 13.37140 | 0.3312 | 0 | 2035 | 27.02164 | 0.8398 | 1 | 1227 | 5488.000 | 22.35787 | 0.8093 | 1 | 239 | 1893.0000 | 12.62546 | 0.4261 | 0 | 276 | 7262 | 3.8006059 | 0.75930 | 1 | 1507 | 7531.000 | 20.01062 | 0.2789 | 0 | 2850 | 1 | 0.0350877 | 0.2526 | 0 | 697 | 24.456140 | 0.8585 | 1 | 93 | 2587 | 3.5948976 | 0.7607 | 1 | 55 | 2587.0000 | 2.126015 | 0.2641 | 0 | 0 | 7531 | 0.000000 | 0.2111 | 0 | 2.9707 | 0.6413 | 1 | 3.16570 | 0.8440 | 3 | 0.2789 | 0.2755 | 0 | 2.3470 | 0.4035 | 2 | 8.76230 | 0.6215 | 6 |
| 10001040201 | 10 | 001 | 040201 | DE | Delaware | Kent County | 3 | South Region | 5 | South Atlantic Division | 4770 | 1906 | 1732 | 755 | 4692 | 16.09122 | 0.3758 | 0 | 92 | 2500 | 3.680000 | 0.3633 | 0 | 197 | 1184 | 16.63851 | 0.2804 | 0 | 235 | 548 | 42.88321 | 0.4609 | 0 | 432 | 1732 | 24.94226 | 0.3622 | 0 | 251 | 3100 | 8.096774 | 0.4085 | 0 | 228 | 4770 | 4.779874 | 0.2116 | 0 | 549 | 11.50943 | 0.2329 | 0 | 1352 | 28.34382 | 0.8865 | 1 | 490 | 3418.125 | 14.33535 | 0.4309 | 0 | 328 | 1263.2064 | 25.96567 | 0.8111 | 1 | 0 | 4526 | 0.0000000 | 0.09987 | 0 | 1875 | 4769.908 | 39.30893 | 0.5372 | 0 | 1906 | 72 | 3.7775446 | 0.4876 | 0 | 128 | 6.715635 | 0.6610 | 0 | 10 | 1732 | 0.5773672 | 0.3165 | 0 | 32 | 1731.7111 | 1.847883 | 0.2303 | 0 | 0 | 4770 | 0.000000 | 0.2111 | 0 | 1.7214 | 0.2531 | 0 | 2.46127 | 0.4594 | 2 | 0.5372 | 0.5306 | 0 | 1.9065 | 0.2183 | 0 | 6.62637 | 0.2829 | 2 |
| 10001040202 | 10 | 001 | 040202 | DE | Delaware | Kent County | 3 | South Region | 5 | South Atlantic Division | 16537 | 5776 | 5768 | 2288 | 16141 | 14.17508 | 0.3194 | 0 | 237 | 8403 | 2.820421 | 0.2461 | 0 | 1493 | 4973 | 30.02212 | 0.8197 | 1 | 315 | 795 | 39.62264 | 0.3868 | 0 | 1808 | 5768 | 31.34535 | 0.5823 | 0 | 986 | 11516 | 8.562001 | 0.4338 | 0 | 1326 | 15886 | 8.346972 | 0.4327 | 0 | 2472 | 14.94830 | 0.4225 | 0 | 3814 | 23.06343 | 0.6287 | 0 | 1742 | 12086.000 | 14.41337 | 0.4347 | 0 | 742 | 4396.0000 | 16.87898 | 0.5844 | 0 | 185 | 15466 | 1.1961722 | 0.50680 | 0 | 7164 | 16537.000 | 43.32104 | 0.5828 | 0 | 5776 | 138 | 2.3891967 | 0.4352 | 0 | 385 | 6.665513 | 0.6600 | 0 | 0 | 5768 | 0.0000000 | 0.1168 | 0 | 165 | 5768.0000 | 2.860610 | 0.3442 | 0 | 373 | 16537 | 2.255548 | 0.8244 | 1 | 2.0143 | 0.3437 | 0 | 2.57710 | 0.5357 | 0 | 0.5828 | 0.5757 | 0 | 2.3806 | 0.4199 | 1 | 7.55480 | 0.4282 | 1 |
| 10001040203 | 10 | 001 | 040203 | DE | Delaware | Kent County | 3 | South Region | 5 | South Atlantic Division | 5310 | 2259 | 2097 | 1163 | 5283 | 22.01401 | 0.5368 | 0 | 69 | 2413 | 2.859511 | 0.2514 | 0 | 418 | 1516 | 27.57256 | 0.7526 | 1 | 382 | 581 | 65.74871 | 0.9074 | 1 | 800 | 2097 | 38.14974 | 0.7609 | 1 | 162 | 3597 | 4.503753 | 0.2087 | 0 | 704 | 5297 | 13.290542 | 0.7059 | 0 | 1320 | 24.85876 | 0.8299 | 1 | 1429 | 26.91149 | 0.8347 | 1 | 513 | 3868.000 | 13.26267 | 0.3691 | 0 | 290 | 1430.0000 | 20.27972 | 0.6849 | 0 | 34 | 5062 | 0.6716713 | 0.39280 | 0 | 2582 | 5310.000 | 48.62524 | 0.6381 | 0 | 2259 | 153 | 6.7729084 | 0.5732 | 0 | 291 | 12.881806 | 0.7430 | 0 | 45 | 2097 | 2.1459227 | 0.6153 | 0 | 71 | 2097.0000 | 3.385789 | 0.3952 | 0 | 5 | 5310 | 0.094162 | 0.4618 | 0 | 2.4637 | 0.4806 | 1 | 3.11140 | 0.8223 | 2 | 0.6381 | 0.6303 | 0 | 2.7885 | 0.6181 | 0 | 9.00170 | 0.6555 | 3 |
| 10001040501 | 10 | 001 | 040501 | DE | Delaware | Kent County | 3 | South Region | 5 | South Atlantic Division | 4731 | 2061 | 1979 | 1016 | 4703 | 21.60323 | 0.5269 | 0 | 208 | 2511 | 8.283552 | 0.8001 | 1 | 402 | 1423 | 28.25018 | 0.7714 | 1 | 300 | 556 | 53.95683 | 0.7197 | 0 | 702 | 1979 | 35.47246 | 0.6995 | 0 | 412 | 3336 | 12.350120 | 0.6094 | 0 | 230 | 4731 | 4.861552 | 0.2173 | 0 | 964 | 20.37624 | 0.6876 | 0 | 926 | 19.57303 | 0.4025 | 0 | 959 | 3805.000 | 25.20368 | 0.8859 | 1 | 278 | 1180.0000 | 23.55932 | 0.7634 | 1 | 244 | 4465 | 5.4647256 | 0.82700 | 1 | 2404 | 4731.000 | 50.81378 | 0.6589 | 0 | 2061 | 260 | 12.6152353 | 0.6783 | 0 | 299 | 14.507521 | 0.7619 | 1 | 39 | 1979 | 1.9706923 | 0.5899 | 0 | 133 | 1979.0000 | 6.720566 | 0.6323 | 0 | 0 | 4731 | 0.000000 | 0.2111 | 0 | 2.8532 | 0.6053 | 1 | 3.56640 | 0.9479 | 3 | 0.6589 | 0.6509 | 0 | 2.8735 | 0.6632 | 1 | 9.95200 | 0.7755 | 5 |
| 10001040502 | 10 | 001 | 040502 | DE | Delaware | Kent County | 3 | South Region | 5 | South Atlantic Division | 2555 | 1030 | 954 | 565 | 2555 | 22.11350 | 0.5385 | 0 | 135 | 1154 | 11.698440 | 0.9175 | 1 | 144 | 691 | 20.83936 | 0.4865 | 0 | 168 | 262 | 64.12214 | 0.8894 | 1 | 312 | 953 | 32.73872 | 0.6259 | 0 | 192 | 1782 | 10.774411 | 0.5377 | 0 | 198 | 2519 | 7.860262 | 0.4016 | 0 | 519 | 20.31311 | 0.6851 | 0 | 664 | 25.98826 | 0.7939 | 1 | 341 | 1854.295 | 18.38974 | 0.6427 | 0 | 195 | 614.6519 | 31.72527 | 0.8870 | 1 | 75 | 2351 | 3.1901319 | 0.72360 | 0 | 1215 | 2555.353 | 47.54725 | 0.6272 | 0 | 1030 | 61 | 5.9223301 | 0.5514 | 0 | 170 | 16.504854 | 0.7844 | 1 | 58 | 954 | 6.0796646 | 0.8947 | 1 | 83 | 953.5886 | 8.703963 | 0.7220 | 0 | 0 | 2555 | 0.000000 | 0.2111 | 0 | 3.0212 | 0.6565 | 1 | 3.73230 | 0.9680 | 2 | 0.6272 | 0.6195 | 0 | 3.1636 | 0.7893 | 2 | 10.54430 | 0.8433 | 5 |
Merge 2010 & 2020 data
# Find tracts with divisional data in both 2010 and 2020
svi_divisional <- merge_svi_data(svi_2010_divisional, svi_2020_divisional)
svi_divisional %>% head() %>% kbl() %>% kable_styling() %>% scroll_box(width = "100%")
| GEOID_2010_trt | FIPS_st | FIPS_county | FIPS_tract | state | state_name | county | region_number | region | division_number | division | E_TOTPOP_10 | E_HU_10 | E_HH_10 | E_POV150_10 | ET_POVSTATUS_10 | EP_POV150_10 | EPL_POV150_10 | F_POV150_10 | E_UNEMP_10 | ET_EMPSTATUS_10 | EP_UNEMP_10 | EPL_UNEMP_10 | F_UNEMP_10 | E_HBURD_OWN_10 | ET_HOUSINGCOST_OWN_10 | EP_HBURD_OWN_10 | EPL_HBURD_OWN_10 | F_HBURD_OWN_10 | E_HBURD_RENT_10 | ET_HOUSINGCOST_RENT_10 | EP_HBURD_RENT_10 | EPL_HBURD_RENT_10 | F_HBURD_RENT_10 | E_HBURD_10 | ET_HOUSINGCOST_10 | EP_HBURD_10 | EPL_HBURD_10 | F_HBURD_10 | E_NOHSDP_10 | ET_EDSTATUS_10 | EP_NOHSDP_10 | EPL_NOHSDP_10 | F_NOHSDP_10 | E_UNINSUR_12 | ET_INSURSTATUS_12 | EP_UNINSUR_12 | EPL_UNINSUR_12 | F_UNINSUR_12 | E_AGE65_10 | EP_AGE65_10 | EPL_AGE65_10 | F_AGE65_10 | E_AGE17_10 | EP_AGE17_10 | EPL_AGE17_10 | F_AGE17_10 | E_DISABL_12 | ET_DISABLSTATUS_12 | EP_DISABL_12 | EPL_DISABL_12 | F_DISABL_12 | E_SNGPNT_10 | ET_FAMILIES_10 | EP_SNGPNT_10 | EPL_SNGPNT_10 | F_SNGPNT_10 | E_LIMENG_10 | ET_POPAGE5UP_10 | EP_LIMENG_10 | EPL_LIMENG_10 | F_LIMENG_10 | E_MINRTY_10 | ET_POPETHRACE_10 | EP_MINRTY_10 | EPL_MINRTY_10 | F_MINRTY_10 | E_STRHU_10 | E_MUNIT_10 | EP_MUNIT_10 | EPL_MUNIT_10 | F_MUNIT_10 | E_MOBILE_10 | EP_MOBILE_10 | EPL_MOBILE_10 | F_MOBILE_10 | E_CROWD_10 | ET_OCCUPANTS_10 | EP_CROWD_10 | EPL_CROWD_10 | F_CROWD_10 | E_NOVEH_10 | ET_KNOWNVEH_10 | EP_NOVEH_10 | EPL_NOVEH_10 | F_NOVEH_10 | E_GROUPQ_10 | ET_HHTYPE_10 | EP_GROUPQ_10 | EPL_GROUPQ_10 | F_GROUPQ_10 | SPL_THEME1_10 | RPL_THEME1_10 | F_THEME1_10 | SPL_THEME2_10 | RPL_THEME2_10 | F_THEME2_10 | SPL_THEME3_10 | RPL_THEME3_10 | F_THEME3_10 | SPL_THEME4_10 | RPL_THEME4_10 | F_THEME4_10 | SPL_THEMES_10 | RPL_THEMES_10 | F_TOTAL_10 | E_TOTPOP_20 | E_HU_20 | E_HH_20 | E_POV150_20 | ET_POVSTATUS_20 | EP_POV150_20 | EPL_POV150_20 | F_POV150_20 | E_UNEMP_20 | ET_EMPSTATUS_20 | EP_UNEMP_20 | EPL_UNEMP_20 | F_UNEMP_20 | E_HBURD_OWN_20 | ET_HOUSINGCOST_OWN_20 | EP_HBURD_OWN_20 | EPL_HBURD_OWN_20 | F_HBURD_OWN_20 | E_HBURD_RENT_20 | ET_HOUSINGCOST_RENT_20 | EP_HBURD_RENT_20 | EPL_HBURD_RENT_20 | F_HBURD_RENT_20 | E_HBURD_20 | ET_HOUSINGCOST_20 | EP_HBURD_20 | EPL_HBURD_20 | F_HBURD_20 | E_NOHSDP_20 | ET_EDSTATUS_20 | EP_NOHSDP_20 | EPL_NOHSDP_20 | F_NOHSDP_20 | E_UNINSUR_20 | ET_INSURSTATUS_20 | EP_UNINSUR_20 | EPL_UNINSUR_20 | F_UNINSUR_20 | E_AGE65_20 | EP_AGE65_20 | EPL_AGE65_20 | F_AGE65_20 | E_AGE17_20 | EP_AGE17_20 | EPL_AGE17_20 | F_AGE17_20 | E_DISABL_20 | ET_DISABLSTATUS_20 | EP_DISABL_20 | EPL_DISABL_20 | F_DISABL_20 | E_SNGPNT_20 | ET_FAMILIES_20 | EP_SNGPNT_20 | EPL_SNGPNT_20 | F_SNGPNT_20 | E_LIMENG_20 | ET_POPAGE5UP_20 | EP_LIMENG_20 | EPL_LIMENG_20 | F_LIMENG_20 | E_MINRTY_20 | ET_POPETHRACE_20 | EP_MINRTY_20 | EPL_MINRTY_20 | F_MINRTY_20 | E_STRHU_20 | E_MUNIT_20 | EP_MUNIT_20 | EPL_MUNIT_20 | F_MUNIT_20 | E_MOBILE_20 | EP_MOBILE_20 | EPL_MOBILE_20 | F_MOBILE_20 | E_CROWD_20 | ET_OCCUPANTS_20 | EP_CROWD_20 | EPL_CROWD_20 | F_CROWD_20 | E_NOVEH_20 | ET_KNOWNVEH_20 | EP_NOVEH_20 | EPL_NOVEH_20 | F_NOVEH_20 | E_GROUPQ_20 | ET_HHTYPE_20 | EP_GROUPQ_20 | EPL_GROUPQ_20 | F_GROUPQ_20 | SPL_THEME1_20 | RPL_THEME1_20 | F_THEME1_20 | SPL_THEME2_20 | RPL_THEME2_20 | F_THEME2_20 | SPL_THEME3_20 | RPL_THEME3_20 | F_THEME3_20 | SPL_THEME4_20 | RPL_THEME4_20 | F_THEME4_20 | SPL_THEMES_20 | RPL_THEMES_20 | F_TOTAL_20 |
|---|---|---|---|---|---|---|---|---|---|---|---|---|---|---|---|---|---|---|---|---|---|---|---|---|---|---|---|---|---|---|---|---|---|---|---|---|---|---|---|---|---|---|---|---|---|---|---|---|---|---|---|---|---|---|---|---|---|---|---|---|---|---|---|---|---|---|---|---|---|---|---|---|---|---|---|---|---|---|---|---|---|---|---|---|---|---|---|---|---|---|---|---|---|---|---|---|---|---|---|---|---|---|---|---|---|---|---|---|---|---|---|---|---|---|---|---|---|---|---|---|---|---|---|---|---|---|---|---|---|---|---|---|---|---|---|---|---|---|---|---|---|---|---|---|---|---|---|---|---|---|---|---|---|---|---|---|---|---|---|---|---|---|---|---|---|---|---|---|---|---|---|---|---|---|---|---|---|---|---|---|---|---|---|---|---|---|---|---|---|---|---|---|---|---|---|---|---|---|---|---|---|---|---|---|---|---|---|---|---|---|---|---|---|---|---|---|---|---|---|---|
| 10001040100 | 10 | 001 | 040100 | DE | Delaware | Kent County | 3 | South Region | 5 | South Atlantic Division | 6468 | 2388 | 2272 | 868 | 6455 | 13.446940 | 0.2879 | 0 | 201 | 3230 | 6.222910 | 0.3819 | 0 | 708 | 2036 | 34.77407 | 0.6489 | 0 | 47 | 236 | 19.91525 | 0.07811 | 0 | 755 | 2272 | 33.23063 | 0.4315 | 0 | 691 | 4369 | 15.815976 | 0.5692 | 0 | 400 | 6594 | 6.066121 | 0.12090 | 0 | 688 | 10.636982 | 0.3706 | 0 | 1689 | 26.11317 | 0.6923 | 0 | 725 | 5107 | 14.19620 | 0.4566 | 0 | 209 | 1742 | 11.99770 | 0.3673 | 0 | 0 | 5993 | 0.0000000 | 0.1022 | 0 | 845 | 6468 | 13.06432 | 0.2341 | 0 | 2388 | 0 | 0.000000 | 0.1428 | 0 | 601 | 25.167504 | 0.8423 | 1 | 14 | 2272 | 0.6161972 | 0.3716 | 0 | 92 | 2272 | 4.049296 | 0.4329 | 0 | 0 | 6468 | 0.000000 | 0.3814 | 0 | 1.79140 | 0.2784 | 0 | 1.9890 | 0.2036 | 0 | 0.2341 | 0.2310 | 0 | 2.1710 | 0.3144 | 1 | 6.18550 | 0.2310 | 1 | 7531 | 2850 | 2587 | 2226 | 7519 | 29.60500 | 0.7109 | 0 | 392 | 3820 | 10.261780 | 0.8786 | 1 | 527 | 2067 | 25.49589 | 0.6863 | 0 | 180 | 520 | 34.61538 | 0.2805 | 0 | 707 | 2587 | 27.32895 | 0.4528 | 0 | 765 | 4950 | 15.454546 | 0.7234 | 0 | 353 | 7523 | 4.692277 | 0.2050 | 0 | 1007 | 13.37140 | 0.3312 | 0 | 2035 | 27.02164 | 0.8398 | 1 | 1227 | 5488.000 | 22.35787 | 0.8093 | 1 | 239 | 1893.0000 | 12.62546 | 0.4261 | 0 | 276 | 7262 | 3.8006059 | 0.75930 | 1 | 1507 | 7531.000 | 20.01062 | 0.2789 | 0 | 2850 | 1 | 0.0350877 | 0.2526 | 0 | 697 | 24.456140 | 0.8585 | 1 | 93 | 2587 | 3.5948976 | 0.7607 | 1 | 55 | 2587.0000 | 2.126015 | 0.2641 | 0 | 0 | 7531 | 0.000000 | 0.2111 | 0 | 2.9707 | 0.6413 | 1 | 3.16570 | 0.8440 | 3 | 0.2789 | 0.2755 | 0 | 2.3470 | 0.4035 | 2 | 8.76230 | 0.6215 | 6 |
| 10001040201 | 10 | 001 | 040201 | DE | Delaware | Kent County | 3 | South Region | 5 | South Atlantic Division | 5208 | 1953 | 1809 | 850 | 5183 | 16.399769 | 0.3672 | 0 | 147 | 2550 | 5.764706 | 0.3364 | 0 | 385 | 1323 | 29.10053 | 0.4581 | 0 | 222 | 486 | 45.67901 | 0.49650 | 0 | 607 | 1809 | 33.55445 | 0.4431 | 0 | 459 | 3090 | 14.854369 | 0.5386 | 0 | 435 | 5283 | 8.233958 | 0.19610 | 0 | 454 | 8.717358 | 0.2561 | 0 | 1588 | 30.49155 | 0.8927 | 1 | 537 | 3716 | 14.45102 | 0.4708 | 0 | 417 | 1343 | 31.04989 | 0.8599 | 1 | 69 | 4835 | 1.4270941 | 0.5240 | 0 | 1881 | 5208 | 36.11751 | 0.5689 | 0 | 1953 | 87 | 4.454685 | 0.5392 | 0 | 148 | 7.578085 | 0.6495 | 0 | 39 | 1809 | 2.1558872 | 0.6471 | 0 | 121 | 1809 | 6.688778 | 0.6124 | 0 | 0 | 5208 | 0.000000 | 0.3814 | 0 | 1.88140 | 0.3053 | 0 | 3.0035 | 0.7667 | 2 | 0.5689 | 0.5614 | 0 | 2.8296 | 0.6516 | 0 | 8.28340 | 0.5452 | 2 | 4770 | 1906 | 1732 | 755 | 4692 | 16.09122 | 0.3758 | 0 | 92 | 2500 | 3.680000 | 0.3633 | 0 | 197 | 1184 | 16.63851 | 0.2804 | 0 | 235 | 548 | 42.88321 | 0.4609 | 0 | 432 | 1732 | 24.94226 | 0.3622 | 0 | 251 | 3100 | 8.096774 | 0.4085 | 0 | 228 | 4770 | 4.779874 | 0.2116 | 0 | 549 | 11.50943 | 0.2329 | 0 | 1352 | 28.34382 | 0.8865 | 1 | 490 | 3418.125 | 14.33535 | 0.4309 | 0 | 328 | 1263.2064 | 25.96567 | 0.8111 | 1 | 0 | 4526 | 0.0000000 | 0.09987 | 0 | 1875 | 4769.908 | 39.30893 | 0.5372 | 0 | 1906 | 72 | 3.7775446 | 0.4876 | 0 | 128 | 6.715635 | 0.6610 | 0 | 10 | 1732 | 0.5773672 | 0.3165 | 0 | 32 | 1731.7111 | 1.847883 | 0.2303 | 0 | 0 | 4770 | 0.000000 | 0.2111 | 0 | 1.7214 | 0.2531 | 0 | 2.46127 | 0.4594 | 2 | 0.5372 | 0.5306 | 0 | 1.9065 | 0.2183 | 0 | 6.62637 | 0.2829 | 2 |
| 10001040202 | 10 | 001 | 040202 | DE | Delaware | Kent County | 3 | South Region | 5 | South Atlantic Division | 11385 | 4350 | 4041 | 1680 | 10992 | 15.283843 | 0.3360 | 0 | 475 | 5262 | 9.026986 | 0.6217 | 0 | 1237 | 3491 | 35.43397 | 0.6683 | 0 | 255 | 550 | 46.36364 | 0.51190 | 0 | 1492 | 4041 | 36.92155 | 0.5546 | 0 | 751 | 7545 | 9.953612 | 0.3559 | 0 | 803 | 12478 | 6.435326 | 0.13310 | 0 | 1756 | 15.423803 | 0.6665 | 0 | 3042 | 26.71937 | 0.7280 | 0 | 1556 | 9021 | 17.24864 | 0.6195 | 0 | 336 | 3110 | 10.80386 | 0.3143 | 0 | 62 | 10616 | 0.5840241 | 0.3482 | 0 | 3295 | 11385 | 28.94159 | 0.4817 | 0 | 4350 | 100 | 2.298851 | 0.4559 | 0 | 478 | 10.988506 | 0.6962 | 0 | 20 | 4041 | 0.4949270 | 0.3450 | 0 | 192 | 4041 | 4.751299 | 0.4900 | 0 | 387 | 11385 | 3.399209 | 0.8606 | 1 | 2.00130 | 0.3396 | 0 | 2.6765 | 0.5915 | 0 | 0.4817 | 0.4753 | 0 | 2.8477 | 0.6611 | 1 | 8.00720 | 0.5007 | 1 | 16537 | 5776 | 5768 | 2288 | 16141 | 14.17508 | 0.3194 | 0 | 237 | 8403 | 2.820421 | 0.2461 | 0 | 1493 | 4973 | 30.02212 | 0.8197 | 1 | 315 | 795 | 39.62264 | 0.3868 | 0 | 1808 | 5768 | 31.34535 | 0.5823 | 0 | 986 | 11516 | 8.562001 | 0.4338 | 0 | 1326 | 15886 | 8.346972 | 0.4327 | 0 | 2472 | 14.94830 | 0.4225 | 0 | 3814 | 23.06343 | 0.6287 | 0 | 1742 | 12086.000 | 14.41337 | 0.4347 | 0 | 742 | 4396.0000 | 16.87898 | 0.5844 | 0 | 185 | 15466 | 1.1961722 | 0.50680 | 0 | 7164 | 16537.000 | 43.32104 | 0.5828 | 0 | 5776 | 138 | 2.3891967 | 0.4352 | 0 | 385 | 6.665513 | 0.6600 | 0 | 0 | 5768 | 0.0000000 | 0.1168 | 0 | 165 | 5768.0000 | 2.860610 | 0.3442 | 0 | 373 | 16537 | 2.255548 | 0.8244 | 1 | 2.0143 | 0.3437 | 0 | 2.57710 | 0.5357 | 0 | 0.5828 | 0.5757 | 0 | 2.3806 | 0.4199 | 1 | 7.55480 | 0.4282 | 1 |
| 10001040203 | 10 | 001 | 040203 | DE | Delaware | Kent County | 3 | South Region | 5 | South Atlantic Division | 4643 | 1865 | 1718 | 1441 | 4597 | 31.346530 | 0.7241 | 0 | 99 | 2296 | 4.311847 | 0.2007 | 0 | 362 | 1223 | 29.59935 | 0.4754 | 0 | 271 | 495 | 54.74747 | 0.70810 | 0 | 633 | 1718 | 36.84517 | 0.5523 | 0 | 436 | 2783 | 15.666547 | 0.5647 | 0 | 258 | 5110 | 5.048924 | 0.08961 | 0 | 505 | 10.876588 | 0.3849 | 0 | 1390 | 29.93754 | 0.8755 | 1 | 646 | 3590 | 17.99443 | 0.6562 | 0 | 292 | 1181 | 24.72481 | 0.7632 | 1 | 20 | 4310 | 0.4640371 | 0.3134 | 0 | 1780 | 4643 | 38.33728 | 0.5942 | 0 | 1865 | 91 | 4.879357 | 0.5508 | 0 | 252 | 13.512064 | 0.7236 | 0 | 52 | 1718 | 3.0267753 | 0.7465 | 0 | 197 | 1718 | 11.466822 | 0.7913 | 1 | 0 | 4643 | 0.000000 | 0.3814 | 0 | 2.13141 | 0.3754 | 0 | 2.9932 | 0.7618 | 2 | 0.5942 | 0.5863 | 0 | 3.1936 | 0.8133 | 1 | 8.91241 | 0.6347 | 3 | 5310 | 2259 | 2097 | 1163 | 5283 | 22.01401 | 0.5368 | 0 | 69 | 2413 | 2.859511 | 0.2514 | 0 | 418 | 1516 | 27.57256 | 0.7526 | 1 | 382 | 581 | 65.74871 | 0.9074 | 1 | 800 | 2097 | 38.14974 | 0.7609 | 1 | 162 | 3597 | 4.503753 | 0.2087 | 0 | 704 | 5297 | 13.290542 | 0.7059 | 0 | 1320 | 24.85876 | 0.8299 | 1 | 1429 | 26.91149 | 0.8347 | 1 | 513 | 3868.000 | 13.26267 | 0.3691 | 0 | 290 | 1430.0000 | 20.27972 | 0.6849 | 0 | 34 | 5062 | 0.6716713 | 0.39280 | 0 | 2582 | 5310.000 | 48.62524 | 0.6381 | 0 | 2259 | 153 | 6.7729084 | 0.5732 | 0 | 291 | 12.881806 | 0.7430 | 0 | 45 | 2097 | 2.1459227 | 0.6153 | 0 | 71 | 2097.0000 | 3.385789 | 0.3952 | 0 | 5 | 5310 | 0.094162 | 0.4618 | 0 | 2.4637 | 0.4806 | 1 | 3.11140 | 0.8223 | 2 | 0.6381 | 0.6303 | 0 | 2.7885 | 0.6181 | 0 | 9.00170 | 0.6555 | 3 |
| 10001040501 | 10 | 001 | 040501 | DE | Delaware | Kent County | 3 | South Region | 5 | South Atlantic Division | 5172 | 2061 | 1721 | 2008 | 5121 | 39.211092 | 0.8425 | 1 | 134 | 1988 | 6.740443 | 0.4302 | 0 | 443 | 1191 | 37.19563 | 0.7145 | 0 | 312 | 530 | 58.86792 | 0.78710 | 1 | 755 | 1721 | 43.86984 | 0.7444 | 0 | 486 | 3108 | 15.637066 | 0.5640 | 0 | 493 | 4902 | 10.057120 | 0.26220 | 0 | 700 | 13.534416 | 0.5573 | 0 | 1681 | 32.50193 | 0.9414 | 1 | 518 | 3508 | 14.76625 | 0.4887 | 0 | 580 | 1392 | 41.66667 | 0.9424 | 1 | 12 | 4692 | 0.2557545 | 0.2451 | 0 | 3222 | 5172 | 62.29698 | 0.7880 | 1 | 2061 | 281 | 13.634158 | 0.7133 | 0 | 223 | 10.819990 | 0.6938 | 0 | 139 | 1721 | 8.0766996 | 0.9538 | 1 | 63 | 1721 | 3.660662 | 0.3972 | 0 | 0 | 5172 | 0.000000 | 0.3814 | 0 | 2.84330 | 0.5967 | 1 | 3.1749 | 0.8372 | 2 | 0.7880 | 0.7776 | 1 | 3.1395 | 0.7936 | 1 | 9.94570 | 0.7681 | 5 | 4731 | 2061 | 1979 | 1016 | 4703 | 21.60323 | 0.5269 | 0 | 208 | 2511 | 8.283552 | 0.8001 | 1 | 402 | 1423 | 28.25018 | 0.7714 | 1 | 300 | 556 | 53.95683 | 0.7197 | 0 | 702 | 1979 | 35.47246 | 0.6995 | 0 | 412 | 3336 | 12.350120 | 0.6094 | 0 | 230 | 4731 | 4.861552 | 0.2173 | 0 | 964 | 20.37624 | 0.6876 | 0 | 926 | 19.57303 | 0.4025 | 0 | 959 | 3805.000 | 25.20368 | 0.8859 | 1 | 278 | 1180.0000 | 23.55932 | 0.7634 | 1 | 244 | 4465 | 5.4647256 | 0.82700 | 1 | 2404 | 4731.000 | 50.81378 | 0.6589 | 0 | 2061 | 260 | 12.6152353 | 0.6783 | 0 | 299 | 14.507521 | 0.7619 | 1 | 39 | 1979 | 1.9706923 | 0.5899 | 0 | 133 | 1979.0000 | 6.720566 | 0.6323 | 0 | 0 | 4731 | 0.000000 | 0.2111 | 0 | 2.8532 | 0.6053 | 1 | 3.56640 | 0.9479 | 3 | 0.6589 | 0.6509 | 0 | 2.8735 | 0.6632 | 1 | 9.95200 | 0.7755 | 5 |
| 10001040502 | 10 | 001 | 040502 | DE | Delaware | Kent County | 3 | South Region | 5 | South Atlantic Division | 2087 | 921 | 921 | 192 | 2087 | 9.199808 | 0.1738 | 0 | 35 | 722 | 4.847645 | 0.2495 | 0 | 281 | 700 | 40.14286 | 0.7819 | 1 | 64 | 221 | 28.95928 | 0.17110 | 0 | 345 | 921 | 37.45928 | 0.5710 | 0 | 284 | 1546 | 18.369987 | 0.6484 | 0 | 119 | 2121 | 5.610561 | 0.10710 | 0 | 518 | 24.820316 | 0.9068 | 1 | 480 | 22.99952 | 0.4910 | 0 | 328 | 1527 | 21.48003 | 0.7959 | 1 | 173 | 680 | 25.44118 | 0.7769 | 1 | 100 | 1998 | 5.0050050 | 0.7960 | 1 | 560 | 2087 | 26.83277 | 0.4524 | 0 | 921 | 0 | 0.000000 | 0.1428 | 0 | 273 | 29.641694 | 0.8785 | 1 | 0 | 921 | 0.0000000 | 0.1488 | 0 | 30 | 921 | 3.257329 | 0.3600 | 0 | 0 | 2087 | 0.000000 | 0.3814 | 0 | 1.74980 | 0.2670 | 0 | 3.7666 | 0.9666 | 4 | 0.4524 | 0.4464 | 0 | 1.9115 | 0.2071 | 1 | 7.88030 | 0.4785 | 5 | 2555 | 1030 | 954 | 565 | 2555 | 22.11350 | 0.5385 | 0 | 135 | 1154 | 11.698440 | 0.9175 | 1 | 144 | 691 | 20.83936 | 0.4865 | 0 | 168 | 262 | 64.12214 | 0.8894 | 1 | 312 | 953 | 32.73872 | 0.6259 | 0 | 192 | 1782 | 10.774411 | 0.5377 | 0 | 198 | 2519 | 7.860262 | 0.4016 | 0 | 519 | 20.31311 | 0.6851 | 0 | 664 | 25.98826 | 0.7939 | 1 | 341 | 1854.295 | 18.38974 | 0.6427 | 0 | 195 | 614.6519 | 31.72527 | 0.8870 | 1 | 75 | 2351 | 3.1901319 | 0.72360 | 0 | 1215 | 2555.353 | 47.54725 | 0.6272 | 0 | 1030 | 61 | 5.9223301 | 0.5514 | 0 | 170 | 16.504854 | 0.7844 | 1 | 58 | 954 | 6.0796646 | 0.8947 | 1 | 83 | 953.5886 | 8.703963 | 0.7220 | 0 | 0 | 2555 | 0.000000 | 0.2111 | 0 | 3.0212 | 0.6565 | 1 | 3.73230 | 0.9680 | 2 | 0.6272 | 0.6195 | 0 | 3.1636 | 0.7893 | 2 | 10.54430 | 0.8433 | 5 |
# Find tracts with divisional data in both 2010 and 2020
svi_national <- merge_svi_data(svi_2010_national, svi_2020_national)
svi_national %>% head() %>% kbl() %>% kable_styling() %>% scroll_box(width = "100%")
| GEOID_2010_trt | FIPS_st | FIPS_county | FIPS_tract | state | state_name | county | region_number | region | division_number | division | E_TOTPOP_10 | E_HU_10 | E_HH_10 | E_POV150_10 | ET_POVSTATUS_10 | EP_POV150_10 | EPL_POV150_10 | F_POV150_10 | E_UNEMP_10 | ET_EMPSTATUS_10 | EP_UNEMP_10 | EPL_UNEMP_10 | F_UNEMP_10 | E_HBURD_OWN_10 | ET_HOUSINGCOST_OWN_10 | EP_HBURD_OWN_10 | EPL_HBURD_OWN_10 | F_HBURD_OWN_10 | E_HBURD_RENT_10 | ET_HOUSINGCOST_RENT_10 | EP_HBURD_RENT_10 | EPL_HBURD_RENT_10 | F_HBURD_RENT_10 | E_HBURD_10 | ET_HOUSINGCOST_10 | EP_HBURD_10 | EPL_HBURD_10 | F_HBURD_10 | E_NOHSDP_10 | ET_EDSTATUS_10 | EP_NOHSDP_10 | EPL_NOHSDP_10 | F_NOHSDP_10 | E_UNINSUR_12 | ET_INSURSTATUS_12 | EP_UNINSUR_12 | EPL_UNINSUR_12 | F_UNINSUR_12 | E_AGE65_10 | EP_AGE65_10 | EPL_AGE65_10 | F_AGE65_10 | E_AGE17_10 | EP_AGE17_10 | EPL_AGE17_10 | F_AGE17_10 | E_DISABL_12 | ET_DISABLSTATUS_12 | EP_DISABL_12 | EPL_DISABL_12 | F_DISABL_12 | E_SNGPNT_10 | ET_FAMILIES_10 | EP_SNGPNT_10 | EPL_SNGPNT_10 | F_SNGPNT_10 | E_LIMENG_10 | ET_POPAGE5UP_10 | EP_LIMENG_10 | EPL_LIMENG_10 | F_LIMENG_10 | E_MINRTY_10 | ET_POPETHRACE_10 | EP_MINRTY_10 | EPL_MINRTY_10 | F_MINRTY_10 | E_STRHU_10 | E_MUNIT_10 | EP_MUNIT_10 | EPL_MUNIT_10 | F_MUNIT_10 | E_MOBILE_10 | EP_MOBILE_10 | EPL_MOBILE_10 | F_MOBILE_10 | E_CROWD_10 | ET_OCCUPANTS_10 | EP_CROWD_10 | EPL_CROWD_10 | F_CROWD_10 | E_NOVEH_10 | ET_KNOWNVEH_10 | EP_NOVEH_10 | EPL_NOVEH_10 | F_NOVEH_10 | E_GROUPQ_10 | ET_HHTYPE_10 | EP_GROUPQ_10 | EPL_GROUPQ_10 | F_GROUPQ_10 | SPL_THEME1_10 | RPL_THEME1_10 | F_THEME1_10 | SPL_THEME2_10 | RPL_THEME2_10 | F_THEME2_10 | SPL_THEME3_10 | RPL_THEME3_10 | F_THEME3_10 | SPL_THEME4_10 | RPL_THEME4_10 | F_THEME4_10 | SPL_THEMES_10 | RPL_THEMES_10 | F_TOTAL_10 | E_TOTPOP_20 | E_HU_20 | E_HH_20 | E_POV150_20 | ET_POVSTATUS_20 | EP_POV150_20 | EPL_POV150_20 | F_POV150_20 | E_UNEMP_20 | ET_EMPSTATUS_20 | EP_UNEMP_20 | EPL_UNEMP_20 | F_UNEMP_20 | E_HBURD_OWN_20 | ET_HOUSINGCOST_OWN_20 | EP_HBURD_OWN_20 | EPL_HBURD_OWN_20 | F_HBURD_OWN_20 | E_HBURD_RENT_20 | ET_HOUSINGCOST_RENT_20 | EP_HBURD_RENT_20 | EPL_HBURD_RENT_20 | F_HBURD_RENT_20 | E_HBURD_20 | ET_HOUSINGCOST_20 | EP_HBURD_20 | EPL_HBURD_20 | F_HBURD_20 | E_NOHSDP_20 | ET_EDSTATUS_20 | EP_NOHSDP_20 | EPL_NOHSDP_20 | F_NOHSDP_20 | E_UNINSUR_20 | ET_INSURSTATUS_20 | EP_UNINSUR_20 | EPL_UNINSUR_20 | F_UNINSUR_20 | E_AGE65_20 | EP_AGE65_20 | EPL_AGE65_20 | F_AGE65_20 | E_AGE17_20 | EP_AGE17_20 | EPL_AGE17_20 | F_AGE17_20 | E_DISABL_20 | ET_DISABLSTATUS_20 | EP_DISABL_20 | EPL_DISABL_20 | F_DISABL_20 | E_SNGPNT_20 | ET_FAMILIES_20 | EP_SNGPNT_20 | EPL_SNGPNT_20 | F_SNGPNT_20 | E_LIMENG_20 | ET_POPAGE5UP_20 | EP_LIMENG_20 | EPL_LIMENG_20 | F_LIMENG_20 | E_MINRTY_20 | ET_POPETHRACE_20 | EP_MINRTY_20 | EPL_MINRTY_20 | F_MINRTY_20 | E_STRHU_20 | E_MUNIT_20 | EP_MUNIT_20 | EPL_MUNIT_20 | F_MUNIT_20 | E_MOBILE_20 | EP_MOBILE_20 | EPL_MOBILE_20 | F_MOBILE_20 | E_CROWD_20 | ET_OCCUPANTS_20 | EP_CROWD_20 | EPL_CROWD_20 | F_CROWD_20 | E_NOVEH_20 | ET_KNOWNVEH_20 | EP_NOVEH_20 | EPL_NOVEH_20 | F_NOVEH_20 | E_GROUPQ_20 | ET_HHTYPE_20 | EP_GROUPQ_20 | EPL_GROUPQ_20 | F_GROUPQ_20 | SPL_THEME1_20 | RPL_THEME1_20 | F_THEME1_20 | SPL_THEME2_20 | RPL_THEME2_20 | F_THEME2_20 | SPL_THEME3_20 | RPL_THEME3_20 | F_THEME3_20 | SPL_THEME4_20 | RPL_THEME4_20 | F_THEME4_20 | SPL_THEMES_20 | RPL_THEMES_20 | F_TOTAL_20 |
|---|---|---|---|---|---|---|---|---|---|---|---|---|---|---|---|---|---|---|---|---|---|---|---|---|---|---|---|---|---|---|---|---|---|---|---|---|---|---|---|---|---|---|---|---|---|---|---|---|---|---|---|---|---|---|---|---|---|---|---|---|---|---|---|---|---|---|---|---|---|---|---|---|---|---|---|---|---|---|---|---|---|---|---|---|---|---|---|---|---|---|---|---|---|---|---|---|---|---|---|---|---|---|---|---|---|---|---|---|---|---|---|---|---|---|---|---|---|---|---|---|---|---|---|---|---|---|---|---|---|---|---|---|---|---|---|---|---|---|---|---|---|---|---|---|---|---|---|---|---|---|---|---|---|---|---|---|---|---|---|---|---|---|---|---|---|---|---|---|---|---|---|---|---|---|---|---|---|---|---|---|---|---|---|---|---|---|---|---|---|---|---|---|---|---|---|---|---|---|---|---|---|---|---|---|---|---|---|---|---|---|---|---|---|---|---|---|---|---|---|---|
| 01001020100 | 01 | 001 | 020100 | AL | Alabama | Autauga County | 3 | South Region | 6 | East South Central Division | 1809 | 771 | 696 | 297 | 1809 | 16.41791 | 0.3871 | 0 | 36 | 889 | 4.049494 | 0.1790 | 0 | 127 | 598 | 21.23746 | 0.20770 | 0 | 47 | 98 | 47.95918 | 0.5767 | 0 | 174 | 696 | 25.00000 | 0.18790 | 0 | 196 | 1242 | 15.780998 | 0.6093 | 0 | 186 | 1759 | 10.574190 | 0.3790 | 0 | 222 | 12.271973 | 0.4876 | 0 | 445 | 24.59923 | 0.5473 | 0 | 298 | 1335 | 22.32210 | 0.8454 | 1 | 27 | 545 | 4.954128 | 0.09275 | 0 | 36 | 1705 | 2.1114370 | 0.59040 | 0 | 385 | 1809 | 21.282477 | 0.4524 | 0 | 771 | 0 | 0.0000000 | 0.1224 | 0 | 92 | 11.9325551 | 0.8005 | 1 | 0 | 696 | 0.0000000 | 0.1238 | 0 | 50 | 696 | 7.183908 | 0.6134 | 0 | 0 | 1809 | 0 | 0.364 | 0 | 1.74230 | 0.28200 | 0 | 2.56345 | 0.5296 | 1 | 0.4524 | 0.4482 | 0 | 2.0241 | 0.2519 | 1 | 6.78225 | 0.3278 | 2 | 1941 | 710 | 693 | 352 | 1941 | 18.13498 | 0.4630 | 0 | 18 | 852 | 2.112676 | 0.15070 | 0 | 81 | 507 | 15.976331 | 0.26320 | 0 | 63 | 186 | 33.87097 | 0.2913 | 0 | 144 | 693 | 20.77922 | 0.2230 | 0 | 187 | 1309 | 14.285714 | 0.6928 | 0 | 187 | 1941 | 9.634209 | 0.6617 | 0 | 295 | 15.19835 | 0.4601 | 0 | 415 | 21.38073 | 0.4681 | 0 | 391 | 1526 | 25.62254 | 0.9011 | 1 | 58 | 555 | 10.45045 | 0.3451 | 0 | 0 | 1843 | 0.0000000 | 0.09479 | 0 | 437 | 1941 | 22.51417 | 0.3902 | 0 | 710 | 0 | 0.0000000 | 0.1079 | 0 | 88 | 12.3943662 | 0.8263 | 1 | 0 | 693 | 0.0000000 | 0.09796 | 0 | 10 | 693 | 1.443001 | 0.1643 | 0 | 0 | 1941 | 0.000000 | 0.1831 | 0 | 2.19120 | 0.4084 | 0 | 2.26919 | 0.3503 | 1 | 0.3902 | 0.3869 | 0 | 1.37956 | 0.07216 | 1 | 6.23015 | 0.2314 | 2 |
| 01001020200 | 01 | 001 | 020200 | AL | Alabama | Autauga County | 3 | South Region | 6 | East South Central Division | 2020 | 816 | 730 | 495 | 1992 | 24.84940 | 0.5954 | 0 | 68 | 834 | 8.153477 | 0.5754 | 0 | 49 | 439 | 11.16173 | 0.02067 | 0 | 105 | 291 | 36.08247 | 0.3019 | 0 | 154 | 730 | 21.09589 | 0.09312 | 0 | 339 | 1265 | 26.798419 | 0.8392 | 1 | 313 | 2012 | 15.556660 | 0.6000 | 0 | 204 | 10.099010 | 0.3419 | 0 | 597 | 29.55446 | 0.8192 | 1 | 359 | 1515 | 23.69637 | 0.8791 | 1 | 132 | 456 | 28.947368 | 0.83510 | 1 | 15 | 1890 | 0.7936508 | 0.40130 | 0 | 1243 | 2020 | 61.534653 | 0.7781 | 1 | 816 | 0 | 0.0000000 | 0.1224 | 0 | 34 | 4.1666667 | 0.6664 | 0 | 13 | 730 | 1.7808219 | 0.5406 | 0 | 115 | 730 | 15.753425 | 0.8382 | 1 | 0 | 2020 | 0 | 0.364 | 0 | 2.70312 | 0.56650 | 1 | 3.27660 | 0.8614 | 3 | 0.7781 | 0.7709 | 1 | 2.5316 | 0.5047 | 1 | 9.28942 | 0.6832 | 6 | 1757 | 720 | 573 | 384 | 1511 | 25.41363 | 0.6427 | 0 | 29 | 717 | 4.044630 | 0.41320 | 0 | 33 | 392 | 8.418367 | 0.03542 | 0 | 116 | 181 | 64.08840 | 0.9086 | 1 | 149 | 573 | 26.00349 | 0.4041 | 0 | 139 | 1313 | 10.586443 | 0.5601 | 0 | 91 | 1533 | 5.936073 | 0.4343 | 0 | 284 | 16.16392 | 0.5169 | 0 | 325 | 18.49744 | 0.2851 | 0 | 164 | 1208 | 13.57616 | 0.4127 | 0 | 42 | 359 | 11.69916 | 0.3998 | 0 | 0 | 1651 | 0.0000000 | 0.09479 | 0 | 1116 | 1757 | 63.51736 | 0.7591 | 1 | 720 | 3 | 0.4166667 | 0.2470 | 0 | 5 | 0.6944444 | 0.5106 | 0 | 9 | 573 | 1.5706806 | 0.46880 | 0 | 57 | 573 | 9.947644 | 0.7317 | 0 | 212 | 1757 | 12.066022 | 0.9549 | 1 | 2.45440 | 0.4888 | 0 | 1.70929 | 0.1025 | 0 | 0.7591 | 0.7527 | 1 | 2.91300 | 0.68620 | 1 | 7.83579 | 0.4802 | 2 |
| 01001020300 | 01 | 001 | 020300 | AL | Alabama | Autauga County | 3 | South Region | 6 | East South Central Division | 3543 | 1403 | 1287 | 656 | 3533 | 18.56779 | 0.4443 | 0 | 93 | 1552 | 5.992268 | 0.3724 | 0 | 273 | 957 | 28.52665 | 0.45780 | 0 | 178 | 330 | 53.93939 | 0.7152 | 0 | 451 | 1287 | 35.04274 | 0.49930 | 0 | 346 | 2260 | 15.309734 | 0.5950 | 0 | 252 | 3102 | 8.123791 | 0.2596 | 0 | 487 | 13.745413 | 0.5868 | 0 | 998 | 28.16822 | 0.7606 | 1 | 371 | 2224 | 16.68165 | 0.6266 | 0 | 126 | 913 | 13.800657 | 0.46350 | 0 | 0 | 3365 | 0.0000000 | 0.09298 | 0 | 637 | 3543 | 17.979114 | 0.4049 | 0 | 1403 | 10 | 0.7127584 | 0.3015 | 0 | 2 | 0.1425517 | 0.4407 | 0 | 0 | 1287 | 0.0000000 | 0.1238 | 0 | 101 | 1287 | 7.847708 | 0.6443 | 0 | 0 | 3543 | 0 | 0.364 | 0 | 2.17060 | 0.41010 | 0 | 2.53048 | 0.5116 | 1 | 0.4049 | 0.4011 | 0 | 1.8743 | 0.1942 | 0 | 6.98028 | 0.3576 | 1 | 3694 | 1464 | 1351 | 842 | 3694 | 22.79372 | 0.5833 | 0 | 53 | 1994 | 2.657974 | 0.22050 | 0 | 117 | 967 | 12.099276 | 0.11370 | 0 | 147 | 384 | 38.28125 | 0.3856 | 0 | 264 | 1351 | 19.54108 | 0.1827 | 0 | 317 | 2477 | 12.797739 | 0.6460 | 0 | 127 | 3673 | 3.457664 | 0.2308 | 0 | 464 | 12.56091 | 0.3088 | 0 | 929 | 25.14889 | 0.7080 | 0 | 473 | 2744 | 17.23761 | 0.6211 | 0 | 263 | 975 | 26.97436 | 0.8234 | 1 | 128 | 3586 | 3.5694367 | 0.70770 | 0 | 1331 | 3694 | 36.03140 | 0.5515 | 0 | 1464 | 26 | 1.7759563 | 0.3675 | 0 | 14 | 0.9562842 | 0.5389 | 0 | 35 | 1351 | 2.5906736 | 0.60550 | 0 | 42 | 1351 | 3.108808 | 0.3415 | 0 | 0 | 3694 | 0.000000 | 0.1831 | 0 | 1.86330 | 0.3063 | 0 | 3.16900 | 0.8380 | 1 | 0.5515 | 0.5468 | 0 | 2.03650 | 0.26830 | 0 | 7.62030 | 0.4460 | 1 |
| 01001020400 | 01 | 001 | 020400 | AL | Alabama | Autauga County | 3 | South Region | 6 | East South Central Division | 4840 | 1957 | 1839 | 501 | 4840 | 10.35124 | 0.2177 | 0 | 101 | 2129 | 4.744011 | 0.2447 | 0 | 310 | 1549 | 20.01291 | 0.17080 | 0 | 89 | 290 | 30.68966 | 0.2044 | 0 | 399 | 1839 | 21.69657 | 0.10540 | 0 | 274 | 3280 | 8.353658 | 0.3205 | 0 | 399 | 4293 | 9.294200 | 0.3171 | 0 | 955 | 19.731405 | 0.8643 | 1 | 1195 | 24.69008 | 0.5530 | 0 | 625 | 3328 | 18.78005 | 0.7233 | 0 | 152 | 1374 | 11.062591 | 0.34710 | 0 | 10 | 4537 | 0.2204100 | 0.22560 | 0 | 297 | 4840 | 6.136364 | 0.1647 | 0 | 1957 | 33 | 1.6862545 | 0.3843 | 0 | 25 | 1.2774655 | 0.5516 | 0 | 14 | 1839 | 0.7612833 | 0.3564 | 0 | 19 | 1839 | 1.033170 | 0.1127 | 0 | 0 | 4840 | 0 | 0.364 | 0 | 1.20540 | 0.13470 | 0 | 2.71330 | 0.6129 | 1 | 0.1647 | 0.1632 | 0 | 1.7690 | 0.1591 | 0 | 5.85240 | 0.1954 | 1 | 3539 | 1741 | 1636 | 503 | 3539 | 14.21305 | 0.3472 | 0 | 39 | 1658 | 2.352232 | 0.17990 | 0 | 219 | 1290 | 16.976744 | 0.30880 | 0 | 74 | 346 | 21.38728 | 0.1037 | 0 | 293 | 1636 | 17.90954 | 0.1333 | 0 | 173 | 2775 | 6.234234 | 0.3351 | 0 | 169 | 3529 | 4.788892 | 0.3448 | 0 | 969 | 27.38062 | 0.9225 | 1 | 510 | 14.41085 | 0.1208 | 0 | 670 | 3019 | 22.19278 | 0.8194 | 1 | 148 | 1137 | 13.01671 | 0.4541 | 0 | 89 | 3409 | 2.6107363 | 0.64690 | 0 | 454 | 3539 | 12.82848 | 0.2364 | 0 | 1741 | 143 | 8.2136703 | 0.6028 | 0 | 0 | 0.0000000 | 0.2186 | 0 | 10 | 1636 | 0.6112469 | 0.28340 | 0 | 72 | 1636 | 4.400978 | 0.4538 | 0 | 0 | 3539 | 0.000000 | 0.1831 | 0 | 1.34030 | 0.1575 | 0 | 2.96370 | 0.7496 | 2 | 0.2364 | 0.2344 | 0 | 1.74170 | 0.16270 | 0 | 6.28210 | 0.2389 | 2 |
| 01001020500 | 01 | 001 | 020500 | AL | Alabama | Autauga County | 3 | South Region | 6 | East South Central Division | 9938 | 3969 | 3741 | 1096 | 9938 | 11.02838 | 0.2364 | 0 | 188 | 4937 | 3.807981 | 0.1577 | 0 | 426 | 2406 | 17.70574 | 0.11050 | 0 | 528 | 1335 | 39.55056 | 0.3753 | 0 | 954 | 3741 | 25.50120 | 0.20140 | 0 | 293 | 5983 | 4.897209 | 0.1655 | 0 | 740 | 10110 | 7.319486 | 0.2211 | 0 | 837 | 8.422218 | 0.2408 | 0 | 3012 | 30.30791 | 0.8455 | 1 | 759 | 7155 | 10.60797 | 0.2668 | 0 | 476 | 2529 | 18.821669 | 0.63540 | 0 | 78 | 9297 | 0.8389803 | 0.41110 | 0 | 1970 | 9938 | 19.822902 | 0.4330 | 0 | 3969 | 306 | 7.7097506 | 0.6153 | 0 | 0 | 0.0000000 | 0.2198 | 0 | 7 | 3741 | 0.1871157 | 0.2535 | 0 | 223 | 3741 | 5.960973 | 0.5483 | 0 | 0 | 9938 | 0 | 0.364 | 0 | 0.98210 | 0.08468 | 0 | 2.39960 | 0.4381 | 1 | 0.4330 | 0.4290 | 0 | 2.0009 | 0.2430 | 0 | 5.81560 | 0.1905 | 1 | 10674 | 4504 | 4424 | 1626 | 10509 | 15.47245 | 0.3851 | 0 | 81 | 5048 | 1.604596 | 0.09431 | 0 | 321 | 2299 | 13.962592 | 0.17970 | 0 | 711 | 2125 | 33.45882 | 0.2836 | 0 | 1032 | 4424 | 23.32731 | 0.3109 | 0 | 531 | 6816 | 7.790493 | 0.4251 | 0 | 301 | 10046 | 2.996217 | 0.1894 | 0 | 1613 | 15.11149 | 0.4553 | 0 | 2765 | 25.90407 | 0.7494 | 0 | 1124 | 7281 | 15.43744 | 0.5253 | 0 | 342 | 2912 | 11.74451 | 0.4019 | 0 | 52 | 9920 | 0.5241935 | 0.35230 | 0 | 2603 | 10674 | 24.38636 | 0.4160 | 0 | 4504 | 703 | 15.6083481 | 0.7378 | 0 | 29 | 0.6438721 | 0.5037 | 0 | 37 | 4424 | 0.8363472 | 0.33420 | 0 | 207 | 4424 | 4.679023 | 0.4754 | 0 | 176 | 10674 | 1.648866 | 0.7598 | 1 | 1.40481 | 0.1743 | 0 | 2.48420 | 0.4802 | 0 | 0.4160 | 0.4125 | 0 | 2.81090 | 0.63730 | 1 | 7.11591 | 0.3654 | 1 |
| 01001020600 | 01 | 001 | 020600 | AL | Alabama | Autauga County | 3 | South Region | 6 | East South Central Division | 3402 | 1456 | 1308 | 735 | 3402 | 21.60494 | 0.5199 | 0 | 134 | 1720 | 7.790698 | 0.5436 | 0 | 242 | 1032 | 23.44961 | 0.28010 | 0 | 62 | 276 | 22.46377 | 0.1035 | 0 | 304 | 1308 | 23.24159 | 0.14070 | 0 | 301 | 2151 | 13.993491 | 0.5510 | 0 | 355 | 3445 | 10.304790 | 0.3656 | 0 | 386 | 11.346267 | 0.4232 | 0 | 931 | 27.36626 | 0.7200 | 0 | 440 | 2439 | 18.04018 | 0.6912 | 0 | 143 | 924 | 15.476190 | 0.52900 | 0 | 4 | 3254 | 0.1229256 | 0.19840 | 0 | 723 | 3402 | 21.252205 | 0.4519 | 0 | 1456 | 18 | 1.2362637 | 0.3507 | 0 | 433 | 29.7390110 | 0.9468 | 1 | 16 | 1308 | 1.2232416 | 0.4493 | 0 | 28 | 1308 | 2.140673 | 0.2298 | 0 | 0 | 3402 | 0 | 0.364 | 0 | 2.12080 | 0.39510 | 0 | 2.56180 | 0.5288 | 0 | 0.4519 | 0.4477 | 0 | 2.3406 | 0.4048 | 1 | 7.47510 | 0.4314 | 1 | 3536 | 1464 | 1330 | 1279 | 3523 | 36.30429 | 0.8215 | 1 | 34 | 1223 | 2.780049 | 0.23780 | 0 | 321 | 1111 | 28.892889 | 0.75870 | 1 | 67 | 219 | 30.59361 | 0.2305 | 0 | 388 | 1330 | 29.17293 | 0.5075 | 0 | 306 | 2380 | 12.857143 | 0.6480 | 0 | 415 | 3496 | 11.870709 | 0.7535 | 1 | 547 | 15.46946 | 0.4760 | 0 | 982 | 27.77149 | 0.8327 | 1 | 729 | 2514 | 28.99761 | 0.9488 | 1 | 95 | 880 | 10.79545 | 0.3601 | 0 | 0 | 3394 | 0.0000000 | 0.09479 | 0 | 985 | 3536 | 27.85633 | 0.4608 | 0 | 1464 | 0 | 0.0000000 | 0.1079 | 0 | 364 | 24.8633880 | 0.9300 | 1 | 0 | 1330 | 0.0000000 | 0.09796 | 0 | 17 | 1330 | 1.278196 | 0.1463 | 0 | 0 | 3536 | 0.000000 | 0.1831 | 0 | 2.96830 | 0.6434 | 2 | 2.71239 | 0.6156 | 2 | 0.4608 | 0.4569 | 0 | 1.46526 | 0.08976 | 1 | 7.60675 | 0.4440 | 5 |
NMTC Data Wrangling
orig_nmtc_df <- orig_nmtc %>%
  rename("GEOID10" = "2010 Census Tract Number FIPS code. GEOID",
         "nmtc_eligibility_orig" = "Does Census Tract Qualify For NMTC Low-Income Community (LIC) on Poverty or Income Criteria?")

orig_nmtc_df %>% head() %>% kbl() %>% kable_styling() %>% scroll_box(width = "100%")
| GEOID10 | OMB Metro/Non-metro Designation, July 2015 (OMB 15-01) | nmtc_eligibility_orig | Census Tract Poverty Rate % (2011-2015 ACS) | Does Census Tract Qualify on Poverty Criteria\>=20%? | Census Tract Percent of Benchmarked Median Family Income (%) 2011-2015 ACS | Does Census Tract Qualify on Median Family Income Criteria\<=80%? | Census Tract Unemployment Rate (%) 2011-2015 | County Code | State Abbreviation | State Name | County Name | Census Tract Unemployment to National Unemployment Ratio | Is Tract Unemployment to National Unemployment Ratio \>1.5? | Population for whom poverty status is determined 2011-2015 ACS |
|---|---|---|---|---|---|---|---|---|---|---|---|---|---|---|
| 01001020100 | Metropolitan | No | 8.1 | No | 122.930646878856 | No | 5.4 | 01001 | AL | Alabama | Autauga | 0.6506024096385542 | No | 1948 |
| 01001020200 | Metropolitan | Yes | 25.5 | Yes | 82.402258244451573 | No | 13.3 | 01001 | AL | Alabama | Autauga | 1.6024096385542168 | Yes | 1983 |
| 01001020300 | Metropolitan | No | 12.7 | No | 94.261422220719723 | No | 6.2 | 01001 | AL | Alabama | Autauga | 0.74698795180722888 | No | 2968 |
| 01001020400 | Metropolitan | No | 2.1 | No | 116.82358310373388 | No | 10.8 | 01001 | AL | Alabama | Autauga | 1.3012048192771084 | No | 4423 |
| 01001020500 | Metropolitan | No | 11.4 | No | 127.74293876033198 | No | 4.2 | 01001 | AL | Alabama | Autauga | 0.50602409638554213 | No | 10563 |
| 01001020600 | Metropolitan | No | 14.4 | No | 111.98255607579317 | No | 10.9 | 01001 | AL | Alabama | Autauga | 1.3132530120481927 | No | 3851 |
high_migration_nmtc_df <- high_migration_nmtc %>% rename("GEOID10" = "2010 Census Tract Number FIPS code GEOID")

high_migration_nmtc_df %>% head() %>% kbl() %>% kable_styling() %>% scroll_box(width = "100%")
| GEOID10 | 20-year County population loss 1990-2010 census | % Median Family Income (MFI) / Area Income 2011-2015 (between 80%-85% MFI) |
|---|---|---|
| 01087231601 | -0.1394416 | 82.06754 |
| 05039970300 | -0.1558144 | 84.78236 |
| 08017960600 | -0.2340426 | 84.36239 |
| 17067953800 | -0.1061620 | 80.36788 |
| 17067954200 | -0.1061620 | 84.48551 |
| 17067954300 | -0.1061620 | 84.44497 |
# Add column to label tracts as high migration
high_migration_nmtc_df <- high_migration_nmtc_df %>% mutate(high_migration = "Yes")

# Join to original column
orig_nmtc_df <- left_join(orig_nmtc_df, high_migration_nmtc_df, join_by(GEOID10 == GEOID10))

# Update eligibility column with coalesce()
nmtc_df <- orig_nmtc_df %>%
  mutate(nmtc_eligibility = coalesce(high_migration, nmtc_eligibility_orig))

nmtc_df %>% filter(GEOID10 == "01087231601") %>% kbl() %>% kable_styling() %>% scroll_box(width = "100%")
| GEOID10 | OMB Metro/Non-metro Designation, July 2015 (OMB 15-01) | nmtc_eligibility_orig | Census Tract Poverty Rate % (2011-2015 ACS) | Does Census Tract Qualify on Poverty Criteria\>=20%? | Census Tract Percent of Benchmarked Median Family Income (%) 2011-2015 ACS | Does Census Tract Qualify on Median Family Income Criteria\<=80%? | Census Tract Unemployment Rate (%) 2011-2015 | County Code | State Abbreviation | State Name | County Name | Census Tract Unemployment to National Unemployment Ratio | Is Tract Unemployment to National Unemployment Ratio \>1.5? | Population for whom poverty status is determined 2011-2015 ACS | 20-year County population loss 1990-2010 census | % Median Family Income (MFI) / Area Income 2011-2015 (between 80%-85% MFI) | high_migration | nmtc_eligibility |
|---|---|---|---|---|---|---|---|---|---|---|---|---|---|---|---|---|---|---|
| 01087231601 | Non-Metropolitan | No | 16.2 | No | 82.067544858242542 | No | 11.3 | 01087 | AL | Alabama | Macon | 1.3614457831325302 | No | 888 | -0.1394416 | 82.06754 | Yes | Yes |
nmtc_eligible <- nmtc_df %>%
  select(GEOID10, nmtc_eligibility, `County Code`, `County Name`, `State Abbreviation`, `State Name`) %>%
  filter(tolower(nmtc_eligibility) == "yes")

nmtc_eligible %>% head() %>% kbl() %>% kable_styling() %>% scroll_box(width = "100%")
| GEOID10 | nmtc_eligibility | County Code | County Name | State Abbreviation | State Name |
|---|---|---|---|---|---|
| 01001020200 | Yes | 01001 | Autauga | AL | Alabama |
| 01001020700 | Yes | 01001 | Autauga | AL | Alabama |
| 01001021100 | Yes | 01001 | Autauga | AL | Alabama |
| 01003010200 | Yes | 01003 | Baldwin | AL | Alabama |
| 01003010500 | Yes | 01003 | Baldwin | AL | Alabama |
| 01003010600 | Yes | 01003 | Baldwin | AL | Alabama |
# Save just tract ID and eligibility
nmtc_eligible_df <- nmtc_eligible %>% select(GEOID10, nmtc_eligibility)
nmtc_eligible_df %>% head()
## # A tibble: 6 × 2
##   GEOID10     nmtc_eligibility
##   <chr>       <chr>
## 1 01001020200 Yes
## 2 01001020700 Yes
## 3 01001021100 Yes
## 4 01003010200 Yes
## 5 01003010500 Yes
## 6 01003010600 Yes
nmtc_awards <- nmtc_awards_data %>%
  mutate(`2010 Census Tract` = str_pad(`2010 Census Tract`, 11, "left", pad=0)) %>%
  rename("GEOID10" =`2010 Census Tract`)

nmtc_awards %>% head() %>% kbl() %>% kable_styling() %>% scroll_box(width = "100%")
| Project ID | GEOID10 | Metro/Non-Metro, 2010 Census | Origination Year | Community Development Entity (CDE) Name | Project QLICI Amount | Estimated Total Project Cost | City | State | Zip Code | QALICB Type | Multi-CDE | Multi-Tract Project |
|---|---|---|---|---|---|---|---|---|---|---|---|---|
| AK0001 | 02070000100 | Non-Metropolitan | 2008 | Alaska Growth Capital BIDCO, Inc. | 300000 | 300000 | Aleknagik | Alaska | 99555 | NRE | NO | NO |
| AK0002 | 02020001000 | Metropolitan | 2006 | Alaska Growth Capital BIDCO, Inc. | 1008750 | 1345000 | Anchorage | Alaska | 99501 | NRE | NO | NO |
| AK0003 | 02020000600 | Metropolitan | 2006 | HEDC New Markets, Inc | 5061506 | 8694457 | Anchorage | Alaska | 99508 | NRE | NO | NO |
| AK0004 | 02020001000 | Metropolitan | 2006 | Alaska Growth Capital BIDCO, Inc. | 187500 | 250000 | Anchorage | Alaska | 99501 | NRE | NO | NO |
| AK0006 | 02020001802 | Metropolitan | 2006 | Alaska Growth Capital BIDCO, Inc. | 750000 | 1180000 | Anchorage | Alaska | 99507 | NRE | NO | NO |
| AK0007 | 02020001900 | Metropolitan | 2006 | Alaska Growth Capital BIDCO, Inc. | 127500 | 150000 | Anchorage | Alaska | 99503 | NRE | NO | NO |
# Create character zip_code column:
nmtc_awards <- nmtc_awards %>%
  mutate(zip_code = str_pad(`Zip Code`, 5, "left", pad=0))

nmtc_awards %>% head() %>% kbl() %>% kable_styling() %>% scroll_box(width = "100%")
| Project ID | GEOID10 | Metro/Non-Metro, 2010 Census | Origination Year | Community Development Entity (CDE) Name | Project QLICI Amount | Estimated Total Project Cost | City | State | Zip Code | QALICB Type | Multi-CDE | Multi-Tract Project | zip_code |
|---|---|---|---|---|---|---|---|---|---|---|---|---|---|
| AK0001 | 02070000100 | Non-Metropolitan | 2008 | Alaska Growth Capital BIDCO, Inc. | 300000 | 300000 | Aleknagik | Alaska | 99555 | NRE | NO | NO | 99555 |
| AK0002 | 02020001000 | Metropolitan | 2006 | Alaska Growth Capital BIDCO, Inc. | 1008750 | 1345000 | Anchorage | Alaska | 99501 | NRE | NO | NO | 99501 |
| AK0003 | 02020000600 | Metropolitan | 2006 | HEDC New Markets, Inc | 5061506 | 8694457 | Anchorage | Alaska | 99508 | NRE | NO | NO | 99508 |
| AK0004 | 02020001000 | Metropolitan | 2006 | Alaska Growth Capital BIDCO, Inc. | 187500 | 250000 | Anchorage | Alaska | 99501 | NRE | NO | NO | 99501 |
| AK0006 | 02020001802 | Metropolitan | 2006 | Alaska Growth Capital BIDCO, Inc. | 750000 | 1180000 | Anchorage | Alaska | 99507 | NRE | NO | NO | 99507 |
| AK0007 | 02020001900 | Metropolitan | 2006 | Alaska Growth Capital BIDCO, Inc. | 127500 | 150000 | Anchorage | Alaska | 99503 | NRE | NO | NO | 99503 |
# View tracts
nmtc_awards_pre2010 <- nmtc_awards %>%
  filter(`Origination Year` <= 2010) %>%
  count(GEOID10) %>%
  rename("pre10_nmtc_project_cnt" = "n")

nmtc_awards_dollars_pre2010 <- nmtc_awards %>%
  filter(`Origination Year` <= 2010) %>%
  group_by(GEOID10) %>%
  summarise(pre10_nmtc_dollars = sum(`Project QLICI Amount`, na.rm = TRUE))

nmtc_awards_pre2010 <- left_join(nmtc_awards_pre2010,
                                 nmtc_awards_dollars_pre2010,
                                 join_by(GEOID10 == GEOID10))

nmtc_awards_pre2010$pre10_nmtc_dollars_formatted <- scales::dollar_format()(nmtc_awards_pre2010$pre10_nmtc_dollars)

nmtc_awards_pre2010 %>% head() %>% kbl() %>% kable_styling() %>% scroll_box(width = "100%")
| GEOID10 | pre10_nmtc_project_cnt | pre10_nmtc_dollars | pre10_nmtc_dollars_formatted |
|---|---|---|---|
| 01059973500 | 1 | 5000000 | \$5,000,000 |
| 01069041400 | 1 | 2500000 | \$2,500,000 |
| 01073001902 | 1 | 14400000 | \$14,400,000 |
| 01073002700 | 1 | 1000000 | \$1,000,000 |
| 01073004200 | 1 | 5908129 | \$5,908,129 |
| 01073004500 | 3 | 37950000 | \$37,950,000 |
nmtc_awards_post2010 <- nmtc_awards %>%
  filter(`Origination Year` > 2010 & `Origination Year` <= 2020) %>%
  count(GEOID10) %>%
  rename("post10_nmtc_project_cnt" = "n")

nmtc_awards_dollars_post2010 <- nmtc_awards %>%
  filter(`Origination Year` > 2010 & `Origination Year` <= 2020) %>%
  group_by(GEOID10) %>%
  summarise(post10_nmtc_dollars = sum(`Project QLICI Amount`, na.rm = TRUE))

nmtc_awards_post2010 <- left_join(nmtc_awards_post2010,
                                  nmtc_awards_dollars_post2010,
                                  join_by(GEOID10 == GEOID10))

nmtc_awards_post2010$post10_nmtc_dollars_formatted <- scales::dollar_format()(nmtc_awards_post2010$post10_nmtc_dollars)

nmtc_awards_post2010 %>% head() %>% kbl() %>% kable_styling() %>% scroll_box(width = "100%")
| GEOID10 | post10_nmtc_project_cnt | post10_nmtc_dollars | post10_nmtc_dollars_formatted |
|---|---|---|---|
| 0. | 3 | 24200000 | \$24,200,000 |
| 01003010200 | 1 | 408000 | \$408,000 |
| 01003010300 | 1 | 9880000 | \$9,880,000 |
| 01003010600 | 1 | 8000000 | \$8,000,000 |
| 01003010904 | 1 | 22460000 | \$22,460,000 |
| 01003011501 | 6 | 37147460 | \$37,147,460 |
Join Divisional & National 2010 Eligible Data
# Divisional data
svi_divisional_nmtc_eligible <- left_join(svi_divisional, nmtc_eligible_df, join_by("GEOID_2010_trt" == "GEOID10")) %>% filter(tolower(nmtc_eligibility) == "yes")

svi_divisional_nmtc_eligible %>% head() %>% kbl() %>% kable_styling() %>% scroll_box(width = "100%")
| GEOID_2010_trt | FIPS_st | FIPS_county | FIPS_tract | state | state_name | county | region_number | region | division_number | division | E_TOTPOP_10 | E_HU_10 | E_HH_10 | E_POV150_10 | ET_POVSTATUS_10 | EP_POV150_10 | EPL_POV150_10 | F_POV150_10 | E_UNEMP_10 | ET_EMPSTATUS_10 | EP_UNEMP_10 | EPL_UNEMP_10 | F_UNEMP_10 | E_HBURD_OWN_10 | ET_HOUSINGCOST_OWN_10 | EP_HBURD_OWN_10 | EPL_HBURD_OWN_10 | F_HBURD_OWN_10 | E_HBURD_RENT_10 | ET_HOUSINGCOST_RENT_10 | EP_HBURD_RENT_10 | EPL_HBURD_RENT_10 | F_HBURD_RENT_10 | E_HBURD_10 | ET_HOUSINGCOST_10 | EP_HBURD_10 | EPL_HBURD_10 | F_HBURD_10 | E_NOHSDP_10 | ET_EDSTATUS_10 | EP_NOHSDP_10 | EPL_NOHSDP_10 | F_NOHSDP_10 | E_UNINSUR_12 | ET_INSURSTATUS_12 | EP_UNINSUR_12 | EPL_UNINSUR_12 | F_UNINSUR_12 | E_AGE65_10 | EP_AGE65_10 | EPL_AGE65_10 | F_AGE65_10 | E_AGE17_10 | EP_AGE17_10 | EPL_AGE17_10 | F_AGE17_10 | E_DISABL_12 | ET_DISABLSTATUS_12 | EP_DISABL_12 | EPL_DISABL_12 | F_DISABL_12 | E_SNGPNT_10 | ET_FAMILIES_10 | EP_SNGPNT_10 | EPL_SNGPNT_10 | F_SNGPNT_10 | E_LIMENG_10 | ET_POPAGE5UP_10 | EP_LIMENG_10 | EPL_LIMENG_10 | F_LIMENG_10 | E_MINRTY_10 | ET_POPETHRACE_10 | EP_MINRTY_10 | EPL_MINRTY_10 | F_MINRTY_10 | E_STRHU_10 | E_MUNIT_10 | EP_MUNIT_10 | EPL_MUNIT_10 | F_MUNIT_10 | E_MOBILE_10 | EP_MOBILE_10 | EPL_MOBILE_10 | F_MOBILE_10 | E_CROWD_10 | ET_OCCUPANTS_10 | EP_CROWD_10 | EPL_CROWD_10 | F_CROWD_10 | E_NOVEH_10 | ET_KNOWNVEH_10 | EP_NOVEH_10 | EPL_NOVEH_10 | F_NOVEH_10 | E_GROUPQ_10 | ET_HHTYPE_10 | EP_GROUPQ_10 | EPL_GROUPQ_10 | F_GROUPQ_10 | SPL_THEME1_10 | RPL_THEME1_10 | F_THEME1_10 | SPL_THEME2_10 | RPL_THEME2_10 | F_THEME2_10 | SPL_THEME3_10 | RPL_THEME3_10 | F_THEME3_10 | SPL_THEME4_10 | RPL_THEME4_10 | F_THEME4_10 | SPL_THEMES_10 | RPL_THEMES_10 | F_TOTAL_10 | E_TOTPOP_20 | E_HU_20 | E_HH_20 | E_POV150_20 | ET_POVSTATUS_20 | EP_POV150_20 | EPL_POV150_20 | F_POV150_20 | E_UNEMP_20 | ET_EMPSTATUS_20 | EP_UNEMP_20 | EPL_UNEMP_20 | F_UNEMP_20 | E_HBURD_OWN_20 | ET_HOUSINGCOST_OWN_20 | EP_HBURD_OWN_20 | EPL_HBURD_OWN_20 | F_HBURD_OWN_20 | E_HBURD_RENT_20 | ET_HOUSINGCOST_RENT_20 | EP_HBURD_RENT_20 | EPL_HBURD_RENT_20 | F_HBURD_RENT_20 | E_HBURD_20 | ET_HOUSINGCOST_20 | EP_HBURD_20 | EPL_HBURD_20 | F_HBURD_20 | E_NOHSDP_20 | ET_EDSTATUS_20 | EP_NOHSDP_20 | EPL_NOHSDP_20 | F_NOHSDP_20 | E_UNINSUR_20 | ET_INSURSTATUS_20 | EP_UNINSUR_20 | EPL_UNINSUR_20 | F_UNINSUR_20 | E_AGE65_20 | EP_AGE65_20 | EPL_AGE65_20 | F_AGE65_20 | E_AGE17_20 | EP_AGE17_20 | EPL_AGE17_20 | F_AGE17_20 | E_DISABL_20 | ET_DISABLSTATUS_20 | EP_DISABL_20 | EPL_DISABL_20 | F_DISABL_20 | E_SNGPNT_20 | ET_FAMILIES_20 | EP_SNGPNT_20 | EPL_SNGPNT_20 | F_SNGPNT_20 | E_LIMENG_20 | ET_POPAGE5UP_20 | EP_LIMENG_20 | EPL_LIMENG_20 | F_LIMENG_20 | E_MINRTY_20 | ET_POPETHRACE_20 | EP_MINRTY_20 | EPL_MINRTY_20 | F_MINRTY_20 | E_STRHU_20 | E_MUNIT_20 | EP_MUNIT_20 | EPL_MUNIT_20 | F_MUNIT_20 | E_MOBILE_20 | EP_MOBILE_20 | EPL_MOBILE_20 | F_MOBILE_20 | E_CROWD_20 | ET_OCCUPANTS_20 | EP_CROWD_20 | EPL_CROWD_20 | F_CROWD_20 | E_NOVEH_20 | ET_KNOWNVEH_20 | EP_NOVEH_20 | EPL_NOVEH_20 | F_NOVEH_20 | E_GROUPQ_20 | ET_HHTYPE_20 | EP_GROUPQ_20 | EPL_GROUPQ_20 | F_GROUPQ_20 | SPL_THEME1_20 | RPL_THEME1_20 | F_THEME1_20 | SPL_THEME2_20 | RPL_THEME2_20 | F_THEME2_20 | SPL_THEME3_20 | RPL_THEME3_20 | F_THEME3_20 | SPL_THEME4_20 | RPL_THEME4_20 | F_THEME4_20 | SPL_THEMES_20 | RPL_THEMES_20 | F_TOTAL_20 | nmtc_eligibility |
|---|---|---|---|---|---|---|---|---|---|---|---|---|---|---|---|---|---|---|---|---|---|---|---|---|---|---|---|---|---|---|---|---|---|---|---|---|---|---|---|---|---|---|---|---|---|---|---|---|---|---|---|---|---|---|---|---|---|---|---|---|---|---|---|---|---|---|---|---|---|---|---|---|---|---|---|---|---|---|---|---|---|---|---|---|---|---|---|---|---|---|---|---|---|---|---|---|---|---|---|---|---|---|---|---|---|---|---|---|---|---|---|---|---|---|---|---|---|---|---|---|---|---|---|---|---|---|---|---|---|---|---|---|---|---|---|---|---|---|---|---|---|---|---|---|---|---|---|---|---|---|---|---|---|---|---|---|---|---|---|---|---|---|---|---|---|---|---|---|---|---|---|---|---|---|---|---|---|---|---|---|---|---|---|---|---|---|---|---|---|---|---|---|---|---|---|---|---|---|---|---|---|---|---|---|---|---|---|---|---|---|---|---|---|---|---|---|---|---|---|---|---|
| 10001040201 | 10 | 001 | 040201 | DE | Delaware | Kent County | 3 | South Region | 5 | South Atlantic Division | 5208 | 1953 | 1809 | 850 | 5183 | 16.399769 | 0.3672 | 0 | 147 | 2550 | 5.764706 | 0.3364 | 0 | 385 | 1323 | 29.10053 | 0.45810 | 0 | 222 | 486 | 45.67901 | 0.49650 | 0 | 607 | 1809 | 33.55445 | 0.4431 | 0 | 459 | 3090 | 14.8543689 | 0.5386 | 0 | 435 | 5283 | 8.233958 | 0.19610 | 0 | 454 | 8.717358 | 0.256100 | 0 | 1588 | 30.491551 | 0.8927 | 1 | 537 | 3716 | 14.451023 | 0.4708 | 0 | 417 | 1343 | 31.04989 | 0.8599 | 1 | 69 | 4835 | 1.427094 | 0.5240 | 0 | 1881 | 5208 | 36.11751 | 0.5689 | 0 | 1953 | 87 | 4.454685 | 0.5392 | 0 | 148 | 7.578085 | 0.6495 | 0 | 39 | 1809 | 2.155887 | 0.6471 | 0 | 121 | 1809 | 6.688778 | 0.6124 | 0 | 0 | 5208 | 0.0000000 | 0.3814 | 0 | 1.88140 | 0.3053 | 0 | 3.003500 | 0.7667 | 2 | 0.5689 | 0.5614 | 0 | 2.8296 | 0.6516 | 0 | 8.283400 | 0.5452 | 2 | 4770 | 1906 | 1732 | 755 | 4692 | 16.09122 | 0.3758 | 0 | 92 | 2500 | 3.680000 | 0.3633 | 0 | 197 | 1184 | 16.638513 | 0.280400 | 0 | 235 | 548 | 42.88321 | 0.4609 | 0 | 432 | 1732 | 24.94226 | 0.3622 | 0 | 251 | 3100 | 8.096774 | 0.4085 | 0 | 228 | 4770 | 4.779874 | 0.21160 | 0 | 549 | 11.509434 | 0.23290 | 0 | 1352 | 28.343816 | 0.88650 | 1 | 490 | 3418.125 | 14.335346 | 0.4309 | 0 | 328 | 1263.2064 | 25.965669 | 0.8111 | 1 | 0 | 4526 | 0.0000000 | 0.09987 | 0 | 1875 | 4769.908 | 39.30893 | 0.5372 | 0 | 1906 | 72 | 3.7775446 | 0.4876 | 0 | 128 | 6.7156348 | 0.6610 | 0 | 10 | 1732 | 0.5773672 | 0.3165 | 0 | 32 | 1731.7111 | 1.847883 | 0.2303 | 0 | 0 | 4770 | 0.0000000 | 0.2111 | 0 | 1.72140 | 0.2531 | 0 | 2.46127 | 0.45940 | 2 | 0.5372 | 0.5306 | 0 | 1.9065 | 0.2183 | 0 | 6.62637 | 0.2829 | 2 | Yes |
| 10001040502 | 10 | 001 | 040502 | DE | Delaware | Kent County | 3 | South Region | 5 | South Atlantic Division | 2087 | 921 | 921 | 192 | 2087 | 9.199808 | 0.1738 | 0 | 35 | 722 | 4.847645 | 0.2495 | 0 | 281 | 700 | 40.14286 | 0.78190 | 1 | 64 | 221 | 28.95928 | 0.17110 | 0 | 345 | 921 | 37.45928 | 0.5710 | 0 | 284 | 1546 | 18.3699871 | 0.6484 | 0 | 119 | 2121 | 5.610561 | 0.10710 | 0 | 518 | 24.820316 | 0.906800 | 1 | 480 | 22.999521 | 0.4910 | 0 | 328 | 1527 | 21.480026 | 0.7959 | 1 | 173 | 680 | 25.44118 | 0.7769 | 1 | 100 | 1998 | 5.005005 | 0.7960 | 1 | 560 | 2087 | 26.83277 | 0.4524 | 0 | 921 | 0 | 0.000000 | 0.1428 | 0 | 273 | 29.641694 | 0.8785 | 1 | 0 | 921 | 0.000000 | 0.1488 | 0 | 30 | 921 | 3.257329 | 0.3600 | 0 | 0 | 2087 | 0.0000000 | 0.3814 | 0 | 1.74980 | 0.2670 | 0 | 3.766600 | 0.9666 | 4 | 0.4524 | 0.4464 | 0 | 1.9115 | 0.2071 | 1 | 7.880300 | 0.4785 | 5 | 2555 | 1030 | 954 | 565 | 2555 | 22.11350 | 0.5385 | 0 | 135 | 1154 | 11.698440 | 0.9175 | 1 | 144 | 691 | 20.839363 | 0.486500 | 0 | 168 | 262 | 64.12214 | 0.8894 | 1 | 312 | 953 | 32.73872 | 0.6259 | 0 | 192 | 1782 | 10.774411 | 0.5377 | 0 | 198 | 2519 | 7.860262 | 0.40160 | 0 | 519 | 20.313112 | 0.68510 | 0 | 664 | 25.988258 | 0.79390 | 1 | 341 | 1854.295 | 18.389741 | 0.6427 | 0 | 195 | 614.6519 | 31.725274 | 0.8870 | 1 | 75 | 2351 | 3.1901319 | 0.72360 | 0 | 1215 | 2555.353 | 47.54725 | 0.6272 | 0 | 1030 | 61 | 5.9223301 | 0.5514 | 0 | 170 | 16.5048544 | 0.7844 | 1 | 58 | 954 | 6.0796646 | 0.8947 | 1 | 83 | 953.5886 | 8.703963 | 0.7220 | 0 | 0 | 2555 | 0.0000000 | 0.2111 | 0 | 3.02120 | 0.6565 | 1 | 3.73230 | 0.96800 | 2 | 0.6272 | 0.6195 | 0 | 3.1636 | 0.7893 | 2 | 10.54430 | 0.8433 | 5 | Yes |
| 10001040900 | 10 | 001 | 040900 | DE | Delaware | Kent County | 3 | South Region | 5 | South Atlantic Division | 2363 | 1205 | 1007 | 526 | 1741 | 30.212522 | 0.7006 | 0 | 171 | 1089 | 15.702479 | 0.9032 | 1 | 98 | 362 | 27.07182 | 0.37770 | 0 | 258 | 645 | 40.00000 | 0.36590 | 0 | 356 | 1007 | 35.35253 | 0.5041 | 0 | 248 | 1416 | 17.5141243 | 0.6235 | 0 | 118 | 2479 | 4.759984 | 0.08169 | 0 | 509 | 21.540415 | 0.863300 | 1 | 168 | 7.109606 | 0.0386 | 0 | 428 | 1427 | 29.992992 | 0.9611 | 1 | 44 | 387 | 11.36951 | 0.3400 | 0 | 50 | 2349 | 2.128565 | 0.6157 | 0 | 727 | 2363 | 30.76598 | 0.5048 | 0 | 1205 | 378 | 31.369295 | 0.8688 | 1 | 0 | 0.000000 | 0.1809 | 0 | 0 | 1007 | 0.000000 | 0.1488 | 0 | 256 | 1007 | 25.422046 | 0.9457 | 1 | 622 | 2363 | 26.3224714 | 0.9741 | 1 | 2.81309 | 0.5851 | 1 | 2.818700 | 0.6717 | 2 | 0.5048 | 0.4981 | 0 | 3.1183 | 0.7840 | 3 | 9.254890 | 0.6833 | 6 | 2373 | 1114 | 1028 | 574 | 1679 | 34.18702 | 0.7904 | 1 | 19 | 1034 | 1.837524 | 0.1211 | 0 | 26 | 313 | 8.306709 | 0.029920 | 0 | 335 | 715 | 46.85315 | 0.5540 | 0 | 361 | 1028 | 35.11673 | 0.6908 | 0 | 224 | 1292 | 17.337461 | 0.7807 | 1 | 78 | 2250 | 3.466667 | 0.13250 | 0 | 501 | 21.112516 | 0.71690 | 0 | 208 | 8.765276 | 0.05851 | 0 | 391 | 1505.000 | 25.980066 | 0.9018 | 1 | 29 | 220.0000 | 13.181818 | 0.4476 | 0 | 7 | 2268 | 0.3086420 | 0.28740 | 0 | 974 | 2373.000 | 41.04509 | 0.5571 | 0 | 1114 | 476 | 42.7289048 | 0.9104 | 1 | 0 | 0.0000000 | 0.1800 | 0 | 5 | 1028 | 0.4863813 | 0.2927 | 0 | 248 | 1028.0000 | 24.124514 | 0.9466 | 1 | 678 | 2373 | 28.5714286 | 0.9778 | 1 | 2.51550 | 0.4976 | 2 | 2.41221 | 0.42860 | 1 | 0.5571 | 0.5503 | 0 | 3.3075 | 0.8411 | 3 | 8.79231 | 0.6264 | 6 | Yes |
| 10001041000 | 10 | 001 | 041000 | DE | Delaware | Kent County | 3 | South Region | 5 | South Atlantic Division | 5577 | 2570 | 2369 | 1291 | 5577 | 23.148646 | 0.5435 | 0 | 144 | 2702 | 5.329386 | 0.2938 | 0 | 468 | 1312 | 35.67073 | 0.67500 | 0 | 135 | 1057 | 12.77200 | 0.04274 | 0 | 603 | 2369 | 25.45378 | 0.1769 | 0 | 759 | 3504 | 21.6609589 | 0.7311 | 0 | 655 | 5999 | 10.918486 | 0.29800 | 0 | 594 | 10.650888 | 0.371200 | 0 | 1487 | 26.663080 | 0.7247 | 0 | 683 | 4587 | 14.889906 | 0.4947 | 0 | 364 | 1466 | 24.82947 | 0.7646 | 1 | 188 | 5105 | 3.682664 | 0.7342 | 0 | 3384 | 5577 | 60.67778 | 0.7785 | 1 | 2570 | 479 | 18.638132 | 0.7741 | 1 | 567 | 22.062257 | 0.8159 | 1 | 91 | 2369 | 3.841283 | 0.8132 | 1 | 221 | 2369 | 9.328831 | 0.7266 | 0 | 9 | 5577 | 0.1613771 | 0.7632 | 1 | 2.04330 | 0.3511 | 0 | 3.089400 | 0.8041 | 1 | 0.7785 | 0.7682 | 1 | 3.8930 | 0.9705 | 4 | 9.804200 | 0.7522 | 6 | 6719 | 3107 | 2804 | 2006 | 6656 | 30.13822 | 0.7207 | 0 | 436 | 3058 | 14.257685 | 0.9556 | 1 | 299 | 1387 | 21.557318 | 0.521400 | 0 | 583 | 1417 | 41.14326 | 0.4216 | 0 | 882 | 2804 | 31.45506 | 0.5861 | 0 | 953 | 4915 | 19.389624 | 0.8333 | 1 | 509 | 6603 | 7.708617 | 0.39290 | 0 | 1221 | 18.172347 | 0.58640 | 0 | 1389 | 20.672719 | 0.47220 | 0 | 1393 | 5214.000 | 26.716532 | 0.9150 | 1 | 661 | 1752.0000 | 37.728310 | 0.9336 | 1 | 340 | 6411 | 5.3033848 | 0.82180 | 1 | 4068 | 6719.048 | 60.54429 | 0.7409 | 0 | 3107 | 469 | 15.0949469 | 0.7136 | 0 | 586 | 18.8606373 | 0.8099 | 1 | 54 | 2804 | 1.9258203 | 0.5840 | 0 | 253 | 2804.0000 | 9.022825 | 0.7342 | 0 | 70 | 6719 | 1.0418217 | 0.7345 | 0 | 3.48860 | 0.7870 | 2 | 3.72900 | 0.96760 | 3 | 0.7409 | 0.7319 | 0 | 3.5762 | 0.9178 | 1 | 11.53470 | 0.9313 | 6 | Yes |
| 10001041100 | 10 | 001 | 041100 | DE | Delaware | Kent County | 3 | South Region | 5 | South Atlantic Division | 2957 | 800 | 738 | 499 | 2555 | 19.530333 | 0.4511 | 0 | 44 | 845 | 5.207101 | 0.2813 | 0 | 0 | 8 | 0.00000 | 0.00257 | 0 | 395 | 730 | 54.10959 | 0.69280 | 0 | 395 | 738 | 53.52304 | 0.9155 | 1 | 11 | 1118 | 0.9838998 | 0.0213 | 0 | 65 | 2559 | 2.540055 | 0.02694 | 0 | 0 | 0.000000 | 0.003549 | 0 | 1198 | 40.514035 | 0.9944 | 1 | 117 | 1192 | 9.815436 | 0.2221 | 0 | 133 | 693 | 19.19192 | 0.6322 | 0 | 42 | 2551 | 1.646413 | 0.5567 | 0 | 720 | 2957 | 24.34900 | 0.4177 | 0 | 800 | 0 | 0.000000 | 0.1428 | 0 | 0 | 0.000000 | 0.1809 | 0 | 0 | 738 | 0.000000 | 0.1488 | 0 | 10 | 738 | 1.355014 | 0.1640 | 0 | 402 | 2957 | 13.5948597 | 0.9492 | 1 | 1.69614 | 0.2527 | 1 | 2.408949 | 0.4377 | 1 | 0.4177 | 0.4122 | 0 | 1.5857 | 0.1097 | 1 | 6.108489 | 0.2207 | 3 | 3881 | 1350 | 1322 | 1031 | 3618 | 28.49641 | 0.6874 | 0 | 58 | 877 | 6.613455 | 0.6891 | 0 | 0 | 3 | 0.000000 | 0.002567 | 0 | 758 | 1319 | 57.46778 | 0.7890 | 1 | 758 | 1322 | 57.33737 | 0.9772 | 1 | 41 | 1801 | 2.276513 | 0.0857 | 0 | 33 | 2762 | 1.194786 | 0.02847 | 0 | 64 | 1.649059 | 0.01027 | 0 | 1291 | 33.264623 | 0.97230 | 1 | 129 | 1470.497 | 8.772546 | 0.1457 | 0 | 113 | 1156.7160 | 9.769036 | 0.3067 | 0 | 4 | 3373 | 0.1185888 | 0.22310 | 0 | 1672 | 3881.437 | 43.07683 | 0.5797 | 0 | 1350 | 9 | 0.6666667 | 0.3180 | 0 | 10 | 0.7407407 | 0.4343 | 0 | 1 | 1322 | 0.0756430 | 0.2359 | 0 | 18 | 1321.8616 | 1.361716 | 0.1744 | 0 | 263 | 3881 | 6.7766040 | 0.9251 | 1 | 2.46787 | 0.4818 | 1 | 1.65807 | 0.08121 | 1 | 0.5797 | 0.5726 | 0 | 2.0877 | 0.2866 | 1 | 6.79334 | 0.3059 | 3 | Yes |
| 10001041200 | 10 | 001 | 041200 | DE | Delaware | Kent County | 3 | South Region | 5 | South Atlantic Division | 4723 | 1880 | 1742 | 778 | 4710 | 16.518047 | 0.3700 | 0 | 193 | 2264 | 8.524735 | 0.5848 | 0 | 481 | 1168 | 41.18151 | 0.80360 | 1 | 257 | 574 | 44.77352 | 0.47360 | 0 | 738 | 1742 | 42.36510 | 0.7087 | 0 | 573 | 3071 | 18.6584175 | 0.6563 | 0 | 471 | 3937 | 11.963424 | 0.34310 | 0 | 600 | 12.703790 | 0.504200 | 0 | 1257 | 26.614440 | 0.7223 | 0 | 583 | 3036 | 19.202899 | 0.7085 | 0 | 240 | 1183 | 20.28740 | 0.6645 | 0 | 190 | 4378 | 4.339881 | 0.7670 | 1 | 2933 | 4723 | 62.10036 | 0.7871 | 1 | 1880 | 327 | 17.393617 | 0.7606 | 1 | 353 | 18.776596 | 0.7841 | 1 | 41 | 1742 | 2.353616 | 0.6746 | 0 | 92 | 1742 | 5.281286 | 0.5288 | 0 | 0 | 4723 | 0.0000000 | 0.3814 | 0 | 2.66290 | 0.5376 | 0 | 3.366500 | 0.8969 | 1 | 0.7871 | 0.7767 | 1 | 3.1295 | 0.7889 | 2 | 9.946000 | 0.7681 | 4 | 4135 | 1851 | 1712 | 870 | 4076 | 21.34446 | 0.5206 | 0 | 180 | 1879 | 9.579564 | 0.8567 | 1 | 384 | 1230 | 31.219512 | 0.844800 | 1 | 226 | 482 | 46.88797 | 0.5550 | 0 | 610 | 1712 | 35.63084 | 0.7027 | 0 | 286 | 2785 | 10.269300 | 0.5146 | 0 | 204 | 4124 | 4.946654 | 0.22200 | 0 | 755 | 18.258767 | 0.59080 | 0 | 1067 | 25.804111 | 0.78410 | 1 | 571 | 3057.653 | 18.674456 | 0.6593 | 0 | 375 | 1138.2043 | 32.946633 | 0.8989 | 1 | 26 | 3953 | 0.6577283 | 0.38940 | 0 | 2299 | 4134.641 | 55.60337 | 0.6982 | 0 | 1851 | 175 | 9.4543490 | 0.6291 | 0 | 438 | 23.6628849 | 0.8514 | 1 | 5 | 1712 | 0.2920561 | 0.2552 | 0 | 143 | 1712.2269 | 8.351697 | 0.7088 | 0 | 20 | 4135 | 0.4836759 | 0.6479 | 0 | 2.81660 | 0.5950 | 1 | 3.32250 | 0.89620 | 2 | 0.6982 | 0.6897 | 0 | 3.0924 | 0.7625 | 1 | 9.92970 | 0.7729 | 4 | Yes |
# National data
svi_national_nmtc_eligible <- left_join(svi_national, nmtc_eligible_df, join_by("GEOID_2010_trt" == "GEOID10")) %>% filter(tolower(nmtc_eligibility) == "yes")

svi_national_nmtc_eligible %>% head() %>% kbl() %>% kable_styling() %>% scroll_box(width = "100%")
| GEOID_2010_trt | FIPS_st | FIPS_county | FIPS_tract | state | state_name | county | region_number | region | division_number | division | E_TOTPOP_10 | E_HU_10 | E_HH_10 | E_POV150_10 | ET_POVSTATUS_10 | EP_POV150_10 | EPL_POV150_10 | F_POV150_10 | E_UNEMP_10 | ET_EMPSTATUS_10 | EP_UNEMP_10 | EPL_UNEMP_10 | F_UNEMP_10 | E_HBURD_OWN_10 | ET_HOUSINGCOST_OWN_10 | EP_HBURD_OWN_10 | EPL_HBURD_OWN_10 | F_HBURD_OWN_10 | E_HBURD_RENT_10 | ET_HOUSINGCOST_RENT_10 | EP_HBURD_RENT_10 | EPL_HBURD_RENT_10 | F_HBURD_RENT_10 | E_HBURD_10 | ET_HOUSINGCOST_10 | EP_HBURD_10 | EPL_HBURD_10 | F_HBURD_10 | E_NOHSDP_10 | ET_EDSTATUS_10 | EP_NOHSDP_10 | EPL_NOHSDP_10 | F_NOHSDP_10 | E_UNINSUR_12 | ET_INSURSTATUS_12 | EP_UNINSUR_12 | EPL_UNINSUR_12 | F_UNINSUR_12 | E_AGE65_10 | EP_AGE65_10 | EPL_AGE65_10 | F_AGE65_10 | E_AGE17_10 | EP_AGE17_10 | EPL_AGE17_10 | F_AGE17_10 | E_DISABL_12 | ET_DISABLSTATUS_12 | EP_DISABL_12 | EPL_DISABL_12 | F_DISABL_12 | E_SNGPNT_10 | ET_FAMILIES_10 | EP_SNGPNT_10 | EPL_SNGPNT_10 | F_SNGPNT_10 | E_LIMENG_10 | ET_POPAGE5UP_10 | EP_LIMENG_10 | EPL_LIMENG_10 | F_LIMENG_10 | E_MINRTY_10 | ET_POPETHRACE_10 | EP_MINRTY_10 | EPL_MINRTY_10 | F_MINRTY_10 | E_STRHU_10 | E_MUNIT_10 | EP_MUNIT_10 | EPL_MUNIT_10 | F_MUNIT_10 | E_MOBILE_10 | EP_MOBILE_10 | EPL_MOBILE_10 | F_MOBILE_10 | E_CROWD_10 | ET_OCCUPANTS_10 | EP_CROWD_10 | EPL_CROWD_10 | F_CROWD_10 | E_NOVEH_10 | ET_KNOWNVEH_10 | EP_NOVEH_10 | EPL_NOVEH_10 | F_NOVEH_10 | E_GROUPQ_10 | ET_HHTYPE_10 | EP_GROUPQ_10 | EPL_GROUPQ_10 | F_GROUPQ_10 | SPL_THEME1_10 | RPL_THEME1_10 | F_THEME1_10 | SPL_THEME2_10 | RPL_THEME2_10 | F_THEME2_10 | SPL_THEME3_10 | RPL_THEME3_10 | F_THEME3_10 | SPL_THEME4_10 | RPL_THEME4_10 | F_THEME4_10 | SPL_THEMES_10 | RPL_THEMES_10 | F_TOTAL_10 | E_TOTPOP_20 | E_HU_20 | E_HH_20 | E_POV150_20 | ET_POVSTATUS_20 | EP_POV150_20 | EPL_POV150_20 | F_POV150_20 | E_UNEMP_20 | ET_EMPSTATUS_20 | EP_UNEMP_20 | EPL_UNEMP_20 | F_UNEMP_20 | E_HBURD_OWN_20 | ET_HOUSINGCOST_OWN_20 | EP_HBURD_OWN_20 | EPL_HBURD_OWN_20 | F_HBURD_OWN_20 | E_HBURD_RENT_20 | ET_HOUSINGCOST_RENT_20 | EP_HBURD_RENT_20 | EPL_HBURD_RENT_20 | F_HBURD_RENT_20 | E_HBURD_20 | ET_HOUSINGCOST_20 | EP_HBURD_20 | EPL_HBURD_20 | F_HBURD_20 | E_NOHSDP_20 | ET_EDSTATUS_20 | EP_NOHSDP_20 | EPL_NOHSDP_20 | F_NOHSDP_20 | E_UNINSUR_20 | ET_INSURSTATUS_20 | EP_UNINSUR_20 | EPL_UNINSUR_20 | F_UNINSUR_20 | E_AGE65_20 | EP_AGE65_20 | EPL_AGE65_20 | F_AGE65_20 | E_AGE17_20 | EP_AGE17_20 | EPL_AGE17_20 | F_AGE17_20 | E_DISABL_20 | ET_DISABLSTATUS_20 | EP_DISABL_20 | EPL_DISABL_20 | F_DISABL_20 | E_SNGPNT_20 | ET_FAMILIES_20 | EP_SNGPNT_20 | EPL_SNGPNT_20 | F_SNGPNT_20 | E_LIMENG_20 | ET_POPAGE5UP_20 | EP_LIMENG_20 | EPL_LIMENG_20 | F_LIMENG_20 | E_MINRTY_20 | ET_POPETHRACE_20 | EP_MINRTY_20 | EPL_MINRTY_20 | F_MINRTY_20 | E_STRHU_20 | E_MUNIT_20 | EP_MUNIT_20 | EPL_MUNIT_20 | F_MUNIT_20 | E_MOBILE_20 | EP_MOBILE_20 | EPL_MOBILE_20 | F_MOBILE_20 | E_CROWD_20 | ET_OCCUPANTS_20 | EP_CROWD_20 | EPL_CROWD_20 | F_CROWD_20 | E_NOVEH_20 | ET_KNOWNVEH_20 | EP_NOVEH_20 | EPL_NOVEH_20 | F_NOVEH_20 | E_GROUPQ_20 | ET_HHTYPE_20 | EP_GROUPQ_20 | EPL_GROUPQ_20 | F_GROUPQ_20 | SPL_THEME1_20 | RPL_THEME1_20 | F_THEME1_20 | SPL_THEME2_20 | RPL_THEME2_20 | F_THEME2_20 | SPL_THEME3_20 | RPL_THEME3_20 | F_THEME3_20 | SPL_THEME4_20 | RPL_THEME4_20 | F_THEME4_20 | SPL_THEMES_20 | RPL_THEMES_20 | F_TOTAL_20 | nmtc_eligibility |
|---|---|---|---|---|---|---|---|---|---|---|---|---|---|---|---|---|---|---|---|---|---|---|---|---|---|---|---|---|---|---|---|---|---|---|---|---|---|---|---|---|---|---|---|---|---|---|---|---|---|---|---|---|---|---|---|---|---|---|---|---|---|---|---|---|---|---|---|---|---|---|---|---|---|---|---|---|---|---|---|---|---|---|---|---|---|---|---|---|---|---|---|---|---|---|---|---|---|---|---|---|---|---|---|---|---|---|---|---|---|---|---|---|---|---|---|---|---|---|---|---|---|---|---|---|---|---|---|---|---|---|---|---|---|---|---|---|---|---|---|---|---|---|---|---|---|---|---|---|---|---|---|---|---|---|---|---|---|---|---|---|---|---|---|---|---|---|---|---|---|---|---|---|---|---|---|---|---|---|---|---|---|---|---|---|---|---|---|---|---|---|---|---|---|---|---|---|---|---|---|---|---|---|---|---|---|---|---|---|---|---|---|---|---|---|---|---|---|---|---|---|---|
| 01001020200 | 01 | 001 | 020200 | AL | Alabama | Autauga County | 3 | South Region | 6 | East South Central Division | 2020 | 816 | 730 | 495 | 1992 | 24.84940 | 0.5954 | 0 | 68 | 834 | 8.153477 | 0.57540 | 0 | 49 | 439 | 11.16173 | 0.02067 | 0 | 105 | 291 | 36.08247 | 0.30190 | 0 | 154 | 730 | 21.09589 | 0.09312 | 0 | 339 | 1265 | 26.79842 | 0.8392 | 1 | 313 | 2012 | 15.55666 | 0.6000 | 0 | 204 | 10.09901 | 0.3419 | 0 | 597 | 29.55446 | 0.8192 | 1 | 359 | 1515 | 23.69637 | 0.8791 | 1 | 132 | 456 | 28.947368 | 0.8351 | 1 | 15 | 1890 | 0.7936508 | 0.40130 | 0 | 1243 | 2020 | 61.53465 | 0.7781 | 1 | 816 | 0 | 0.0000000 | 0.1224 | 0 | 34 | 4.1666667 | 0.6664 | 0 | 13 | 730 | 1.780822 | 0.5406 | 0 | 115 | 730 | 15.753425 | 0.8382 | 1 | 0 | 2020 | 0.0000 | 0.3640 | 0 | 2.70312 | 0.5665 | 1 | 3.27660 | 0.8614 | 3 | 0.7781 | 0.7709 | 1 | 2.5316 | 0.5047 | 1 | 9.28942 | 0.6832 | 6 | 1757 | 720 | 573 | 384 | 1511 | 25.41363 | 0.6427 | 0 | 29 | 717 | 4.044630 | 0.4132 | 0 | 33 | 392 | 8.418367 | 0.03542 | 0 | 116 | 181 | 64.08840 | 0.9086 | 1 | 149 | 573 | 26.00349 | 0.40410 | 0 | 139 | 1313 | 10.58644 | 0.5601 | 0 | 91 | 1533 | 5.936073 | 0.4343 | 0 | 284 | 16.163916 | 0.5169 | 0 | 325 | 18.49744 | 0.2851 | 0 | 164 | 1208.000 | 13.57616 | 0.4127 | 0 | 42 | 359.0000 | 11.699164 | 0.3998 | 0 | 0 | 1651 | 0.0000000 | 0.09479 | 0 | 1116 | 1757.000 | 63.51736 | 0.7591 | 1 | 720 | 3 | 0.4166667 | 0.2470 | 0 | 5 | 0.6944444 | 0.5106 | 0 | 9 | 573 | 1.5706806 | 0.4688 | 0 | 57 | 573.000 | 9.947644 | 0.7317 | 0 | 212 | 1757 | 12.0660216 | 0.9549 | 1 | 2.45440 | 0.4888 | 0 | 1.70929 | 0.1025 | 0 | 0.7591 | 0.7527 | 1 | 2.9130 | 0.6862 | 1 | 7.83579 | 0.4802 | 2 | Yes |
| 01001020700 | 01 | 001 | 020700 | AL | Alabama | Autauga County | 3 | South Region | 6 | East South Central Division | 2664 | 1254 | 1139 | 710 | 2664 | 26.65165 | 0.6328 | 0 | 29 | 1310 | 2.213741 | 0.05255 | 0 | 134 | 710 | 18.87324 | 0.13890 | 0 | 187 | 429 | 43.58974 | 0.47090 | 0 | 321 | 1139 | 28.18262 | 0.28130 | 0 | 396 | 1852 | 21.38229 | 0.7478 | 0 | 345 | 2878 | 11.98749 | 0.4459 | 0 | 389 | 14.60210 | 0.6417 | 0 | 599 | 22.48499 | 0.4007 | 0 | 510 | 2168 | 23.52399 | 0.8752 | 1 | 228 | 712 | 32.022472 | 0.8712 | 1 | 0 | 2480 | 0.0000000 | 0.09298 | 0 | 694 | 2664 | 26.05105 | 0.5138 | 0 | 1254 | 8 | 0.6379585 | 0.2931 | 0 | 460 | 36.6826156 | 0.9714 | 1 | 0 | 1139 | 0.000000 | 0.1238 | 0 | 125 | 1139 | 10.974539 | 0.7477 | 0 | 0 | 2664 | 0.0000 | 0.3640 | 0 | 2.16035 | 0.4069 | 0 | 2.88178 | 0.6997 | 2 | 0.5138 | 0.5090 | 0 | 2.5000 | 0.4882 | 1 | 8.05593 | 0.5185 | 3 | 3562 | 1313 | 1248 | 1370 | 3528 | 38.83220 | 0.8512 | 1 | 128 | 1562 | 8.194622 | 0.7935 | 1 | 168 | 844 | 19.905213 | 0.44510 | 0 | 237 | 404 | 58.66337 | 0.8359 | 1 | 405 | 1248 | 32.45192 | 0.60420 | 0 | 396 | 2211 | 17.91045 | 0.7857 | 1 | 444 | 3547 | 12.517620 | 0.7758 | 1 | 355 | 9.966311 | 0.1800 | 0 | 954 | 26.78271 | 0.7923 | 1 | 629 | 2593.000 | 24.25762 | 0.8730 | 1 | 171 | 797.0000 | 21.455458 | 0.7186 | 0 | 0 | 3211 | 0.0000000 | 0.09479 | 0 | 1009 | 3562.000 | 28.32678 | 0.4668 | 0 | 1313 | 14 | 1.0662605 | 0.3165 | 0 | 443 | 33.7395278 | 0.9663 | 1 | 73 | 1248 | 5.8493590 | 0.8211 | 1 | 17 | 1248.000 | 1.362180 | 0.1554 | 0 | 112 | 3562 | 3.1443010 | 0.8514 | 1 | 3.81040 | 0.8569 | 4 | 2.65869 | 0.5847 | 2 | 0.4668 | 0.4629 | 0 | 3.1107 | 0.7714 | 3 | 10.04659 | 0.7851 | 9 | Yes |
| 01001021100 | 01 | 001 | 021100 | AL | Alabama | Autauga County | 3 | South Region | 6 | East South Central Division | 3298 | 1502 | 1323 | 860 | 3298 | 26.07641 | 0.6211 | 0 | 297 | 1605 | 18.504673 | 0.94340 | 1 | 250 | 1016 | 24.60630 | 0.32070 | 0 | 74 | 307 | 24.10423 | 0.11920 | 0 | 324 | 1323 | 24.48980 | 0.17380 | 0 | 710 | 2231 | 31.82429 | 0.8976 | 1 | 654 | 3565 | 18.34502 | 0.7018 | 0 | 411 | 12.46210 | 0.5001 | 0 | 738 | 22.37720 | 0.3934 | 0 | 936 | 2861 | 32.71583 | 0.9807 | 1 | 138 | 825 | 16.727273 | 0.5715 | 0 | 9 | 3155 | 0.2852615 | 0.25010 | 0 | 1979 | 3298 | 60.00606 | 0.7703 | 1 | 1502 | 14 | 0.9320905 | 0.3234 | 0 | 659 | 43.8748336 | 0.9849 | 1 | 44 | 1323 | 3.325775 | 0.7062 | 0 | 137 | 1323 | 10.355253 | 0.7313 | 0 | 0 | 3298 | 0.0000 | 0.3640 | 0 | 3.33770 | 0.7351 | 2 | 2.69580 | 0.6028 | 1 | 0.7703 | 0.7631 | 1 | 3.1098 | 0.7827 | 1 | 9.91360 | 0.7557 | 5 | 3499 | 1825 | 1462 | 1760 | 3499 | 50.30009 | 0.9396 | 1 | 42 | 966 | 4.347826 | 0.4539 | 0 | 426 | 1274 | 33.437991 | 0.85200 | 1 | 52 | 188 | 27.65957 | 0.1824 | 0 | 478 | 1462 | 32.69494 | 0.61110 | 0 | 422 | 2488 | 16.96141 | 0.7638 | 1 | 497 | 3499 | 14.204058 | 0.8246 | 1 | 853 | 24.378394 | 0.8688 | 1 | 808 | 23.09231 | 0.5829 | 0 | 908 | 2691.100 | 33.74084 | 0.9808 | 1 | 179 | 811.6985 | 22.052524 | 0.7323 | 0 | 8 | 3248 | 0.2463054 | 0.26220 | 0 | 1986 | 3498.713 | 56.76373 | 0.7175 | 0 | 1825 | 29 | 1.5890411 | 0.3551 | 0 | 576 | 31.5616438 | 0.9594 | 1 | 88 | 1462 | 6.0191518 | 0.8269 | 1 | 148 | 1461.993 | 10.123166 | 0.7364 | 0 | 38 | 3499 | 1.0860246 | 0.7013 | 0 | 3.59300 | 0.8073 | 3 | 3.42700 | 0.9156 | 2 | 0.7175 | 0.7114 | 0 | 3.5791 | 0.9216 | 2 | 11.31660 | 0.9150 | 7 | Yes |
| 01003010200 | 01 | 003 | 010200 | AL | Alabama | Baldwin County | 3 | South Region | 6 | East South Central Division | 2612 | 1220 | 1074 | 338 | 2605 | 12.97505 | 0.2907 | 0 | 44 | 1193 | 3.688181 | 0.14720 | 0 | 172 | 928 | 18.53448 | 0.13090 | 0 | 31 | 146 | 21.23288 | 0.09299 | 0 | 203 | 1074 | 18.90130 | 0.05657 | 0 | 455 | 1872 | 24.30556 | 0.8016 | 1 | 456 | 2730 | 16.70330 | 0.6445 | 0 | 401 | 15.35222 | 0.6847 | 0 | 563 | 21.55436 | 0.3406 | 0 | 410 | 2038 | 20.11776 | 0.7755 | 1 | 64 | 779 | 8.215661 | 0.2181 | 0 | 0 | 2510 | 0.0000000 | 0.09298 | 0 | 329 | 2612 | 12.59571 | 0.3113 | 0 | 1220 | 38 | 3.1147541 | 0.4648 | 0 | 385 | 31.5573770 | 0.9545 | 1 | 20 | 1074 | 1.862197 | 0.5509 | 0 | 43 | 1074 | 4.003724 | 0.4088 | 0 | 0 | 2612 | 0.0000 | 0.3640 | 0 | 1.94057 | 0.3398 | 1 | 2.11188 | 0.2802 | 1 | 0.3113 | 0.3084 | 0 | 2.7430 | 0.6129 | 1 | 7.10675 | 0.3771 | 3 | 2928 | 1312 | 1176 | 884 | 2928 | 30.19126 | 0.7334 | 0 | 29 | 1459 | 1.987663 | 0.1356 | 0 | 71 | 830 | 8.554217 | 0.03726 | 0 | 134 | 346 | 38.72832 | 0.3964 | 0 | 205 | 1176 | 17.43197 | 0.12010 | 0 | 294 | 2052 | 14.32749 | 0.6940 | 0 | 219 | 2925 | 7.487179 | 0.5423 | 0 | 556 | 18.989071 | 0.6705 | 0 | 699 | 23.87295 | 0.6339 | 0 | 489 | 2226.455 | 21.96317 | 0.8122 | 1 | 191 | 783.8820 | 24.365914 | 0.7799 | 1 | 0 | 2710 | 0.0000000 | 0.09479 | 0 | 398 | 2927.519 | 13.59513 | 0.2511 | 0 | 1312 | 13 | 0.9908537 | 0.3111 | 0 | 400 | 30.4878049 | 0.9557 | 1 | 6 | 1176 | 0.5102041 | 0.2590 | 0 | 81 | 1176.202 | 6.886570 | 0.6115 | 0 | 7 | 2928 | 0.2390710 | 0.4961 | 0 | 2.22540 | 0.4183 | 0 | 2.99129 | 0.7634 | 2 | 0.2511 | 0.2490 | 0 | 2.6334 | 0.5496 | 1 | 8.10119 | 0.5207 | 3 | Yes |
| 01003010500 | 01 | 003 | 010500 | AL | Alabama | Baldwin County | 3 | South Region | 6 | East South Central Division | 4230 | 1779 | 1425 | 498 | 3443 | 14.46413 | 0.3337 | 0 | 166 | 1625 | 10.215385 | 0.71790 | 0 | 151 | 1069 | 14.12535 | 0.04638 | 0 | 196 | 356 | 55.05618 | 0.73830 | 0 | 347 | 1425 | 24.35088 | 0.17010 | 0 | 707 | 2945 | 24.00679 | 0.7967 | 1 | 528 | 4001 | 13.19670 | 0.5005 | 0 | 619 | 14.63357 | 0.6436 | 0 | 790 | 18.67612 | 0.1937 | 0 | 536 | 3096 | 17.31266 | 0.6572 | 0 | 165 | 920 | 17.934783 | 0.6102 | 0 | 20 | 4021 | 0.4973887 | 0.32320 | 0 | 754 | 4230 | 17.82506 | 0.4023 | 0 | 1779 | 97 | 5.4525014 | 0.5525 | 0 | 8 | 0.4496908 | 0.4600 | 0 | 63 | 1425 | 4.421053 | 0.7762 | 1 | 90 | 1425 | 6.315790 | 0.5691 | 0 | 787 | 4230 | 18.6052 | 0.9649 | 1 | 2.51890 | 0.5121 | 1 | 2.42790 | 0.4539 | 0 | 0.4023 | 0.3986 | 0 | 3.3227 | 0.8628 | 2 | 8.67180 | 0.6054 | 3 | 5877 | 1975 | 1836 | 820 | 5244 | 15.63692 | 0.3902 | 0 | 90 | 2583 | 3.484321 | 0.3361 | 0 | 159 | 1345 | 11.821561 | 0.10530 | 0 | 139 | 491 | 28.30957 | 0.1924 | 0 | 298 | 1836 | 16.23094 | 0.09053 | 0 | 570 | 4248 | 13.41808 | 0.6669 | 0 | 353 | 5247 | 6.727654 | 0.4924 | 0 | 1109 | 18.870172 | 0.6645 | 0 | 1144 | 19.46571 | 0.3411 | 0 | 717 | 4102.545 | 17.47696 | 0.6332 | 0 | 103 | 1286.1180 | 8.008596 | 0.2341 | 0 | 0 | 5639 | 0.0000000 | 0.09479 | 0 | 868 | 5877.481 | 14.76823 | 0.2709 | 0 | 1975 | 26 | 1.3164557 | 0.3359 | 0 | 45 | 2.2784810 | 0.6271 | 0 | 9 | 1836 | 0.4901961 | 0.2540 | 0 | 116 | 1835.798 | 6.318779 | 0.5811 | 0 | 633 | 5877 | 10.7708014 | 0.9507 | 1 | 1.97613 | 0.3410 | 0 | 1.96769 | 0.1961 | 0 | 0.2709 | 0.2686 | 0 | 2.7488 | 0.6077 | 1 | 6.96352 | 0.3406 | 1 | Yes |
| 01003010600 | 01 | 003 | 010600 | AL | Alabama | Baldwin County | 3 | South Region | 6 | East South Central Division | 3724 | 1440 | 1147 | 1973 | 3724 | 52.98067 | 0.9342 | 1 | 142 | 1439 | 9.867964 | 0.69680 | 0 | 235 | 688 | 34.15698 | 0.62950 | 0 | 187 | 459 | 40.74074 | 0.40290 | 0 | 422 | 1147 | 36.79163 | 0.55150 | 0 | 497 | 1876 | 26.49254 | 0.8354 | 1 | 511 | 3661 | 13.95794 | 0.5334 | 0 | 246 | 6.60580 | 0.1481 | 0 | 1256 | 33.72718 | 0.9305 | 1 | 496 | 2522 | 19.66693 | 0.7587 | 1 | 274 | 838 | 32.696897 | 0.8779 | 1 | 32 | 3479 | 0.9198045 | 0.42810 | 0 | 2606 | 3724 | 69.97852 | 0.8184 | 1 | 1440 | 21 | 1.4583333 | 0.3683 | 0 | 321 | 22.2916667 | 0.9036 | 1 | 97 | 1147 | 8.456844 | 0.8956 | 1 | 167 | 1147 | 14.559721 | 0.8209 | 1 | 0 | 3724 | 0.0000 | 0.3640 | 0 | 3.55130 | 0.7859 | 2 | 3.14330 | 0.8145 | 3 | 0.8184 | 0.8108 | 1 | 3.3524 | 0.8725 | 3 | 10.86540 | 0.8550 | 9 | 4115 | 1534 | 1268 | 1676 | 3997 | 41.93145 | 0.8814 | 1 | 294 | 1809 | 16.252073 | 0.9674 | 1 | 341 | 814 | 41.891892 | 0.94320 | 1 | 204 | 454 | 44.93392 | 0.5438 | 0 | 545 | 1268 | 42.98107 | 0.83620 | 1 | 624 | 2425 | 25.73196 | 0.9002 | 1 | 994 | 4115 | 24.155529 | 0.9602 | 1 | 642 | 15.601458 | 0.4841 | 0 | 1126 | 27.36331 | 0.8175 | 1 | 568 | 2989.000 | 19.00301 | 0.7045 | 0 | 212 | 715.0000 | 29.650350 | 0.8592 | 1 | 56 | 3825 | 1.4640523 | 0.53120 | 0 | 2715 | 4115.000 | 65.97813 | 0.7732 | 1 | 1534 | 0 | 0.0000000 | 0.1079 | 0 | 529 | 34.4850065 | 0.9685 | 1 | 101 | 1268 | 7.9652997 | 0.8795 | 1 | 89 | 1268.000 | 7.018927 | 0.6184 | 0 | 17 | 4115 | 0.4131227 | 0.5707 | 0 | 4.54540 | 0.9754 | 5 | 3.39650 | 0.9081 | 2 | 0.7732 | 0.7667 | 1 | 3.1450 | 0.7858 | 2 | 11.86010 | 0.9520 | 10 | Yes |
# Join divisional data to nmtc_awards_pre2010, set count to 0 if no data
svi_divisional_nmtc_eligible <-
  left_join(svi_divisional_nmtc_eligible, nmtc_awards_pre2010, join_by("GEOID_2010_trt" == "GEOID10")) %>%
  mutate(pre10_nmtc_project_cnt = if_else(is.na(pre10_nmtc_project_cnt), 0, pre10_nmtc_project_cnt)) %>%
    mutate(pre10_nmtc_dollars = if_else(is.na(pre10_nmtc_dollars), 0, pre10_nmtc_dollars)) %>%
    mutate(pre10_nmtc_dollars_formatted = if_else(is.na(pre10_nmtc_dollars_formatted), "$0", pre10_nmtc_dollars_formatted))

# View table
svi_divisional_nmtc_eligible %>% head() %>% kbl() %>% kable_styling() %>% scroll_box(width = "100%")
| GEOID_2010_trt | FIPS_st | FIPS_county | FIPS_tract | state | state_name | county | region_number | region | division_number | division | E_TOTPOP_10 | E_HU_10 | E_HH_10 | E_POV150_10 | ET_POVSTATUS_10 | EP_POV150_10 | EPL_POV150_10 | F_POV150_10 | E_UNEMP_10 | ET_EMPSTATUS_10 | EP_UNEMP_10 | EPL_UNEMP_10 | F_UNEMP_10 | E_HBURD_OWN_10 | ET_HOUSINGCOST_OWN_10 | EP_HBURD_OWN_10 | EPL_HBURD_OWN_10 | F_HBURD_OWN_10 | E_HBURD_RENT_10 | ET_HOUSINGCOST_RENT_10 | EP_HBURD_RENT_10 | EPL_HBURD_RENT_10 | F_HBURD_RENT_10 | E_HBURD_10 | ET_HOUSINGCOST_10 | EP_HBURD_10 | EPL_HBURD_10 | F_HBURD_10 | E_NOHSDP_10 | ET_EDSTATUS_10 | EP_NOHSDP_10 | EPL_NOHSDP_10 | F_NOHSDP_10 | E_UNINSUR_12 | ET_INSURSTATUS_12 | EP_UNINSUR_12 | EPL_UNINSUR_12 | F_UNINSUR_12 | E_AGE65_10 | EP_AGE65_10 | EPL_AGE65_10 | F_AGE65_10 | E_AGE17_10 | EP_AGE17_10 | EPL_AGE17_10 | F_AGE17_10 | E_DISABL_12 | ET_DISABLSTATUS_12 | EP_DISABL_12 | EPL_DISABL_12 | F_DISABL_12 | E_SNGPNT_10 | ET_FAMILIES_10 | EP_SNGPNT_10 | EPL_SNGPNT_10 | F_SNGPNT_10 | E_LIMENG_10 | ET_POPAGE5UP_10 | EP_LIMENG_10 | EPL_LIMENG_10 | F_LIMENG_10 | E_MINRTY_10 | ET_POPETHRACE_10 | EP_MINRTY_10 | EPL_MINRTY_10 | F_MINRTY_10 | E_STRHU_10 | E_MUNIT_10 | EP_MUNIT_10 | EPL_MUNIT_10 | F_MUNIT_10 | E_MOBILE_10 | EP_MOBILE_10 | EPL_MOBILE_10 | F_MOBILE_10 | E_CROWD_10 | ET_OCCUPANTS_10 | EP_CROWD_10 | EPL_CROWD_10 | F_CROWD_10 | E_NOVEH_10 | ET_KNOWNVEH_10 | EP_NOVEH_10 | EPL_NOVEH_10 | F_NOVEH_10 | E_GROUPQ_10 | ET_HHTYPE_10 | EP_GROUPQ_10 | EPL_GROUPQ_10 | F_GROUPQ_10 | SPL_THEME1_10 | RPL_THEME1_10 | F_THEME1_10 | SPL_THEME2_10 | RPL_THEME2_10 | F_THEME2_10 | SPL_THEME3_10 | RPL_THEME3_10 | F_THEME3_10 | SPL_THEME4_10 | RPL_THEME4_10 | F_THEME4_10 | SPL_THEMES_10 | RPL_THEMES_10 | F_TOTAL_10 | E_TOTPOP_20 | E_HU_20 | E_HH_20 | E_POV150_20 | ET_POVSTATUS_20 | EP_POV150_20 | EPL_POV150_20 | F_POV150_20 | E_UNEMP_20 | ET_EMPSTATUS_20 | EP_UNEMP_20 | EPL_UNEMP_20 | F_UNEMP_20 | E_HBURD_OWN_20 | ET_HOUSINGCOST_OWN_20 | EP_HBURD_OWN_20 | EPL_HBURD_OWN_20 | F_HBURD_OWN_20 | E_HBURD_RENT_20 | ET_HOUSINGCOST_RENT_20 | EP_HBURD_RENT_20 | EPL_HBURD_RENT_20 | F_HBURD_RENT_20 | E_HBURD_20 | ET_HOUSINGCOST_20 | EP_HBURD_20 | EPL_HBURD_20 | F_HBURD_20 | E_NOHSDP_20 | ET_EDSTATUS_20 | EP_NOHSDP_20 | EPL_NOHSDP_20 | F_NOHSDP_20 | E_UNINSUR_20 | ET_INSURSTATUS_20 | EP_UNINSUR_20 | EPL_UNINSUR_20 | F_UNINSUR_20 | E_AGE65_20 | EP_AGE65_20 | EPL_AGE65_20 | F_AGE65_20 | E_AGE17_20 | EP_AGE17_20 | EPL_AGE17_20 | F_AGE17_20 | E_DISABL_20 | ET_DISABLSTATUS_20 | EP_DISABL_20 | EPL_DISABL_20 | F_DISABL_20 | E_SNGPNT_20 | ET_FAMILIES_20 | EP_SNGPNT_20 | EPL_SNGPNT_20 | F_SNGPNT_20 | E_LIMENG_20 | ET_POPAGE5UP_20 | EP_LIMENG_20 | EPL_LIMENG_20 | F_LIMENG_20 | E_MINRTY_20 | ET_POPETHRACE_20 | EP_MINRTY_20 | EPL_MINRTY_20 | F_MINRTY_20 | E_STRHU_20 | E_MUNIT_20 | EP_MUNIT_20 | EPL_MUNIT_20 | F_MUNIT_20 | E_MOBILE_20 | EP_MOBILE_20 | EPL_MOBILE_20 | F_MOBILE_20 | E_CROWD_20 | ET_OCCUPANTS_20 | EP_CROWD_20 | EPL_CROWD_20 | F_CROWD_20 | E_NOVEH_20 | ET_KNOWNVEH_20 | EP_NOVEH_20 | EPL_NOVEH_20 | F_NOVEH_20 | E_GROUPQ_20 | ET_HHTYPE_20 | EP_GROUPQ_20 | EPL_GROUPQ_20 | F_GROUPQ_20 | SPL_THEME1_20 | RPL_THEME1_20 | F_THEME1_20 | SPL_THEME2_20 | RPL_THEME2_20 | F_THEME2_20 | SPL_THEME3_20 | RPL_THEME3_20 | F_THEME3_20 | SPL_THEME4_20 | RPL_THEME4_20 | F_THEME4_20 | SPL_THEMES_20 | RPL_THEMES_20 | F_TOTAL_20 | nmtc_eligibility | pre10_nmtc_project_cnt | pre10_nmtc_dollars | pre10_nmtc_dollars_formatted |
|---|---|---|---|---|---|---|---|---|---|---|---|---|---|---|---|---|---|---|---|---|---|---|---|---|---|---|---|---|---|---|---|---|---|---|---|---|---|---|---|---|---|---|---|---|---|---|---|---|---|---|---|---|---|---|---|---|---|---|---|---|---|---|---|---|---|---|---|---|---|---|---|---|---|---|---|---|---|---|---|---|---|---|---|---|---|---|---|---|---|---|---|---|---|---|---|---|---|---|---|---|---|---|---|---|---|---|---|---|---|---|---|---|---|---|---|---|---|---|---|---|---|---|---|---|---|---|---|---|---|---|---|---|---|---|---|---|---|---|---|---|---|---|---|---|---|---|---|---|---|---|---|---|---|---|---|---|---|---|---|---|---|---|---|---|---|---|---|---|---|---|---|---|---|---|---|---|---|---|---|---|---|---|---|---|---|---|---|---|---|---|---|---|---|---|---|---|---|---|---|---|---|---|---|---|---|---|---|---|---|---|---|---|---|---|---|---|---|---|---|---|---|---|---|---|
| 10001040201 | 10 | 001 | 040201 | DE | Delaware | Kent County | 3 | South Region | 5 | South Atlantic Division | 5208 | 1953 | 1809 | 850 | 5183 | 16.399769 | 0.3672 | 0 | 147 | 2550 | 5.764706 | 0.3364 | 0 | 385 | 1323 | 29.10053 | 0.45810 | 0 | 222 | 486 | 45.67901 | 0.49650 | 0 | 607 | 1809 | 33.55445 | 0.4431 | 0 | 459 | 3090 | 14.8543689 | 0.5386 | 0 | 435 | 5283 | 8.233958 | 0.19610 | 0 | 454 | 8.717358 | 0.256100 | 0 | 1588 | 30.491551 | 0.8927 | 1 | 537 | 3716 | 14.451023 | 0.4708 | 0 | 417 | 1343 | 31.04989 | 0.8599 | 1 | 69 | 4835 | 1.427094 | 0.5240 | 0 | 1881 | 5208 | 36.11751 | 0.5689 | 0 | 1953 | 87 | 4.454685 | 0.5392 | 0 | 148 | 7.578085 | 0.6495 | 0 | 39 | 1809 | 2.155887 | 0.6471 | 0 | 121 | 1809 | 6.688778 | 0.6124 | 0 | 0 | 5208 | 0.0000000 | 0.3814 | 0 | 1.88140 | 0.3053 | 0 | 3.003500 | 0.7667 | 2 | 0.5689 | 0.5614 | 0 | 2.8296 | 0.6516 | 0 | 8.283400 | 0.5452 | 2 | 4770 | 1906 | 1732 | 755 | 4692 | 16.09122 | 0.3758 | 0 | 92 | 2500 | 3.680000 | 0.3633 | 0 | 197 | 1184 | 16.638513 | 0.280400 | 0 | 235 | 548 | 42.88321 | 0.4609 | 0 | 432 | 1732 | 24.94226 | 0.3622 | 0 | 251 | 3100 | 8.096774 | 0.4085 | 0 | 228 | 4770 | 4.779874 | 0.21160 | 0 | 549 | 11.509434 | 0.23290 | 0 | 1352 | 28.343816 | 0.88650 | 1 | 490 | 3418.125 | 14.335346 | 0.4309 | 0 | 328 | 1263.2064 | 25.965669 | 0.8111 | 1 | 0 | 4526 | 0.0000000 | 0.09987 | 0 | 1875 | 4769.908 | 39.30893 | 0.5372 | 0 | 1906 | 72 | 3.7775446 | 0.4876 | 0 | 128 | 6.7156348 | 0.6610 | 0 | 10 | 1732 | 0.5773672 | 0.3165 | 0 | 32 | 1731.7111 | 1.847883 | 0.2303 | 0 | 0 | 4770 | 0.0000000 | 0.2111 | 0 | 1.72140 | 0.2531 | 0 | 2.46127 | 0.45940 | 2 | 0.5372 | 0.5306 | 0 | 1.9065 | 0.2183 | 0 | 6.62637 | 0.2829 | 2 | Yes | 0 | 0 | \$0 |
| 10001040502 | 10 | 001 | 040502 | DE | Delaware | Kent County | 3 | South Region | 5 | South Atlantic Division | 2087 | 921 | 921 | 192 | 2087 | 9.199808 | 0.1738 | 0 | 35 | 722 | 4.847645 | 0.2495 | 0 | 281 | 700 | 40.14286 | 0.78190 | 1 | 64 | 221 | 28.95928 | 0.17110 | 0 | 345 | 921 | 37.45928 | 0.5710 | 0 | 284 | 1546 | 18.3699871 | 0.6484 | 0 | 119 | 2121 | 5.610561 | 0.10710 | 0 | 518 | 24.820316 | 0.906800 | 1 | 480 | 22.999521 | 0.4910 | 0 | 328 | 1527 | 21.480026 | 0.7959 | 1 | 173 | 680 | 25.44118 | 0.7769 | 1 | 100 | 1998 | 5.005005 | 0.7960 | 1 | 560 | 2087 | 26.83277 | 0.4524 | 0 | 921 | 0 | 0.000000 | 0.1428 | 0 | 273 | 29.641694 | 0.8785 | 1 | 0 | 921 | 0.000000 | 0.1488 | 0 | 30 | 921 | 3.257329 | 0.3600 | 0 | 0 | 2087 | 0.0000000 | 0.3814 | 0 | 1.74980 | 0.2670 | 0 | 3.766600 | 0.9666 | 4 | 0.4524 | 0.4464 | 0 | 1.9115 | 0.2071 | 1 | 7.880300 | 0.4785 | 5 | 2555 | 1030 | 954 | 565 | 2555 | 22.11350 | 0.5385 | 0 | 135 | 1154 | 11.698440 | 0.9175 | 1 | 144 | 691 | 20.839363 | 0.486500 | 0 | 168 | 262 | 64.12214 | 0.8894 | 1 | 312 | 953 | 32.73872 | 0.6259 | 0 | 192 | 1782 | 10.774411 | 0.5377 | 0 | 198 | 2519 | 7.860262 | 0.40160 | 0 | 519 | 20.313112 | 0.68510 | 0 | 664 | 25.988258 | 0.79390 | 1 | 341 | 1854.295 | 18.389741 | 0.6427 | 0 | 195 | 614.6519 | 31.725274 | 0.8870 | 1 | 75 | 2351 | 3.1901319 | 0.72360 | 0 | 1215 | 2555.353 | 47.54725 | 0.6272 | 0 | 1030 | 61 | 5.9223301 | 0.5514 | 0 | 170 | 16.5048544 | 0.7844 | 1 | 58 | 954 | 6.0796646 | 0.8947 | 1 | 83 | 953.5886 | 8.703963 | 0.7220 | 0 | 0 | 2555 | 0.0000000 | 0.2111 | 0 | 3.02120 | 0.6565 | 1 | 3.73230 | 0.96800 | 2 | 0.6272 | 0.6195 | 0 | 3.1636 | 0.7893 | 2 | 10.54430 | 0.8433 | 5 | Yes | 0 | 0 | \$0 |
| 10001040900 | 10 | 001 | 040900 | DE | Delaware | Kent County | 3 | South Region | 5 | South Atlantic Division | 2363 | 1205 | 1007 | 526 | 1741 | 30.212522 | 0.7006 | 0 | 171 | 1089 | 15.702479 | 0.9032 | 1 | 98 | 362 | 27.07182 | 0.37770 | 0 | 258 | 645 | 40.00000 | 0.36590 | 0 | 356 | 1007 | 35.35253 | 0.5041 | 0 | 248 | 1416 | 17.5141243 | 0.6235 | 0 | 118 | 2479 | 4.759984 | 0.08169 | 0 | 509 | 21.540415 | 0.863300 | 1 | 168 | 7.109606 | 0.0386 | 0 | 428 | 1427 | 29.992992 | 0.9611 | 1 | 44 | 387 | 11.36951 | 0.3400 | 0 | 50 | 2349 | 2.128565 | 0.6157 | 0 | 727 | 2363 | 30.76598 | 0.5048 | 0 | 1205 | 378 | 31.369295 | 0.8688 | 1 | 0 | 0.000000 | 0.1809 | 0 | 0 | 1007 | 0.000000 | 0.1488 | 0 | 256 | 1007 | 25.422046 | 0.9457 | 1 | 622 | 2363 | 26.3224714 | 0.9741 | 1 | 2.81309 | 0.5851 | 1 | 2.818700 | 0.6717 | 2 | 0.5048 | 0.4981 | 0 | 3.1183 | 0.7840 | 3 | 9.254890 | 0.6833 | 6 | 2373 | 1114 | 1028 | 574 | 1679 | 34.18702 | 0.7904 | 1 | 19 | 1034 | 1.837524 | 0.1211 | 0 | 26 | 313 | 8.306709 | 0.029920 | 0 | 335 | 715 | 46.85315 | 0.5540 | 0 | 361 | 1028 | 35.11673 | 0.6908 | 0 | 224 | 1292 | 17.337461 | 0.7807 | 1 | 78 | 2250 | 3.466667 | 0.13250 | 0 | 501 | 21.112516 | 0.71690 | 0 | 208 | 8.765276 | 0.05851 | 0 | 391 | 1505.000 | 25.980066 | 0.9018 | 1 | 29 | 220.0000 | 13.181818 | 0.4476 | 0 | 7 | 2268 | 0.3086420 | 0.28740 | 0 | 974 | 2373.000 | 41.04509 | 0.5571 | 0 | 1114 | 476 | 42.7289048 | 0.9104 | 1 | 0 | 0.0000000 | 0.1800 | 0 | 5 | 1028 | 0.4863813 | 0.2927 | 0 | 248 | 1028.0000 | 24.124514 | 0.9466 | 1 | 678 | 2373 | 28.5714286 | 0.9778 | 1 | 2.51550 | 0.4976 | 2 | 2.41221 | 0.42860 | 1 | 0.5571 | 0.5503 | 0 | 3.3075 | 0.8411 | 3 | 8.79231 | 0.6264 | 6 | Yes | 0 | 0 | \$0 |
| 10001041000 | 10 | 001 | 041000 | DE | Delaware | Kent County | 3 | South Region | 5 | South Atlantic Division | 5577 | 2570 | 2369 | 1291 | 5577 | 23.148646 | 0.5435 | 0 | 144 | 2702 | 5.329386 | 0.2938 | 0 | 468 | 1312 | 35.67073 | 0.67500 | 0 | 135 | 1057 | 12.77200 | 0.04274 | 0 | 603 | 2369 | 25.45378 | 0.1769 | 0 | 759 | 3504 | 21.6609589 | 0.7311 | 0 | 655 | 5999 | 10.918486 | 0.29800 | 0 | 594 | 10.650888 | 0.371200 | 0 | 1487 | 26.663080 | 0.7247 | 0 | 683 | 4587 | 14.889906 | 0.4947 | 0 | 364 | 1466 | 24.82947 | 0.7646 | 1 | 188 | 5105 | 3.682664 | 0.7342 | 0 | 3384 | 5577 | 60.67778 | 0.7785 | 1 | 2570 | 479 | 18.638132 | 0.7741 | 1 | 567 | 22.062257 | 0.8159 | 1 | 91 | 2369 | 3.841283 | 0.8132 | 1 | 221 | 2369 | 9.328831 | 0.7266 | 0 | 9 | 5577 | 0.1613771 | 0.7632 | 1 | 2.04330 | 0.3511 | 0 | 3.089400 | 0.8041 | 1 | 0.7785 | 0.7682 | 1 | 3.8930 | 0.9705 | 4 | 9.804200 | 0.7522 | 6 | 6719 | 3107 | 2804 | 2006 | 6656 | 30.13822 | 0.7207 | 0 | 436 | 3058 | 14.257685 | 0.9556 | 1 | 299 | 1387 | 21.557318 | 0.521400 | 0 | 583 | 1417 | 41.14326 | 0.4216 | 0 | 882 | 2804 | 31.45506 | 0.5861 | 0 | 953 | 4915 | 19.389624 | 0.8333 | 1 | 509 | 6603 | 7.708617 | 0.39290 | 0 | 1221 | 18.172347 | 0.58640 | 0 | 1389 | 20.672719 | 0.47220 | 0 | 1393 | 5214.000 | 26.716532 | 0.9150 | 1 | 661 | 1752.0000 | 37.728310 | 0.9336 | 1 | 340 | 6411 | 5.3033848 | 0.82180 | 1 | 4068 | 6719.048 | 60.54429 | 0.7409 | 0 | 3107 | 469 | 15.0949469 | 0.7136 | 0 | 586 | 18.8606373 | 0.8099 | 1 | 54 | 2804 | 1.9258203 | 0.5840 | 0 | 253 | 2804.0000 | 9.022825 | 0.7342 | 0 | 70 | 6719 | 1.0418217 | 0.7345 | 0 | 3.48860 | 0.7870 | 2 | 3.72900 | 0.96760 | 3 | 0.7409 | 0.7319 | 0 | 3.5762 | 0.9178 | 1 | 11.53470 | 0.9313 | 6 | Yes | 0 | 0 | \$0 |
| 10001041100 | 10 | 001 | 041100 | DE | Delaware | Kent County | 3 | South Region | 5 | South Atlantic Division | 2957 | 800 | 738 | 499 | 2555 | 19.530333 | 0.4511 | 0 | 44 | 845 | 5.207101 | 0.2813 | 0 | 0 | 8 | 0.00000 | 0.00257 | 0 | 395 | 730 | 54.10959 | 0.69280 | 0 | 395 | 738 | 53.52304 | 0.9155 | 1 | 11 | 1118 | 0.9838998 | 0.0213 | 0 | 65 | 2559 | 2.540055 | 0.02694 | 0 | 0 | 0.000000 | 0.003549 | 0 | 1198 | 40.514035 | 0.9944 | 1 | 117 | 1192 | 9.815436 | 0.2221 | 0 | 133 | 693 | 19.19192 | 0.6322 | 0 | 42 | 2551 | 1.646413 | 0.5567 | 0 | 720 | 2957 | 24.34900 | 0.4177 | 0 | 800 | 0 | 0.000000 | 0.1428 | 0 | 0 | 0.000000 | 0.1809 | 0 | 0 | 738 | 0.000000 | 0.1488 | 0 | 10 | 738 | 1.355014 | 0.1640 | 0 | 402 | 2957 | 13.5948597 | 0.9492 | 1 | 1.69614 | 0.2527 | 1 | 2.408949 | 0.4377 | 1 | 0.4177 | 0.4122 | 0 | 1.5857 | 0.1097 | 1 | 6.108489 | 0.2207 | 3 | 3881 | 1350 | 1322 | 1031 | 3618 | 28.49641 | 0.6874 | 0 | 58 | 877 | 6.613455 | 0.6891 | 0 | 0 | 3 | 0.000000 | 0.002567 | 0 | 758 | 1319 | 57.46778 | 0.7890 | 1 | 758 | 1322 | 57.33737 | 0.9772 | 1 | 41 | 1801 | 2.276513 | 0.0857 | 0 | 33 | 2762 | 1.194786 | 0.02847 | 0 | 64 | 1.649059 | 0.01027 | 0 | 1291 | 33.264623 | 0.97230 | 1 | 129 | 1470.497 | 8.772546 | 0.1457 | 0 | 113 | 1156.7160 | 9.769036 | 0.3067 | 0 | 4 | 3373 | 0.1185888 | 0.22310 | 0 | 1672 | 3881.437 | 43.07683 | 0.5797 | 0 | 1350 | 9 | 0.6666667 | 0.3180 | 0 | 10 | 0.7407407 | 0.4343 | 0 | 1 | 1322 | 0.0756430 | 0.2359 | 0 | 18 | 1321.8616 | 1.361716 | 0.1744 | 0 | 263 | 3881 | 6.7766040 | 0.9251 | 1 | 2.46787 | 0.4818 | 1 | 1.65807 | 0.08121 | 1 | 0.5797 | 0.5726 | 0 | 2.0877 | 0.2866 | 1 | 6.79334 | 0.3059 | 3 | Yes | 0 | 0 | \$0 |
| 10001041200 | 10 | 001 | 041200 | DE | Delaware | Kent County | 3 | South Region | 5 | South Atlantic Division | 4723 | 1880 | 1742 | 778 | 4710 | 16.518047 | 0.3700 | 0 | 193 | 2264 | 8.524735 | 0.5848 | 0 | 481 | 1168 | 41.18151 | 0.80360 | 1 | 257 | 574 | 44.77352 | 0.47360 | 0 | 738 | 1742 | 42.36510 | 0.7087 | 0 | 573 | 3071 | 18.6584175 | 0.6563 | 0 | 471 | 3937 | 11.963424 | 0.34310 | 0 | 600 | 12.703790 | 0.504200 | 0 | 1257 | 26.614440 | 0.7223 | 0 | 583 | 3036 | 19.202899 | 0.7085 | 0 | 240 | 1183 | 20.28740 | 0.6645 | 0 | 190 | 4378 | 4.339881 | 0.7670 | 1 | 2933 | 4723 | 62.10036 | 0.7871 | 1 | 1880 | 327 | 17.393617 | 0.7606 | 1 | 353 | 18.776596 | 0.7841 | 1 | 41 | 1742 | 2.353616 | 0.6746 | 0 | 92 | 1742 | 5.281286 | 0.5288 | 0 | 0 | 4723 | 0.0000000 | 0.3814 | 0 | 2.66290 | 0.5376 | 0 | 3.366500 | 0.8969 | 1 | 0.7871 | 0.7767 | 1 | 3.1295 | 0.7889 | 2 | 9.946000 | 0.7681 | 4 | 4135 | 1851 | 1712 | 870 | 4076 | 21.34446 | 0.5206 | 0 | 180 | 1879 | 9.579564 | 0.8567 | 1 | 384 | 1230 | 31.219512 | 0.844800 | 1 | 226 | 482 | 46.88797 | 0.5550 | 0 | 610 | 1712 | 35.63084 | 0.7027 | 0 | 286 | 2785 | 10.269300 | 0.5146 | 0 | 204 | 4124 | 4.946654 | 0.22200 | 0 | 755 | 18.258767 | 0.59080 | 0 | 1067 | 25.804111 | 0.78410 | 1 | 571 | 3057.653 | 18.674456 | 0.6593 | 0 | 375 | 1138.2043 | 32.946633 | 0.8989 | 1 | 26 | 3953 | 0.6577283 | 0.38940 | 0 | 2299 | 4134.641 | 55.60337 | 0.6982 | 0 | 1851 | 175 | 9.4543490 | 0.6291 | 0 | 438 | 23.6628849 | 0.8514 | 1 | 5 | 1712 | 0.2920561 | 0.2552 | 0 | 143 | 1712.2269 | 8.351697 | 0.7088 | 0 | 20 | 4135 | 0.4836759 | 0.6479 | 0 | 2.81660 | 0.5950 | 1 | 3.32250 | 0.89620 | 2 | 0.6982 | 0.6897 | 0 | 3.0924 | 0.7625 | 1 | 9.92970 | 0.7729 | 4 | Yes | 0 | 0 | \$0 |
# Join national data to nmtc_awards_pre2010, set count to 0 if no data
svi_national_nmtc_eligible <-
  left_join(svi_national_nmtc_eligible, nmtc_awards_pre2010, join_by("GEOID_2010_trt" == "GEOID10")) %>%
  mutate(pre10_nmtc_project_cnt = if_else(is.na(pre10_nmtc_project_cnt), 0, pre10_nmtc_project_cnt)) %>%
    mutate(pre10_nmtc_dollars = if_else(is.na(pre10_nmtc_dollars), 0, pre10_nmtc_dollars))%>%
    mutate(pre10_nmtc_dollars_formatted = if_else(is.na(pre10_nmtc_dollars_formatted), "$0", pre10_nmtc_dollars_formatted))

# View table
svi_national_nmtc_eligible %>% head() %>% kbl() %>% kable_styling() %>% scroll_box(width = "100%")
| GEOID_2010_trt | FIPS_st | FIPS_county | FIPS_tract | state | state_name | county | region_number | region | division_number | division | E_TOTPOP_10 | E_HU_10 | E_HH_10 | E_POV150_10 | ET_POVSTATUS_10 | EP_POV150_10 | EPL_POV150_10 | F_POV150_10 | E_UNEMP_10 | ET_EMPSTATUS_10 | EP_UNEMP_10 | EPL_UNEMP_10 | F_UNEMP_10 | E_HBURD_OWN_10 | ET_HOUSINGCOST_OWN_10 | EP_HBURD_OWN_10 | EPL_HBURD_OWN_10 | F_HBURD_OWN_10 | E_HBURD_RENT_10 | ET_HOUSINGCOST_RENT_10 | EP_HBURD_RENT_10 | EPL_HBURD_RENT_10 | F_HBURD_RENT_10 | E_HBURD_10 | ET_HOUSINGCOST_10 | EP_HBURD_10 | EPL_HBURD_10 | F_HBURD_10 | E_NOHSDP_10 | ET_EDSTATUS_10 | EP_NOHSDP_10 | EPL_NOHSDP_10 | F_NOHSDP_10 | E_UNINSUR_12 | ET_INSURSTATUS_12 | EP_UNINSUR_12 | EPL_UNINSUR_12 | F_UNINSUR_12 | E_AGE65_10 | EP_AGE65_10 | EPL_AGE65_10 | F_AGE65_10 | E_AGE17_10 | EP_AGE17_10 | EPL_AGE17_10 | F_AGE17_10 | E_DISABL_12 | ET_DISABLSTATUS_12 | EP_DISABL_12 | EPL_DISABL_12 | F_DISABL_12 | E_SNGPNT_10 | ET_FAMILIES_10 | EP_SNGPNT_10 | EPL_SNGPNT_10 | F_SNGPNT_10 | E_LIMENG_10 | ET_POPAGE5UP_10 | EP_LIMENG_10 | EPL_LIMENG_10 | F_LIMENG_10 | E_MINRTY_10 | ET_POPETHRACE_10 | EP_MINRTY_10 | EPL_MINRTY_10 | F_MINRTY_10 | E_STRHU_10 | E_MUNIT_10 | EP_MUNIT_10 | EPL_MUNIT_10 | F_MUNIT_10 | E_MOBILE_10 | EP_MOBILE_10 | EPL_MOBILE_10 | F_MOBILE_10 | E_CROWD_10 | ET_OCCUPANTS_10 | EP_CROWD_10 | EPL_CROWD_10 | F_CROWD_10 | E_NOVEH_10 | ET_KNOWNVEH_10 | EP_NOVEH_10 | EPL_NOVEH_10 | F_NOVEH_10 | E_GROUPQ_10 | ET_HHTYPE_10 | EP_GROUPQ_10 | EPL_GROUPQ_10 | F_GROUPQ_10 | SPL_THEME1_10 | RPL_THEME1_10 | F_THEME1_10 | SPL_THEME2_10 | RPL_THEME2_10 | F_THEME2_10 | SPL_THEME3_10 | RPL_THEME3_10 | F_THEME3_10 | SPL_THEME4_10 | RPL_THEME4_10 | F_THEME4_10 | SPL_THEMES_10 | RPL_THEMES_10 | F_TOTAL_10 | E_TOTPOP_20 | E_HU_20 | E_HH_20 | E_POV150_20 | ET_POVSTATUS_20 | EP_POV150_20 | EPL_POV150_20 | F_POV150_20 | E_UNEMP_20 | ET_EMPSTATUS_20 | EP_UNEMP_20 | EPL_UNEMP_20 | F_UNEMP_20 | E_HBURD_OWN_20 | ET_HOUSINGCOST_OWN_20 | EP_HBURD_OWN_20 | EPL_HBURD_OWN_20 | F_HBURD_OWN_20 | E_HBURD_RENT_20 | ET_HOUSINGCOST_RENT_20 | EP_HBURD_RENT_20 | EPL_HBURD_RENT_20 | F_HBURD_RENT_20 | E_HBURD_20 | ET_HOUSINGCOST_20 | EP_HBURD_20 | EPL_HBURD_20 | F_HBURD_20 | E_NOHSDP_20 | ET_EDSTATUS_20 | EP_NOHSDP_20 | EPL_NOHSDP_20 | F_NOHSDP_20 | E_UNINSUR_20 | ET_INSURSTATUS_20 | EP_UNINSUR_20 | EPL_UNINSUR_20 | F_UNINSUR_20 | E_AGE65_20 | EP_AGE65_20 | EPL_AGE65_20 | F_AGE65_20 | E_AGE17_20 | EP_AGE17_20 | EPL_AGE17_20 | F_AGE17_20 | E_DISABL_20 | ET_DISABLSTATUS_20 | EP_DISABL_20 | EPL_DISABL_20 | F_DISABL_20 | E_SNGPNT_20 | ET_FAMILIES_20 | EP_SNGPNT_20 | EPL_SNGPNT_20 | F_SNGPNT_20 | E_LIMENG_20 | ET_POPAGE5UP_20 | EP_LIMENG_20 | EPL_LIMENG_20 | F_LIMENG_20 | E_MINRTY_20 | ET_POPETHRACE_20 | EP_MINRTY_20 | EPL_MINRTY_20 | F_MINRTY_20 | E_STRHU_20 | E_MUNIT_20 | EP_MUNIT_20 | EPL_MUNIT_20 | F_MUNIT_20 | E_MOBILE_20 | EP_MOBILE_20 | EPL_MOBILE_20 | F_MOBILE_20 | E_CROWD_20 | ET_OCCUPANTS_20 | EP_CROWD_20 | EPL_CROWD_20 | F_CROWD_20 | E_NOVEH_20 | ET_KNOWNVEH_20 | EP_NOVEH_20 | EPL_NOVEH_20 | F_NOVEH_20 | E_GROUPQ_20 | ET_HHTYPE_20 | EP_GROUPQ_20 | EPL_GROUPQ_20 | F_GROUPQ_20 | SPL_THEME1_20 | RPL_THEME1_20 | F_THEME1_20 | SPL_THEME2_20 | RPL_THEME2_20 | F_THEME2_20 | SPL_THEME3_20 | RPL_THEME3_20 | F_THEME3_20 | SPL_THEME4_20 | RPL_THEME4_20 | F_THEME4_20 | SPL_THEMES_20 | RPL_THEMES_20 | F_TOTAL_20 | nmtc_eligibility | pre10_nmtc_project_cnt | pre10_nmtc_dollars | pre10_nmtc_dollars_formatted |
|---|---|---|---|---|---|---|---|---|---|---|---|---|---|---|---|---|---|---|---|---|---|---|---|---|---|---|---|---|---|---|---|---|---|---|---|---|---|---|---|---|---|---|---|---|---|---|---|---|---|---|---|---|---|---|---|---|---|---|---|---|---|---|---|---|---|---|---|---|---|---|---|---|---|---|---|---|---|---|---|---|---|---|---|---|---|---|---|---|---|---|---|---|---|---|---|---|---|---|---|---|---|---|---|---|---|---|---|---|---|---|---|---|---|---|---|---|---|---|---|---|---|---|---|---|---|---|---|---|---|---|---|---|---|---|---|---|---|---|---|---|---|---|---|---|---|---|---|---|---|---|---|---|---|---|---|---|---|---|---|---|---|---|---|---|---|---|---|---|---|---|---|---|---|---|---|---|---|---|---|---|---|---|---|---|---|---|---|---|---|---|---|---|---|---|---|---|---|---|---|---|---|---|---|---|---|---|---|---|---|---|---|---|---|---|---|---|---|---|---|---|---|---|---|---|
| 01001020200 | 01 | 001 | 020200 | AL | Alabama | Autauga County | 3 | South Region | 6 | East South Central Division | 2020 | 816 | 730 | 495 | 1992 | 24.84940 | 0.5954 | 0 | 68 | 834 | 8.153477 | 0.57540 | 0 | 49 | 439 | 11.16173 | 0.02067 | 0 | 105 | 291 | 36.08247 | 0.30190 | 0 | 154 | 730 | 21.09589 | 0.09312 | 0 | 339 | 1265 | 26.79842 | 0.8392 | 1 | 313 | 2012 | 15.55666 | 0.6000 | 0 | 204 | 10.09901 | 0.3419 | 0 | 597 | 29.55446 | 0.8192 | 1 | 359 | 1515 | 23.69637 | 0.8791 | 1 | 132 | 456 | 28.947368 | 0.8351 | 1 | 15 | 1890 | 0.7936508 | 0.40130 | 0 | 1243 | 2020 | 61.53465 | 0.7781 | 1 | 816 | 0 | 0.0000000 | 0.1224 | 0 | 34 | 4.1666667 | 0.6664 | 0 | 13 | 730 | 1.780822 | 0.5406 | 0 | 115 | 730 | 15.753425 | 0.8382 | 1 | 0 | 2020 | 0.0000 | 0.3640 | 0 | 2.70312 | 0.5665 | 1 | 3.27660 | 0.8614 | 3 | 0.7781 | 0.7709 | 1 | 2.5316 | 0.5047 | 1 | 9.28942 | 0.6832 | 6 | 1757 | 720 | 573 | 384 | 1511 | 25.41363 | 0.6427 | 0 | 29 | 717 | 4.044630 | 0.4132 | 0 | 33 | 392 | 8.418367 | 0.03542 | 0 | 116 | 181 | 64.08840 | 0.9086 | 1 | 149 | 573 | 26.00349 | 0.40410 | 0 | 139 | 1313 | 10.58644 | 0.5601 | 0 | 91 | 1533 | 5.936073 | 0.4343 | 0 | 284 | 16.163916 | 0.5169 | 0 | 325 | 18.49744 | 0.2851 | 0 | 164 | 1208.000 | 13.57616 | 0.4127 | 0 | 42 | 359.0000 | 11.699164 | 0.3998 | 0 | 0 | 1651 | 0.0000000 | 0.09479 | 0 | 1116 | 1757.000 | 63.51736 | 0.7591 | 1 | 720 | 3 | 0.4166667 | 0.2470 | 0 | 5 | 0.6944444 | 0.5106 | 0 | 9 | 573 | 1.5706806 | 0.4688 | 0 | 57 | 573.000 | 9.947644 | 0.7317 | 0 | 212 | 1757 | 12.0660216 | 0.9549 | 1 | 2.45440 | 0.4888 | 0 | 1.70929 | 0.1025 | 0 | 0.7591 | 0.7527 | 1 | 2.9130 | 0.6862 | 1 | 7.83579 | 0.4802 | 2 | Yes | 0 | 0 | \$0 |
| 01001020700 | 01 | 001 | 020700 | AL | Alabama | Autauga County | 3 | South Region | 6 | East South Central Division | 2664 | 1254 | 1139 | 710 | 2664 | 26.65165 | 0.6328 | 0 | 29 | 1310 | 2.213741 | 0.05255 | 0 | 134 | 710 | 18.87324 | 0.13890 | 0 | 187 | 429 | 43.58974 | 0.47090 | 0 | 321 | 1139 | 28.18262 | 0.28130 | 0 | 396 | 1852 | 21.38229 | 0.7478 | 0 | 345 | 2878 | 11.98749 | 0.4459 | 0 | 389 | 14.60210 | 0.6417 | 0 | 599 | 22.48499 | 0.4007 | 0 | 510 | 2168 | 23.52399 | 0.8752 | 1 | 228 | 712 | 32.022472 | 0.8712 | 1 | 0 | 2480 | 0.0000000 | 0.09298 | 0 | 694 | 2664 | 26.05105 | 0.5138 | 0 | 1254 | 8 | 0.6379585 | 0.2931 | 0 | 460 | 36.6826156 | 0.9714 | 1 | 0 | 1139 | 0.000000 | 0.1238 | 0 | 125 | 1139 | 10.974539 | 0.7477 | 0 | 0 | 2664 | 0.0000 | 0.3640 | 0 | 2.16035 | 0.4069 | 0 | 2.88178 | 0.6997 | 2 | 0.5138 | 0.5090 | 0 | 2.5000 | 0.4882 | 1 | 8.05593 | 0.5185 | 3 | 3562 | 1313 | 1248 | 1370 | 3528 | 38.83220 | 0.8512 | 1 | 128 | 1562 | 8.194622 | 0.7935 | 1 | 168 | 844 | 19.905213 | 0.44510 | 0 | 237 | 404 | 58.66337 | 0.8359 | 1 | 405 | 1248 | 32.45192 | 0.60420 | 0 | 396 | 2211 | 17.91045 | 0.7857 | 1 | 444 | 3547 | 12.517620 | 0.7758 | 1 | 355 | 9.966311 | 0.1800 | 0 | 954 | 26.78271 | 0.7923 | 1 | 629 | 2593.000 | 24.25762 | 0.8730 | 1 | 171 | 797.0000 | 21.455458 | 0.7186 | 0 | 0 | 3211 | 0.0000000 | 0.09479 | 0 | 1009 | 3562.000 | 28.32678 | 0.4668 | 0 | 1313 | 14 | 1.0662605 | 0.3165 | 0 | 443 | 33.7395278 | 0.9663 | 1 | 73 | 1248 | 5.8493590 | 0.8211 | 1 | 17 | 1248.000 | 1.362180 | 0.1554 | 0 | 112 | 3562 | 3.1443010 | 0.8514 | 1 | 3.81040 | 0.8569 | 4 | 2.65869 | 0.5847 | 2 | 0.4668 | 0.4629 | 0 | 3.1107 | 0.7714 | 3 | 10.04659 | 0.7851 | 9 | Yes | 0 | 0 | \$0 |
| 01001021100 | 01 | 001 | 021100 | AL | Alabama | Autauga County | 3 | South Region | 6 | East South Central Division | 3298 | 1502 | 1323 | 860 | 3298 | 26.07641 | 0.6211 | 0 | 297 | 1605 | 18.504673 | 0.94340 | 1 | 250 | 1016 | 24.60630 | 0.32070 | 0 | 74 | 307 | 24.10423 | 0.11920 | 0 | 324 | 1323 | 24.48980 | 0.17380 | 0 | 710 | 2231 | 31.82429 | 0.8976 | 1 | 654 | 3565 | 18.34502 | 0.7018 | 0 | 411 | 12.46210 | 0.5001 | 0 | 738 | 22.37720 | 0.3934 | 0 | 936 | 2861 | 32.71583 | 0.9807 | 1 | 138 | 825 | 16.727273 | 0.5715 | 0 | 9 | 3155 | 0.2852615 | 0.25010 | 0 | 1979 | 3298 | 60.00606 | 0.7703 | 1 | 1502 | 14 | 0.9320905 | 0.3234 | 0 | 659 | 43.8748336 | 0.9849 | 1 | 44 | 1323 | 3.325775 | 0.7062 | 0 | 137 | 1323 | 10.355253 | 0.7313 | 0 | 0 | 3298 | 0.0000 | 0.3640 | 0 | 3.33770 | 0.7351 | 2 | 2.69580 | 0.6028 | 1 | 0.7703 | 0.7631 | 1 | 3.1098 | 0.7827 | 1 | 9.91360 | 0.7557 | 5 | 3499 | 1825 | 1462 | 1760 | 3499 | 50.30009 | 0.9396 | 1 | 42 | 966 | 4.347826 | 0.4539 | 0 | 426 | 1274 | 33.437991 | 0.85200 | 1 | 52 | 188 | 27.65957 | 0.1824 | 0 | 478 | 1462 | 32.69494 | 0.61110 | 0 | 422 | 2488 | 16.96141 | 0.7638 | 1 | 497 | 3499 | 14.204058 | 0.8246 | 1 | 853 | 24.378394 | 0.8688 | 1 | 808 | 23.09231 | 0.5829 | 0 | 908 | 2691.100 | 33.74084 | 0.9808 | 1 | 179 | 811.6985 | 22.052524 | 0.7323 | 0 | 8 | 3248 | 0.2463054 | 0.26220 | 0 | 1986 | 3498.713 | 56.76373 | 0.7175 | 0 | 1825 | 29 | 1.5890411 | 0.3551 | 0 | 576 | 31.5616438 | 0.9594 | 1 | 88 | 1462 | 6.0191518 | 0.8269 | 1 | 148 | 1461.993 | 10.123166 | 0.7364 | 0 | 38 | 3499 | 1.0860246 | 0.7013 | 0 | 3.59300 | 0.8073 | 3 | 3.42700 | 0.9156 | 2 | 0.7175 | 0.7114 | 0 | 3.5791 | 0.9216 | 2 | 11.31660 | 0.9150 | 7 | Yes | 0 | 0 | \$0 |
| 01003010200 | 01 | 003 | 010200 | AL | Alabama | Baldwin County | 3 | South Region | 6 | East South Central Division | 2612 | 1220 | 1074 | 338 | 2605 | 12.97505 | 0.2907 | 0 | 44 | 1193 | 3.688181 | 0.14720 | 0 | 172 | 928 | 18.53448 | 0.13090 | 0 | 31 | 146 | 21.23288 | 0.09299 | 0 | 203 | 1074 | 18.90130 | 0.05657 | 0 | 455 | 1872 | 24.30556 | 0.8016 | 1 | 456 | 2730 | 16.70330 | 0.6445 | 0 | 401 | 15.35222 | 0.6847 | 0 | 563 | 21.55436 | 0.3406 | 0 | 410 | 2038 | 20.11776 | 0.7755 | 1 | 64 | 779 | 8.215661 | 0.2181 | 0 | 0 | 2510 | 0.0000000 | 0.09298 | 0 | 329 | 2612 | 12.59571 | 0.3113 | 0 | 1220 | 38 | 3.1147541 | 0.4648 | 0 | 385 | 31.5573770 | 0.9545 | 1 | 20 | 1074 | 1.862197 | 0.5509 | 0 | 43 | 1074 | 4.003724 | 0.4088 | 0 | 0 | 2612 | 0.0000 | 0.3640 | 0 | 1.94057 | 0.3398 | 1 | 2.11188 | 0.2802 | 1 | 0.3113 | 0.3084 | 0 | 2.7430 | 0.6129 | 1 | 7.10675 | 0.3771 | 3 | 2928 | 1312 | 1176 | 884 | 2928 | 30.19126 | 0.7334 | 0 | 29 | 1459 | 1.987663 | 0.1356 | 0 | 71 | 830 | 8.554217 | 0.03726 | 0 | 134 | 346 | 38.72832 | 0.3964 | 0 | 205 | 1176 | 17.43197 | 0.12010 | 0 | 294 | 2052 | 14.32749 | 0.6940 | 0 | 219 | 2925 | 7.487179 | 0.5423 | 0 | 556 | 18.989071 | 0.6705 | 0 | 699 | 23.87295 | 0.6339 | 0 | 489 | 2226.455 | 21.96317 | 0.8122 | 1 | 191 | 783.8820 | 24.365914 | 0.7799 | 1 | 0 | 2710 | 0.0000000 | 0.09479 | 0 | 398 | 2927.519 | 13.59513 | 0.2511 | 0 | 1312 | 13 | 0.9908537 | 0.3111 | 0 | 400 | 30.4878049 | 0.9557 | 1 | 6 | 1176 | 0.5102041 | 0.2590 | 0 | 81 | 1176.202 | 6.886570 | 0.6115 | 0 | 7 | 2928 | 0.2390710 | 0.4961 | 0 | 2.22540 | 0.4183 | 0 | 2.99129 | 0.7634 | 2 | 0.2511 | 0.2490 | 0 | 2.6334 | 0.5496 | 1 | 8.10119 | 0.5207 | 3 | Yes | 0 | 0 | \$0 |
| 01003010500 | 01 | 003 | 010500 | AL | Alabama | Baldwin County | 3 | South Region | 6 | East South Central Division | 4230 | 1779 | 1425 | 498 | 3443 | 14.46413 | 0.3337 | 0 | 166 | 1625 | 10.215385 | 0.71790 | 0 | 151 | 1069 | 14.12535 | 0.04638 | 0 | 196 | 356 | 55.05618 | 0.73830 | 0 | 347 | 1425 | 24.35088 | 0.17010 | 0 | 707 | 2945 | 24.00679 | 0.7967 | 1 | 528 | 4001 | 13.19670 | 0.5005 | 0 | 619 | 14.63357 | 0.6436 | 0 | 790 | 18.67612 | 0.1937 | 0 | 536 | 3096 | 17.31266 | 0.6572 | 0 | 165 | 920 | 17.934783 | 0.6102 | 0 | 20 | 4021 | 0.4973887 | 0.32320 | 0 | 754 | 4230 | 17.82506 | 0.4023 | 0 | 1779 | 97 | 5.4525014 | 0.5525 | 0 | 8 | 0.4496908 | 0.4600 | 0 | 63 | 1425 | 4.421053 | 0.7762 | 1 | 90 | 1425 | 6.315790 | 0.5691 | 0 | 787 | 4230 | 18.6052 | 0.9649 | 1 | 2.51890 | 0.5121 | 1 | 2.42790 | 0.4539 | 0 | 0.4023 | 0.3986 | 0 | 3.3227 | 0.8628 | 2 | 8.67180 | 0.6054 | 3 | 5877 | 1975 | 1836 | 820 | 5244 | 15.63692 | 0.3902 | 0 | 90 | 2583 | 3.484321 | 0.3361 | 0 | 159 | 1345 | 11.821561 | 0.10530 | 0 | 139 | 491 | 28.30957 | 0.1924 | 0 | 298 | 1836 | 16.23094 | 0.09053 | 0 | 570 | 4248 | 13.41808 | 0.6669 | 0 | 353 | 5247 | 6.727654 | 0.4924 | 0 | 1109 | 18.870172 | 0.6645 | 0 | 1144 | 19.46571 | 0.3411 | 0 | 717 | 4102.545 | 17.47696 | 0.6332 | 0 | 103 | 1286.1180 | 8.008596 | 0.2341 | 0 | 0 | 5639 | 0.0000000 | 0.09479 | 0 | 868 | 5877.481 | 14.76823 | 0.2709 | 0 | 1975 | 26 | 1.3164557 | 0.3359 | 0 | 45 | 2.2784810 | 0.6271 | 0 | 9 | 1836 | 0.4901961 | 0.2540 | 0 | 116 | 1835.798 | 6.318779 | 0.5811 | 0 | 633 | 5877 | 10.7708014 | 0.9507 | 1 | 1.97613 | 0.3410 | 0 | 1.96769 | 0.1961 | 0 | 0.2709 | 0.2686 | 0 | 2.7488 | 0.6077 | 1 | 6.96352 | 0.3406 | 1 | Yes | 0 | 0 | \$0 |
| 01003010600 | 01 | 003 | 010600 | AL | Alabama | Baldwin County | 3 | South Region | 6 | East South Central Division | 3724 | 1440 | 1147 | 1973 | 3724 | 52.98067 | 0.9342 | 1 | 142 | 1439 | 9.867964 | 0.69680 | 0 | 235 | 688 | 34.15698 | 0.62950 | 0 | 187 | 459 | 40.74074 | 0.40290 | 0 | 422 | 1147 | 36.79163 | 0.55150 | 0 | 497 | 1876 | 26.49254 | 0.8354 | 1 | 511 | 3661 | 13.95794 | 0.5334 | 0 | 246 | 6.60580 | 0.1481 | 0 | 1256 | 33.72718 | 0.9305 | 1 | 496 | 2522 | 19.66693 | 0.7587 | 1 | 274 | 838 | 32.696897 | 0.8779 | 1 | 32 | 3479 | 0.9198045 | 0.42810 | 0 | 2606 | 3724 | 69.97852 | 0.8184 | 1 | 1440 | 21 | 1.4583333 | 0.3683 | 0 | 321 | 22.2916667 | 0.9036 | 1 | 97 | 1147 | 8.456844 | 0.8956 | 1 | 167 | 1147 | 14.559721 | 0.8209 | 1 | 0 | 3724 | 0.0000 | 0.3640 | 0 | 3.55130 | 0.7859 | 2 | 3.14330 | 0.8145 | 3 | 0.8184 | 0.8108 | 1 | 3.3524 | 0.8725 | 3 | 10.86540 | 0.8550 | 9 | 4115 | 1534 | 1268 | 1676 | 3997 | 41.93145 | 0.8814 | 1 | 294 | 1809 | 16.252073 | 0.9674 | 1 | 341 | 814 | 41.891892 | 0.94320 | 1 | 204 | 454 | 44.93392 | 0.5438 | 0 | 545 | 1268 | 42.98107 | 0.83620 | 1 | 624 | 2425 | 25.73196 | 0.9002 | 1 | 994 | 4115 | 24.155529 | 0.9602 | 1 | 642 | 15.601458 | 0.4841 | 0 | 1126 | 27.36331 | 0.8175 | 1 | 568 | 2989.000 | 19.00301 | 0.7045 | 0 | 212 | 715.0000 | 29.650350 | 0.8592 | 1 | 56 | 3825 | 1.4640523 | 0.53120 | 0 | 2715 | 4115.000 | 65.97813 | 0.7732 | 1 | 1534 | 0 | 0.0000000 | 0.1079 | 0 | 529 | 34.4850065 | 0.9685 | 1 | 101 | 1268 | 7.9652997 | 0.8795 | 1 | 89 | 1268.000 | 7.018927 | 0.6184 | 0 | 17 | 4115 | 0.4131227 | 0.5707 | 0 | 4.54540 | 0.9754 | 5 | 3.39650 | 0.9081 | 2 | 0.7732 | 0.7667 | 1 | 3.1450 | 0.7858 | 2 | 11.86010 | 0.9520 | 10 | Yes | 0 | 0 | \$0 |
Filter Data to Revevant Time-Frame
# Find count of NMTC projects after 2010
# Remove all tracts that do not have SVI flag counts for 2010
# Remove all tracts that do not have SVI flag counts for 2020
# Remove all tracts that had an NMTC project before 2010
svi_divisional_nmtc <-
  left_join(svi_divisional_nmtc_eligible, nmtc_awards_post2010, join_by("GEOID_2010_trt" == "GEOID10")) %>%
  mutate(post10_nmtc_project_cnt = if_else(is.na(post10_nmtc_project_cnt), 0, post10_nmtc_project_cnt)) %>%
  mutate(post10_nmtc_dollars = if_else(is.na(post10_nmtc_dollars), 0, post10_nmtc_dollars))%>%
  mutate(post10_nmtc_dollars_formatted = if_else(is.na(post10_nmtc_dollars_formatted), "$0", post10_nmtc_dollars_formatted)) %>%
  mutate(nmtc_flag = if_else(post10_nmtc_project_cnt > 0, 1, 0)) %>%
  filter(!is.na(F_TOTAL_10)) %>%
  filter(!is.na(F_TOTAL_20)) %>%
  filter(pre10_nmtc_project_cnt < 1)

svi_divisional_nmtc %>% head() %>% kbl() %>% kable_styling() %>% scroll_box(width = "100%")
| GEOID_2010_trt | FIPS_st | FIPS_county | FIPS_tract | state | state_name | county | region_number | region | division_number | division | E_TOTPOP_10 | E_HU_10 | E_HH_10 | E_POV150_10 | ET_POVSTATUS_10 | EP_POV150_10 | EPL_POV150_10 | F_POV150_10 | E_UNEMP_10 | ET_EMPSTATUS_10 | EP_UNEMP_10 | EPL_UNEMP_10 | F_UNEMP_10 | E_HBURD_OWN_10 | ET_HOUSINGCOST_OWN_10 | EP_HBURD_OWN_10 | EPL_HBURD_OWN_10 | F_HBURD_OWN_10 | E_HBURD_RENT_10 | ET_HOUSINGCOST_RENT_10 | EP_HBURD_RENT_10 | EPL_HBURD_RENT_10 | F_HBURD_RENT_10 | E_HBURD_10 | ET_HOUSINGCOST_10 | EP_HBURD_10 | EPL_HBURD_10 | F_HBURD_10 | E_NOHSDP_10 | ET_EDSTATUS_10 | EP_NOHSDP_10 | EPL_NOHSDP_10 | F_NOHSDP_10 | E_UNINSUR_12 | ET_INSURSTATUS_12 | EP_UNINSUR_12 | EPL_UNINSUR_12 | F_UNINSUR_12 | E_AGE65_10 | EP_AGE65_10 | EPL_AGE65_10 | F_AGE65_10 | E_AGE17_10 | EP_AGE17_10 | EPL_AGE17_10 | F_AGE17_10 | E_DISABL_12 | ET_DISABLSTATUS_12 | EP_DISABL_12 | EPL_DISABL_12 | F_DISABL_12 | E_SNGPNT_10 | ET_FAMILIES_10 | EP_SNGPNT_10 | EPL_SNGPNT_10 | F_SNGPNT_10 | E_LIMENG_10 | ET_POPAGE5UP_10 | EP_LIMENG_10 | EPL_LIMENG_10 | F_LIMENG_10 | E_MINRTY_10 | ET_POPETHRACE_10 | EP_MINRTY_10 | EPL_MINRTY_10 | F_MINRTY_10 | E_STRHU_10 | E_MUNIT_10 | EP_MUNIT_10 | EPL_MUNIT_10 | F_MUNIT_10 | E_MOBILE_10 | EP_MOBILE_10 | EPL_MOBILE_10 | F_MOBILE_10 | E_CROWD_10 | ET_OCCUPANTS_10 | EP_CROWD_10 | EPL_CROWD_10 | F_CROWD_10 | E_NOVEH_10 | ET_KNOWNVEH_10 | EP_NOVEH_10 | EPL_NOVEH_10 | F_NOVEH_10 | E_GROUPQ_10 | ET_HHTYPE_10 | EP_GROUPQ_10 | EPL_GROUPQ_10 | F_GROUPQ_10 | SPL_THEME1_10 | RPL_THEME1_10 | F_THEME1_10 | SPL_THEME2_10 | RPL_THEME2_10 | F_THEME2_10 | SPL_THEME3_10 | RPL_THEME3_10 | F_THEME3_10 | SPL_THEME4_10 | RPL_THEME4_10 | F_THEME4_10 | SPL_THEMES_10 | RPL_THEMES_10 | F_TOTAL_10 | E_TOTPOP_20 | E_HU_20 | E_HH_20 | E_POV150_20 | ET_POVSTATUS_20 | EP_POV150_20 | EPL_POV150_20 | F_POV150_20 | E_UNEMP_20 | ET_EMPSTATUS_20 | EP_UNEMP_20 | EPL_UNEMP_20 | F_UNEMP_20 | E_HBURD_OWN_20 | ET_HOUSINGCOST_OWN_20 | EP_HBURD_OWN_20 | EPL_HBURD_OWN_20 | F_HBURD_OWN_20 | E_HBURD_RENT_20 | ET_HOUSINGCOST_RENT_20 | EP_HBURD_RENT_20 | EPL_HBURD_RENT_20 | F_HBURD_RENT_20 | E_HBURD_20 | ET_HOUSINGCOST_20 | EP_HBURD_20 | EPL_HBURD_20 | F_HBURD_20 | E_NOHSDP_20 | ET_EDSTATUS_20 | EP_NOHSDP_20 | EPL_NOHSDP_20 | F_NOHSDP_20 | E_UNINSUR_20 | ET_INSURSTATUS_20 | EP_UNINSUR_20 | EPL_UNINSUR_20 | F_UNINSUR_20 | E_AGE65_20 | EP_AGE65_20 | EPL_AGE65_20 | F_AGE65_20 | E_AGE17_20 | EP_AGE17_20 | EPL_AGE17_20 | F_AGE17_20 | E_DISABL_20 | ET_DISABLSTATUS_20 | EP_DISABL_20 | EPL_DISABL_20 | F_DISABL_20 | E_SNGPNT_20 | ET_FAMILIES_20 | EP_SNGPNT_20 | EPL_SNGPNT_20 | F_SNGPNT_20 | E_LIMENG_20 | ET_POPAGE5UP_20 | EP_LIMENG_20 | EPL_LIMENG_20 | F_LIMENG_20 | E_MINRTY_20 | ET_POPETHRACE_20 | EP_MINRTY_20 | EPL_MINRTY_20 | F_MINRTY_20 | E_STRHU_20 | E_MUNIT_20 | EP_MUNIT_20 | EPL_MUNIT_20 | F_MUNIT_20 | E_MOBILE_20 | EP_MOBILE_20 | EPL_MOBILE_20 | F_MOBILE_20 | E_CROWD_20 | ET_OCCUPANTS_20 | EP_CROWD_20 | EPL_CROWD_20 | F_CROWD_20 | E_NOVEH_20 | ET_KNOWNVEH_20 | EP_NOVEH_20 | EPL_NOVEH_20 | F_NOVEH_20 | E_GROUPQ_20 | ET_HHTYPE_20 | EP_GROUPQ_20 | EPL_GROUPQ_20 | F_GROUPQ_20 | SPL_THEME1_20 | RPL_THEME1_20 | F_THEME1_20 | SPL_THEME2_20 | RPL_THEME2_20 | F_THEME2_20 | SPL_THEME3_20 | RPL_THEME3_20 | F_THEME3_20 | SPL_THEME4_20 | RPL_THEME4_20 | F_THEME4_20 | SPL_THEMES_20 | RPL_THEMES_20 | F_TOTAL_20 | nmtc_eligibility | pre10_nmtc_project_cnt | pre10_nmtc_dollars | pre10_nmtc_dollars_formatted | post10_nmtc_project_cnt | post10_nmtc_dollars | post10_nmtc_dollars_formatted | nmtc_flag |
|---|---|---|---|---|---|---|---|---|---|---|---|---|---|---|---|---|---|---|---|---|---|---|---|---|---|---|---|---|---|---|---|---|---|---|---|---|---|---|---|---|---|---|---|---|---|---|---|---|---|---|---|---|---|---|---|---|---|---|---|---|---|---|---|---|---|---|---|---|---|---|---|---|---|---|---|---|---|---|---|---|---|---|---|---|---|---|---|---|---|---|---|---|---|---|---|---|---|---|---|---|---|---|---|---|---|---|---|---|---|---|---|---|---|---|---|---|---|---|---|---|---|---|---|---|---|---|---|---|---|---|---|---|---|---|---|---|---|---|---|---|---|---|---|---|---|---|---|---|---|---|---|---|---|---|---|---|---|---|---|---|---|---|---|---|---|---|---|---|---|---|---|---|---|---|---|---|---|---|---|---|---|---|---|---|---|---|---|---|---|---|---|---|---|---|---|---|---|---|---|---|---|---|---|---|---|---|---|---|---|---|---|---|---|---|---|---|---|---|---|---|---|---|---|---|---|---|---|---|
| 10001040201 | 10 | 001 | 040201 | DE | Delaware | Kent County | 3 | South Region | 5 | South Atlantic Division | 5208 | 1953 | 1809 | 850 | 5183 | 16.399769 | 0.3672 | 0 | 147 | 2550 | 5.764706 | 0.3364 | 0 | 385 | 1323 | 29.10053 | 0.45810 | 0 | 222 | 486 | 45.67901 | 0.49650 | 0 | 607 | 1809 | 33.55445 | 0.4431 | 0 | 459 | 3090 | 14.8543689 | 0.5386 | 0 | 435 | 5283 | 8.233958 | 0.19610 | 0 | 454 | 8.717358 | 0.256100 | 0 | 1588 | 30.491551 | 0.8927 | 1 | 537 | 3716 | 14.451023 | 0.4708 | 0 | 417 | 1343 | 31.04989 | 0.8599 | 1 | 69 | 4835 | 1.427094 | 0.5240 | 0 | 1881 | 5208 | 36.11751 | 0.5689 | 0 | 1953 | 87 | 4.454685 | 0.5392 | 0 | 148 | 7.578085 | 0.6495 | 0 | 39 | 1809 | 2.155887 | 0.6471 | 0 | 121 | 1809 | 6.688778 | 0.6124 | 0 | 0 | 5208 | 0.0000000 | 0.3814 | 0 | 1.88140 | 0.3053 | 0 | 3.003500 | 0.7667 | 2 | 0.5689 | 0.5614 | 0 | 2.8296 | 0.6516 | 0 | 8.283400 | 0.5452 | 2 | 4770 | 1906 | 1732 | 755 | 4692 | 16.09122 | 0.3758 | 0 | 92 | 2500 | 3.680000 | 0.3633 | 0 | 197 | 1184 | 16.638513 | 0.280400 | 0 | 235 | 548 | 42.88321 | 0.4609 | 0 | 432 | 1732 | 24.94226 | 0.3622 | 0 | 251 | 3100 | 8.096774 | 0.4085 | 0 | 228 | 4770 | 4.779874 | 0.21160 | 0 | 549 | 11.509434 | 0.23290 | 0 | 1352 | 28.343816 | 0.88650 | 1 | 490 | 3418.125 | 14.335346 | 0.4309 | 0 | 328 | 1263.2064 | 25.965669 | 0.8111 | 1 | 0 | 4526 | 0.0000000 | 0.09987 | 0 | 1875 | 4769.908 | 39.30893 | 0.5372 | 0 | 1906 | 72 | 3.7775446 | 0.4876 | 0 | 128 | 6.7156348 | 0.6610 | 0 | 10 | 1732 | 0.5773672 | 0.3165 | 0 | 32 | 1731.7111 | 1.847883 | 0.2303 | 0 | 0 | 4770 | 0.0000000 | 0.2111 | 0 | 1.72140 | 0.2531 | 0 | 2.46127 | 0.45940 | 2 | 0.5372 | 0.5306 | 0 | 1.9065 | 0.2183 | 0 | 6.62637 | 0.2829 | 2 | Yes | 0 | 0 | \$0 | 0 | 0 | \$0 | 0 |
| 10001040502 | 10 | 001 | 040502 | DE | Delaware | Kent County | 3 | South Region | 5 | South Atlantic Division | 2087 | 921 | 921 | 192 | 2087 | 9.199808 | 0.1738 | 0 | 35 | 722 | 4.847645 | 0.2495 | 0 | 281 | 700 | 40.14286 | 0.78190 | 1 | 64 | 221 | 28.95928 | 0.17110 | 0 | 345 | 921 | 37.45928 | 0.5710 | 0 | 284 | 1546 | 18.3699871 | 0.6484 | 0 | 119 | 2121 | 5.610561 | 0.10710 | 0 | 518 | 24.820316 | 0.906800 | 1 | 480 | 22.999521 | 0.4910 | 0 | 328 | 1527 | 21.480026 | 0.7959 | 1 | 173 | 680 | 25.44118 | 0.7769 | 1 | 100 | 1998 | 5.005005 | 0.7960 | 1 | 560 | 2087 | 26.83277 | 0.4524 | 0 | 921 | 0 | 0.000000 | 0.1428 | 0 | 273 | 29.641694 | 0.8785 | 1 | 0 | 921 | 0.000000 | 0.1488 | 0 | 30 | 921 | 3.257329 | 0.3600 | 0 | 0 | 2087 | 0.0000000 | 0.3814 | 0 | 1.74980 | 0.2670 | 0 | 3.766600 | 0.9666 | 4 | 0.4524 | 0.4464 | 0 | 1.9115 | 0.2071 | 1 | 7.880300 | 0.4785 | 5 | 2555 | 1030 | 954 | 565 | 2555 | 22.11350 | 0.5385 | 0 | 135 | 1154 | 11.698440 | 0.9175 | 1 | 144 | 691 | 20.839363 | 0.486500 | 0 | 168 | 262 | 64.12214 | 0.8894 | 1 | 312 | 953 | 32.73872 | 0.6259 | 0 | 192 | 1782 | 10.774411 | 0.5377 | 0 | 198 | 2519 | 7.860262 | 0.40160 | 0 | 519 | 20.313112 | 0.68510 | 0 | 664 | 25.988258 | 0.79390 | 1 | 341 | 1854.295 | 18.389741 | 0.6427 | 0 | 195 | 614.6519 | 31.725274 | 0.8870 | 1 | 75 | 2351 | 3.1901319 | 0.72360 | 0 | 1215 | 2555.353 | 47.54725 | 0.6272 | 0 | 1030 | 61 | 5.9223301 | 0.5514 | 0 | 170 | 16.5048544 | 0.7844 | 1 | 58 | 954 | 6.0796646 | 0.8947 | 1 | 83 | 953.5886 | 8.703963 | 0.7220 | 0 | 0 | 2555 | 0.0000000 | 0.2111 | 0 | 3.02120 | 0.6565 | 1 | 3.73230 | 0.96800 | 2 | 0.6272 | 0.6195 | 0 | 3.1636 | 0.7893 | 2 | 10.54430 | 0.8433 | 5 | Yes | 0 | 0 | \$0 | 0 | 0 | \$0 | 0 |
| 10001040900 | 10 | 001 | 040900 | DE | Delaware | Kent County | 3 | South Region | 5 | South Atlantic Division | 2363 | 1205 | 1007 | 526 | 1741 | 30.212522 | 0.7006 | 0 | 171 | 1089 | 15.702479 | 0.9032 | 1 | 98 | 362 | 27.07182 | 0.37770 | 0 | 258 | 645 | 40.00000 | 0.36590 | 0 | 356 | 1007 | 35.35253 | 0.5041 | 0 | 248 | 1416 | 17.5141243 | 0.6235 | 0 | 118 | 2479 | 4.759984 | 0.08169 | 0 | 509 | 21.540415 | 0.863300 | 1 | 168 | 7.109606 | 0.0386 | 0 | 428 | 1427 | 29.992992 | 0.9611 | 1 | 44 | 387 | 11.36951 | 0.3400 | 0 | 50 | 2349 | 2.128565 | 0.6157 | 0 | 727 | 2363 | 30.76598 | 0.5048 | 0 | 1205 | 378 | 31.369295 | 0.8688 | 1 | 0 | 0.000000 | 0.1809 | 0 | 0 | 1007 | 0.000000 | 0.1488 | 0 | 256 | 1007 | 25.422046 | 0.9457 | 1 | 622 | 2363 | 26.3224714 | 0.9741 | 1 | 2.81309 | 0.5851 | 1 | 2.818700 | 0.6717 | 2 | 0.5048 | 0.4981 | 0 | 3.1183 | 0.7840 | 3 | 9.254890 | 0.6833 | 6 | 2373 | 1114 | 1028 | 574 | 1679 | 34.18702 | 0.7904 | 1 | 19 | 1034 | 1.837524 | 0.1211 | 0 | 26 | 313 | 8.306709 | 0.029920 | 0 | 335 | 715 | 46.85315 | 0.5540 | 0 | 361 | 1028 | 35.11673 | 0.6908 | 0 | 224 | 1292 | 17.337461 | 0.7807 | 1 | 78 | 2250 | 3.466667 | 0.13250 | 0 | 501 | 21.112516 | 0.71690 | 0 | 208 | 8.765276 | 0.05851 | 0 | 391 | 1505.000 | 25.980066 | 0.9018 | 1 | 29 | 220.0000 | 13.181818 | 0.4476 | 0 | 7 | 2268 | 0.3086420 | 0.28740 | 0 | 974 | 2373.000 | 41.04509 | 0.5571 | 0 | 1114 | 476 | 42.7289048 | 0.9104 | 1 | 0 | 0.0000000 | 0.1800 | 0 | 5 | 1028 | 0.4863813 | 0.2927 | 0 | 248 | 1028.0000 | 24.124514 | 0.9466 | 1 | 678 | 2373 | 28.5714286 | 0.9778 | 1 | 2.51550 | 0.4976 | 2 | 2.41221 | 0.42860 | 1 | 0.5571 | 0.5503 | 0 | 3.3075 | 0.8411 | 3 | 8.79231 | 0.6264 | 6 | Yes | 0 | 0 | \$0 | 0 | 0 | \$0 | 0 |
| 10001041000 | 10 | 001 | 041000 | DE | Delaware | Kent County | 3 | South Region | 5 | South Atlantic Division | 5577 | 2570 | 2369 | 1291 | 5577 | 23.148646 | 0.5435 | 0 | 144 | 2702 | 5.329386 | 0.2938 | 0 | 468 | 1312 | 35.67073 | 0.67500 | 0 | 135 | 1057 | 12.77200 | 0.04274 | 0 | 603 | 2369 | 25.45378 | 0.1769 | 0 | 759 | 3504 | 21.6609589 | 0.7311 | 0 | 655 | 5999 | 10.918486 | 0.29800 | 0 | 594 | 10.650888 | 0.371200 | 0 | 1487 | 26.663080 | 0.7247 | 0 | 683 | 4587 | 14.889906 | 0.4947 | 0 | 364 | 1466 | 24.82947 | 0.7646 | 1 | 188 | 5105 | 3.682664 | 0.7342 | 0 | 3384 | 5577 | 60.67778 | 0.7785 | 1 | 2570 | 479 | 18.638132 | 0.7741 | 1 | 567 | 22.062257 | 0.8159 | 1 | 91 | 2369 | 3.841283 | 0.8132 | 1 | 221 | 2369 | 9.328831 | 0.7266 | 0 | 9 | 5577 | 0.1613771 | 0.7632 | 1 | 2.04330 | 0.3511 | 0 | 3.089400 | 0.8041 | 1 | 0.7785 | 0.7682 | 1 | 3.8930 | 0.9705 | 4 | 9.804200 | 0.7522 | 6 | 6719 | 3107 | 2804 | 2006 | 6656 | 30.13822 | 0.7207 | 0 | 436 | 3058 | 14.257685 | 0.9556 | 1 | 299 | 1387 | 21.557318 | 0.521400 | 0 | 583 | 1417 | 41.14326 | 0.4216 | 0 | 882 | 2804 | 31.45506 | 0.5861 | 0 | 953 | 4915 | 19.389624 | 0.8333 | 1 | 509 | 6603 | 7.708617 | 0.39290 | 0 | 1221 | 18.172347 | 0.58640 | 0 | 1389 | 20.672719 | 0.47220 | 0 | 1393 | 5214.000 | 26.716532 | 0.9150 | 1 | 661 | 1752.0000 | 37.728310 | 0.9336 | 1 | 340 | 6411 | 5.3033848 | 0.82180 | 1 | 4068 | 6719.048 | 60.54429 | 0.7409 | 0 | 3107 | 469 | 15.0949469 | 0.7136 | 0 | 586 | 18.8606373 | 0.8099 | 1 | 54 | 2804 | 1.9258203 | 0.5840 | 0 | 253 | 2804.0000 | 9.022825 | 0.7342 | 0 | 70 | 6719 | 1.0418217 | 0.7345 | 0 | 3.48860 | 0.7870 | 2 | 3.72900 | 0.96760 | 3 | 0.7409 | 0.7319 | 0 | 3.5762 | 0.9178 | 1 | 11.53470 | 0.9313 | 6 | Yes | 0 | 0 | \$0 | 0 | 0 | \$0 | 0 |
| 10001041100 | 10 | 001 | 041100 | DE | Delaware | Kent County | 3 | South Region | 5 | South Atlantic Division | 2957 | 800 | 738 | 499 | 2555 | 19.530333 | 0.4511 | 0 | 44 | 845 | 5.207101 | 0.2813 | 0 | 0 | 8 | 0.00000 | 0.00257 | 0 | 395 | 730 | 54.10959 | 0.69280 | 0 | 395 | 738 | 53.52304 | 0.9155 | 1 | 11 | 1118 | 0.9838998 | 0.0213 | 0 | 65 | 2559 | 2.540055 | 0.02694 | 0 | 0 | 0.000000 | 0.003549 | 0 | 1198 | 40.514035 | 0.9944 | 1 | 117 | 1192 | 9.815436 | 0.2221 | 0 | 133 | 693 | 19.19192 | 0.6322 | 0 | 42 | 2551 | 1.646413 | 0.5567 | 0 | 720 | 2957 | 24.34900 | 0.4177 | 0 | 800 | 0 | 0.000000 | 0.1428 | 0 | 0 | 0.000000 | 0.1809 | 0 | 0 | 738 | 0.000000 | 0.1488 | 0 | 10 | 738 | 1.355014 | 0.1640 | 0 | 402 | 2957 | 13.5948597 | 0.9492 | 1 | 1.69614 | 0.2527 | 1 | 2.408949 | 0.4377 | 1 | 0.4177 | 0.4122 | 0 | 1.5857 | 0.1097 | 1 | 6.108489 | 0.2207 | 3 | 3881 | 1350 | 1322 | 1031 | 3618 | 28.49641 | 0.6874 | 0 | 58 | 877 | 6.613455 | 0.6891 | 0 | 0 | 3 | 0.000000 | 0.002567 | 0 | 758 | 1319 | 57.46778 | 0.7890 | 1 | 758 | 1322 | 57.33737 | 0.9772 | 1 | 41 | 1801 | 2.276513 | 0.0857 | 0 | 33 | 2762 | 1.194786 | 0.02847 | 0 | 64 | 1.649059 | 0.01027 | 0 | 1291 | 33.264623 | 0.97230 | 1 | 129 | 1470.497 | 8.772546 | 0.1457 | 0 | 113 | 1156.7160 | 9.769036 | 0.3067 | 0 | 4 | 3373 | 0.1185888 | 0.22310 | 0 | 1672 | 3881.437 | 43.07683 | 0.5797 | 0 | 1350 | 9 | 0.6666667 | 0.3180 | 0 | 10 | 0.7407407 | 0.4343 | 0 | 1 | 1322 | 0.0756430 | 0.2359 | 0 | 18 | 1321.8616 | 1.361716 | 0.1744 | 0 | 263 | 3881 | 6.7766040 | 0.9251 | 1 | 2.46787 | 0.4818 | 1 | 1.65807 | 0.08121 | 1 | 0.5797 | 0.5726 | 0 | 2.0877 | 0.2866 | 1 | 6.79334 | 0.3059 | 3 | Yes | 0 | 0 | \$0 | 0 | 0 | \$0 | 0 |
| 10001041200 | 10 | 001 | 041200 | DE | Delaware | Kent County | 3 | South Region | 5 | South Atlantic Division | 4723 | 1880 | 1742 | 778 | 4710 | 16.518047 | 0.3700 | 0 | 193 | 2264 | 8.524735 | 0.5848 | 0 | 481 | 1168 | 41.18151 | 0.80360 | 1 | 257 | 574 | 44.77352 | 0.47360 | 0 | 738 | 1742 | 42.36510 | 0.7087 | 0 | 573 | 3071 | 18.6584175 | 0.6563 | 0 | 471 | 3937 | 11.963424 | 0.34310 | 0 | 600 | 12.703790 | 0.504200 | 0 | 1257 | 26.614440 | 0.7223 | 0 | 583 | 3036 | 19.202899 | 0.7085 | 0 | 240 | 1183 | 20.28740 | 0.6645 | 0 | 190 | 4378 | 4.339881 | 0.7670 | 1 | 2933 | 4723 | 62.10036 | 0.7871 | 1 | 1880 | 327 | 17.393617 | 0.7606 | 1 | 353 | 18.776596 | 0.7841 | 1 | 41 | 1742 | 2.353616 | 0.6746 | 0 | 92 | 1742 | 5.281286 | 0.5288 | 0 | 0 | 4723 | 0.0000000 | 0.3814 | 0 | 2.66290 | 0.5376 | 0 | 3.366500 | 0.8969 | 1 | 0.7871 | 0.7767 | 1 | 3.1295 | 0.7889 | 2 | 9.946000 | 0.7681 | 4 | 4135 | 1851 | 1712 | 870 | 4076 | 21.34446 | 0.5206 | 0 | 180 | 1879 | 9.579564 | 0.8567 | 1 | 384 | 1230 | 31.219512 | 0.844800 | 1 | 226 | 482 | 46.88797 | 0.5550 | 0 | 610 | 1712 | 35.63084 | 0.7027 | 0 | 286 | 2785 | 10.269300 | 0.5146 | 0 | 204 | 4124 | 4.946654 | 0.22200 | 0 | 755 | 18.258767 | 0.59080 | 0 | 1067 | 25.804111 | 0.78410 | 1 | 571 | 3057.653 | 18.674456 | 0.6593 | 0 | 375 | 1138.2043 | 32.946633 | 0.8989 | 1 | 26 | 3953 | 0.6577283 | 0.38940 | 0 | 2299 | 4134.641 | 55.60337 | 0.6982 | 0 | 1851 | 175 | 9.4543490 | 0.6291 | 0 | 438 | 23.6628849 | 0.8514 | 1 | 5 | 1712 | 0.2920561 | 0.2552 | 0 | 143 | 1712.2269 | 8.351697 | 0.7088 | 0 | 20 | 4135 | 0.4836759 | 0.6479 | 0 | 2.81660 | 0.5950 | 1 | 3.32250 | 0.89620 | 2 | 0.6982 | 0.6897 | 0 | 3.0924 | 0.7625 | 1 | 9.92970 | 0.7729 | 4 | Yes | 0 | 0 | \$0 | 0 | 0 | \$0 | 0 |
# Find count of NMTC projects after 2010
# Remove all tracts that do not have SVI flag counts for 2010
# Remove all tracts that do not have SVI flag counts for 2020
# Remove all tracts that had an NMTC project before 2010
svi_national_nmtc <-
  left_join(svi_national_nmtc_eligible, nmtc_awards_post2010, join_by("GEOID_2010_trt" == "GEOID10")) %>%
  mutate(post10_nmtc_project_cnt = if_else(is.na(post10_nmtc_project_cnt), 0, post10_nmtc_project_cnt)) %>%
  mutate(post10_nmtc_dollars = if_else(is.na(post10_nmtc_dollars), 0, post10_nmtc_dollars))%>%
  mutate(post10_nmtc_dollars_formatted = if_else(is.na(post10_nmtc_dollars_formatted), "$0", post10_nmtc_dollars_formatted)) %>%
  mutate(nmtc_flag = if_else(post10_nmtc_project_cnt > 0, 1, 0)) %>%
  filter(!is.na(F_TOTAL_10)) %>%
  filter(!is.na(F_TOTAL_20)) %>%
  filter(pre10_nmtc_project_cnt < 1)

svi_national_nmtc %>% head() %>% kbl() %>% kable_styling() %>% scroll_box(width = "100%")
| GEOID_2010_trt | FIPS_st | FIPS_county | FIPS_tract | state | state_name | county | region_number | region | division_number | division | E_TOTPOP_10 | E_HU_10 | E_HH_10 | E_POV150_10 | ET_POVSTATUS_10 | EP_POV150_10 | EPL_POV150_10 | F_POV150_10 | E_UNEMP_10 | ET_EMPSTATUS_10 | EP_UNEMP_10 | EPL_UNEMP_10 | F_UNEMP_10 | E_HBURD_OWN_10 | ET_HOUSINGCOST_OWN_10 | EP_HBURD_OWN_10 | EPL_HBURD_OWN_10 | F_HBURD_OWN_10 | E_HBURD_RENT_10 | ET_HOUSINGCOST_RENT_10 | EP_HBURD_RENT_10 | EPL_HBURD_RENT_10 | F_HBURD_RENT_10 | E_HBURD_10 | ET_HOUSINGCOST_10 | EP_HBURD_10 | EPL_HBURD_10 | F_HBURD_10 | E_NOHSDP_10 | ET_EDSTATUS_10 | EP_NOHSDP_10 | EPL_NOHSDP_10 | F_NOHSDP_10 | E_UNINSUR_12 | ET_INSURSTATUS_12 | EP_UNINSUR_12 | EPL_UNINSUR_12 | F_UNINSUR_12 | E_AGE65_10 | EP_AGE65_10 | EPL_AGE65_10 | F_AGE65_10 | E_AGE17_10 | EP_AGE17_10 | EPL_AGE17_10 | F_AGE17_10 | E_DISABL_12 | ET_DISABLSTATUS_12 | EP_DISABL_12 | EPL_DISABL_12 | F_DISABL_12 | E_SNGPNT_10 | ET_FAMILIES_10 | EP_SNGPNT_10 | EPL_SNGPNT_10 | F_SNGPNT_10 | E_LIMENG_10 | ET_POPAGE5UP_10 | EP_LIMENG_10 | EPL_LIMENG_10 | F_LIMENG_10 | E_MINRTY_10 | ET_POPETHRACE_10 | EP_MINRTY_10 | EPL_MINRTY_10 | F_MINRTY_10 | E_STRHU_10 | E_MUNIT_10 | EP_MUNIT_10 | EPL_MUNIT_10 | F_MUNIT_10 | E_MOBILE_10 | EP_MOBILE_10 | EPL_MOBILE_10 | F_MOBILE_10 | E_CROWD_10 | ET_OCCUPANTS_10 | EP_CROWD_10 | EPL_CROWD_10 | F_CROWD_10 | E_NOVEH_10 | ET_KNOWNVEH_10 | EP_NOVEH_10 | EPL_NOVEH_10 | F_NOVEH_10 | E_GROUPQ_10 | ET_HHTYPE_10 | EP_GROUPQ_10 | EPL_GROUPQ_10 | F_GROUPQ_10 | SPL_THEME1_10 | RPL_THEME1_10 | F_THEME1_10 | SPL_THEME2_10 | RPL_THEME2_10 | F_THEME2_10 | SPL_THEME3_10 | RPL_THEME3_10 | F_THEME3_10 | SPL_THEME4_10 | RPL_THEME4_10 | F_THEME4_10 | SPL_THEMES_10 | RPL_THEMES_10 | F_TOTAL_10 | E_TOTPOP_20 | E_HU_20 | E_HH_20 | E_POV150_20 | ET_POVSTATUS_20 | EP_POV150_20 | EPL_POV150_20 | F_POV150_20 | E_UNEMP_20 | ET_EMPSTATUS_20 | EP_UNEMP_20 | EPL_UNEMP_20 | F_UNEMP_20 | E_HBURD_OWN_20 | ET_HOUSINGCOST_OWN_20 | EP_HBURD_OWN_20 | EPL_HBURD_OWN_20 | F_HBURD_OWN_20 | E_HBURD_RENT_20 | ET_HOUSINGCOST_RENT_20 | EP_HBURD_RENT_20 | EPL_HBURD_RENT_20 | F_HBURD_RENT_20 | E_HBURD_20 | ET_HOUSINGCOST_20 | EP_HBURD_20 | EPL_HBURD_20 | F_HBURD_20 | E_NOHSDP_20 | ET_EDSTATUS_20 | EP_NOHSDP_20 | EPL_NOHSDP_20 | F_NOHSDP_20 | E_UNINSUR_20 | ET_INSURSTATUS_20 | EP_UNINSUR_20 | EPL_UNINSUR_20 | F_UNINSUR_20 | E_AGE65_20 | EP_AGE65_20 | EPL_AGE65_20 | F_AGE65_20 | E_AGE17_20 | EP_AGE17_20 | EPL_AGE17_20 | F_AGE17_20 | E_DISABL_20 | ET_DISABLSTATUS_20 | EP_DISABL_20 | EPL_DISABL_20 | F_DISABL_20 | E_SNGPNT_20 | ET_FAMILIES_20 | EP_SNGPNT_20 | EPL_SNGPNT_20 | F_SNGPNT_20 | E_LIMENG_20 | ET_POPAGE5UP_20 | EP_LIMENG_20 | EPL_LIMENG_20 | F_LIMENG_20 | E_MINRTY_20 | ET_POPETHRACE_20 | EP_MINRTY_20 | EPL_MINRTY_20 | F_MINRTY_20 | E_STRHU_20 | E_MUNIT_20 | EP_MUNIT_20 | EPL_MUNIT_20 | F_MUNIT_20 | E_MOBILE_20 | EP_MOBILE_20 | EPL_MOBILE_20 | F_MOBILE_20 | E_CROWD_20 | ET_OCCUPANTS_20 | EP_CROWD_20 | EPL_CROWD_20 | F_CROWD_20 | E_NOVEH_20 | ET_KNOWNVEH_20 | EP_NOVEH_20 | EPL_NOVEH_20 | F_NOVEH_20 | E_GROUPQ_20 | ET_HHTYPE_20 | EP_GROUPQ_20 | EPL_GROUPQ_20 | F_GROUPQ_20 | SPL_THEME1_20 | RPL_THEME1_20 | F_THEME1_20 | SPL_THEME2_20 | RPL_THEME2_20 | F_THEME2_20 | SPL_THEME3_20 | RPL_THEME3_20 | F_THEME3_20 | SPL_THEME4_20 | RPL_THEME4_20 | F_THEME4_20 | SPL_THEMES_20 | RPL_THEMES_20 | F_TOTAL_20 | nmtc_eligibility | pre10_nmtc_project_cnt | pre10_nmtc_dollars | pre10_nmtc_dollars_formatted | post10_nmtc_project_cnt | post10_nmtc_dollars | post10_nmtc_dollars_formatted | nmtc_flag |
|---|---|---|---|---|---|---|---|---|---|---|---|---|---|---|---|---|---|---|---|---|---|---|---|---|---|---|---|---|---|---|---|---|---|---|---|---|---|---|---|---|---|---|---|---|---|---|---|---|---|---|---|---|---|---|---|---|---|---|---|---|---|---|---|---|---|---|---|---|---|---|---|---|---|---|---|---|---|---|---|---|---|---|---|---|---|---|---|---|---|---|---|---|---|---|---|---|---|---|---|---|---|---|---|---|---|---|---|---|---|---|---|---|---|---|---|---|---|---|---|---|---|---|---|---|---|---|---|---|---|---|---|---|---|---|---|---|---|---|---|---|---|---|---|---|---|---|---|---|---|---|---|---|---|---|---|---|---|---|---|---|---|---|---|---|---|---|---|---|---|---|---|---|---|---|---|---|---|---|---|---|---|---|---|---|---|---|---|---|---|---|---|---|---|---|---|---|---|---|---|---|---|---|---|---|---|---|---|---|---|---|---|---|---|---|---|---|---|---|---|---|---|---|---|---|---|---|---|---|
| 01001020200 | 01 | 001 | 020200 | AL | Alabama | Autauga County | 3 | South Region | 6 | East South Central Division | 2020 | 816 | 730 | 495 | 1992 | 24.84940 | 0.5954 | 0 | 68 | 834 | 8.153477 | 0.57540 | 0 | 49 | 439 | 11.16173 | 0.02067 | 0 | 105 | 291 | 36.08247 | 0.30190 | 0 | 154 | 730 | 21.09589 | 0.09312 | 0 | 339 | 1265 | 26.79842 | 0.8392 | 1 | 313 | 2012 | 15.55666 | 0.6000 | 0 | 204 | 10.09901 | 0.3419 | 0 | 597 | 29.55446 | 0.8192 | 1 | 359 | 1515 | 23.69637 | 0.8791 | 1 | 132 | 456 | 28.947368 | 0.8351 | 1 | 15 | 1890 | 0.7936508 | 0.40130 | 0 | 1243 | 2020 | 61.53465 | 0.7781 | 1 | 816 | 0 | 0.0000000 | 0.1224 | 0 | 34 | 4.1666667 | 0.6664 | 0 | 13 | 730 | 1.780822 | 0.5406 | 0 | 115 | 730 | 15.753425 | 0.8382 | 1 | 0 | 2020 | 0.0000 | 0.3640 | 0 | 2.70312 | 0.5665 | 1 | 3.27660 | 0.8614 | 3 | 0.7781 | 0.7709 | 1 | 2.5316 | 0.5047 | 1 | 9.28942 | 0.6832 | 6 | 1757 | 720 | 573 | 384 | 1511 | 25.41363 | 0.6427 | 0 | 29 | 717 | 4.044630 | 0.4132 | 0 | 33 | 392 | 8.418367 | 0.03542 | 0 | 116 | 181 | 64.08840 | 0.9086 | 1 | 149 | 573 | 26.00349 | 0.40410 | 0 | 139 | 1313 | 10.58644 | 0.5601 | 0 | 91 | 1533 | 5.936073 | 0.4343 | 0 | 284 | 16.163916 | 0.5169 | 0 | 325 | 18.49744 | 0.2851 | 0 | 164 | 1208.000 | 13.57616 | 0.4127 | 0 | 42 | 359.0000 | 11.699164 | 0.3998 | 0 | 0 | 1651 | 0.0000000 | 0.09479 | 0 | 1116 | 1757.000 | 63.51736 | 0.7591 | 1 | 720 | 3 | 0.4166667 | 0.2470 | 0 | 5 | 0.6944444 | 0.5106 | 0 | 9 | 573 | 1.5706806 | 0.4688 | 0 | 57 | 573.000 | 9.947644 | 0.7317 | 0 | 212 | 1757 | 12.0660216 | 0.9549 | 1 | 2.45440 | 0.4888 | 0 | 1.70929 | 0.1025 | 0 | 0.7591 | 0.7527 | 1 | 2.9130 | 0.6862 | 1 | 7.83579 | 0.4802 | 2 | Yes | 0 | 0 | \$0 | 0 | 0 | \$0 | 0 |
| 01001020700 | 01 | 001 | 020700 | AL | Alabama | Autauga County | 3 | South Region | 6 | East South Central Division | 2664 | 1254 | 1139 | 710 | 2664 | 26.65165 | 0.6328 | 0 | 29 | 1310 | 2.213741 | 0.05255 | 0 | 134 | 710 | 18.87324 | 0.13890 | 0 | 187 | 429 | 43.58974 | 0.47090 | 0 | 321 | 1139 | 28.18262 | 0.28130 | 0 | 396 | 1852 | 21.38229 | 0.7478 | 0 | 345 | 2878 | 11.98749 | 0.4459 | 0 | 389 | 14.60210 | 0.6417 | 0 | 599 | 22.48499 | 0.4007 | 0 | 510 | 2168 | 23.52399 | 0.8752 | 1 | 228 | 712 | 32.022472 | 0.8712 | 1 | 0 | 2480 | 0.0000000 | 0.09298 | 0 | 694 | 2664 | 26.05105 | 0.5138 | 0 | 1254 | 8 | 0.6379585 | 0.2931 | 0 | 460 | 36.6826156 | 0.9714 | 1 | 0 | 1139 | 0.000000 | 0.1238 | 0 | 125 | 1139 | 10.974539 | 0.7477 | 0 | 0 | 2664 | 0.0000 | 0.3640 | 0 | 2.16035 | 0.4069 | 0 | 2.88178 | 0.6997 | 2 | 0.5138 | 0.5090 | 0 | 2.5000 | 0.4882 | 1 | 8.05593 | 0.5185 | 3 | 3562 | 1313 | 1248 | 1370 | 3528 | 38.83220 | 0.8512 | 1 | 128 | 1562 | 8.194622 | 0.7935 | 1 | 168 | 844 | 19.905213 | 0.44510 | 0 | 237 | 404 | 58.66337 | 0.8359 | 1 | 405 | 1248 | 32.45192 | 0.60420 | 0 | 396 | 2211 | 17.91045 | 0.7857 | 1 | 444 | 3547 | 12.517620 | 0.7758 | 1 | 355 | 9.966311 | 0.1800 | 0 | 954 | 26.78271 | 0.7923 | 1 | 629 | 2593.000 | 24.25762 | 0.8730 | 1 | 171 | 797.0000 | 21.455458 | 0.7186 | 0 | 0 | 3211 | 0.0000000 | 0.09479 | 0 | 1009 | 3562.000 | 28.32678 | 0.4668 | 0 | 1313 | 14 | 1.0662605 | 0.3165 | 0 | 443 | 33.7395278 | 0.9663 | 1 | 73 | 1248 | 5.8493590 | 0.8211 | 1 | 17 | 1248.000 | 1.362180 | 0.1554 | 0 | 112 | 3562 | 3.1443010 | 0.8514 | 1 | 3.81040 | 0.8569 | 4 | 2.65869 | 0.5847 | 2 | 0.4668 | 0.4629 | 0 | 3.1107 | 0.7714 | 3 | 10.04659 | 0.7851 | 9 | Yes | 0 | 0 | \$0 | 0 | 0 | \$0 | 0 |
| 01001021100 | 01 | 001 | 021100 | AL | Alabama | Autauga County | 3 | South Region | 6 | East South Central Division | 3298 | 1502 | 1323 | 860 | 3298 | 26.07641 | 0.6211 | 0 | 297 | 1605 | 18.504673 | 0.94340 | 1 | 250 | 1016 | 24.60630 | 0.32070 | 0 | 74 | 307 | 24.10423 | 0.11920 | 0 | 324 | 1323 | 24.48980 | 0.17380 | 0 | 710 | 2231 | 31.82429 | 0.8976 | 1 | 654 | 3565 | 18.34502 | 0.7018 | 0 | 411 | 12.46210 | 0.5001 | 0 | 738 | 22.37720 | 0.3934 | 0 | 936 | 2861 | 32.71583 | 0.9807 | 1 | 138 | 825 | 16.727273 | 0.5715 | 0 | 9 | 3155 | 0.2852615 | 0.25010 | 0 | 1979 | 3298 | 60.00606 | 0.7703 | 1 | 1502 | 14 | 0.9320905 | 0.3234 | 0 | 659 | 43.8748336 | 0.9849 | 1 | 44 | 1323 | 3.325775 | 0.7062 | 0 | 137 | 1323 | 10.355253 | 0.7313 | 0 | 0 | 3298 | 0.0000 | 0.3640 | 0 | 3.33770 | 0.7351 | 2 | 2.69580 | 0.6028 | 1 | 0.7703 | 0.7631 | 1 | 3.1098 | 0.7827 | 1 | 9.91360 | 0.7557 | 5 | 3499 | 1825 | 1462 | 1760 | 3499 | 50.30009 | 0.9396 | 1 | 42 | 966 | 4.347826 | 0.4539 | 0 | 426 | 1274 | 33.437991 | 0.85200 | 1 | 52 | 188 | 27.65957 | 0.1824 | 0 | 478 | 1462 | 32.69494 | 0.61110 | 0 | 422 | 2488 | 16.96141 | 0.7638 | 1 | 497 | 3499 | 14.204058 | 0.8246 | 1 | 853 | 24.378394 | 0.8688 | 1 | 808 | 23.09231 | 0.5829 | 0 | 908 | 2691.100 | 33.74084 | 0.9808 | 1 | 179 | 811.6985 | 22.052524 | 0.7323 | 0 | 8 | 3248 | 0.2463054 | 0.26220 | 0 | 1986 | 3498.713 | 56.76373 | 0.7175 | 0 | 1825 | 29 | 1.5890411 | 0.3551 | 0 | 576 | 31.5616438 | 0.9594 | 1 | 88 | 1462 | 6.0191518 | 0.8269 | 1 | 148 | 1461.993 | 10.123166 | 0.7364 | 0 | 38 | 3499 | 1.0860246 | 0.7013 | 0 | 3.59300 | 0.8073 | 3 | 3.42700 | 0.9156 | 2 | 0.7175 | 0.7114 | 0 | 3.5791 | 0.9216 | 2 | 11.31660 | 0.9150 | 7 | Yes | 0 | 0 | \$0 | 0 | 0 | \$0 | 0 |
| 01003010200 | 01 | 003 | 010200 | AL | Alabama | Baldwin County | 3 | South Region | 6 | East South Central Division | 2612 | 1220 | 1074 | 338 | 2605 | 12.97505 | 0.2907 | 0 | 44 | 1193 | 3.688181 | 0.14720 | 0 | 172 | 928 | 18.53448 | 0.13090 | 0 | 31 | 146 | 21.23288 | 0.09299 | 0 | 203 | 1074 | 18.90130 | 0.05657 | 0 | 455 | 1872 | 24.30556 | 0.8016 | 1 | 456 | 2730 | 16.70330 | 0.6445 | 0 | 401 | 15.35222 | 0.6847 | 0 | 563 | 21.55436 | 0.3406 | 0 | 410 | 2038 | 20.11776 | 0.7755 | 1 | 64 | 779 | 8.215661 | 0.2181 | 0 | 0 | 2510 | 0.0000000 | 0.09298 | 0 | 329 | 2612 | 12.59571 | 0.3113 | 0 | 1220 | 38 | 3.1147541 | 0.4648 | 0 | 385 | 31.5573770 | 0.9545 | 1 | 20 | 1074 | 1.862197 | 0.5509 | 0 | 43 | 1074 | 4.003724 | 0.4088 | 0 | 0 | 2612 | 0.0000 | 0.3640 | 0 | 1.94057 | 0.3398 | 1 | 2.11188 | 0.2802 | 1 | 0.3113 | 0.3084 | 0 | 2.7430 | 0.6129 | 1 | 7.10675 | 0.3771 | 3 | 2928 | 1312 | 1176 | 884 | 2928 | 30.19126 | 0.7334 | 0 | 29 | 1459 | 1.987663 | 0.1356 | 0 | 71 | 830 | 8.554217 | 0.03726 | 0 | 134 | 346 | 38.72832 | 0.3964 | 0 | 205 | 1176 | 17.43197 | 0.12010 | 0 | 294 | 2052 | 14.32749 | 0.6940 | 0 | 219 | 2925 | 7.487179 | 0.5423 | 0 | 556 | 18.989071 | 0.6705 | 0 | 699 | 23.87295 | 0.6339 | 0 | 489 | 2226.455 | 21.96317 | 0.8122 | 1 | 191 | 783.8820 | 24.365914 | 0.7799 | 1 | 0 | 2710 | 0.0000000 | 0.09479 | 0 | 398 | 2927.519 | 13.59513 | 0.2511 | 0 | 1312 | 13 | 0.9908537 | 0.3111 | 0 | 400 | 30.4878049 | 0.9557 | 1 | 6 | 1176 | 0.5102041 | 0.2590 | 0 | 81 | 1176.202 | 6.886570 | 0.6115 | 0 | 7 | 2928 | 0.2390710 | 0.4961 | 0 | 2.22540 | 0.4183 | 0 | 2.99129 | 0.7634 | 2 | 0.2511 | 0.2490 | 0 | 2.6334 | 0.5496 | 1 | 8.10119 | 0.5207 | 3 | Yes | 0 | 0 | \$0 | 1 | 408000 | \$408,000 | 1 |
| 01003010500 | 01 | 003 | 010500 | AL | Alabama | Baldwin County | 3 | South Region | 6 | East South Central Division | 4230 | 1779 | 1425 | 498 | 3443 | 14.46413 | 0.3337 | 0 | 166 | 1625 | 10.215385 | 0.71790 | 0 | 151 | 1069 | 14.12535 | 0.04638 | 0 | 196 | 356 | 55.05618 | 0.73830 | 0 | 347 | 1425 | 24.35088 | 0.17010 | 0 | 707 | 2945 | 24.00679 | 0.7967 | 1 | 528 | 4001 | 13.19670 | 0.5005 | 0 | 619 | 14.63357 | 0.6436 | 0 | 790 | 18.67612 | 0.1937 | 0 | 536 | 3096 | 17.31266 | 0.6572 | 0 | 165 | 920 | 17.934783 | 0.6102 | 0 | 20 | 4021 | 0.4973887 | 0.32320 | 0 | 754 | 4230 | 17.82506 | 0.4023 | 0 | 1779 | 97 | 5.4525014 | 0.5525 | 0 | 8 | 0.4496908 | 0.4600 | 0 | 63 | 1425 | 4.421053 | 0.7762 | 1 | 90 | 1425 | 6.315790 | 0.5691 | 0 | 787 | 4230 | 18.6052 | 0.9649 | 1 | 2.51890 | 0.5121 | 1 | 2.42790 | 0.4539 | 0 | 0.4023 | 0.3986 | 0 | 3.3227 | 0.8628 | 2 | 8.67180 | 0.6054 | 3 | 5877 | 1975 | 1836 | 820 | 5244 | 15.63692 | 0.3902 | 0 | 90 | 2583 | 3.484321 | 0.3361 | 0 | 159 | 1345 | 11.821561 | 0.10530 | 0 | 139 | 491 | 28.30957 | 0.1924 | 0 | 298 | 1836 | 16.23094 | 0.09053 | 0 | 570 | 4248 | 13.41808 | 0.6669 | 0 | 353 | 5247 | 6.727654 | 0.4924 | 0 | 1109 | 18.870172 | 0.6645 | 0 | 1144 | 19.46571 | 0.3411 | 0 | 717 | 4102.545 | 17.47696 | 0.6332 | 0 | 103 | 1286.1180 | 8.008596 | 0.2341 | 0 | 0 | 5639 | 0.0000000 | 0.09479 | 0 | 868 | 5877.481 | 14.76823 | 0.2709 | 0 | 1975 | 26 | 1.3164557 | 0.3359 | 0 | 45 | 2.2784810 | 0.6271 | 0 | 9 | 1836 | 0.4901961 | 0.2540 | 0 | 116 | 1835.798 | 6.318779 | 0.5811 | 0 | 633 | 5877 | 10.7708014 | 0.9507 | 1 | 1.97613 | 0.3410 | 0 | 1.96769 | 0.1961 | 0 | 0.2709 | 0.2686 | 0 | 2.7488 | 0.6077 | 1 | 6.96352 | 0.3406 | 1 | Yes | 0 | 0 | \$0 | 0 | 0 | \$0 | 0 |
| 01003010600 | 01 | 003 | 010600 | AL | Alabama | Baldwin County | 3 | South Region | 6 | East South Central Division | 3724 | 1440 | 1147 | 1973 | 3724 | 52.98067 | 0.9342 | 1 | 142 | 1439 | 9.867964 | 0.69680 | 0 | 235 | 688 | 34.15698 | 0.62950 | 0 | 187 | 459 | 40.74074 | 0.40290 | 0 | 422 | 1147 | 36.79163 | 0.55150 | 0 | 497 | 1876 | 26.49254 | 0.8354 | 1 | 511 | 3661 | 13.95794 | 0.5334 | 0 | 246 | 6.60580 | 0.1481 | 0 | 1256 | 33.72718 | 0.9305 | 1 | 496 | 2522 | 19.66693 | 0.7587 | 1 | 274 | 838 | 32.696897 | 0.8779 | 1 | 32 | 3479 | 0.9198045 | 0.42810 | 0 | 2606 | 3724 | 69.97852 | 0.8184 | 1 | 1440 | 21 | 1.4583333 | 0.3683 | 0 | 321 | 22.2916667 | 0.9036 | 1 | 97 | 1147 | 8.456844 | 0.8956 | 1 | 167 | 1147 | 14.559721 | 0.8209 | 1 | 0 | 3724 | 0.0000 | 0.3640 | 0 | 3.55130 | 0.7859 | 2 | 3.14330 | 0.8145 | 3 | 0.8184 | 0.8108 | 1 | 3.3524 | 0.8725 | 3 | 10.86540 | 0.8550 | 9 | 4115 | 1534 | 1268 | 1676 | 3997 | 41.93145 | 0.8814 | 1 | 294 | 1809 | 16.252073 | 0.9674 | 1 | 341 | 814 | 41.891892 | 0.94320 | 1 | 204 | 454 | 44.93392 | 0.5438 | 0 | 545 | 1268 | 42.98107 | 0.83620 | 1 | 624 | 2425 | 25.73196 | 0.9002 | 1 | 994 | 4115 | 24.155529 | 0.9602 | 1 | 642 | 15.601458 | 0.4841 | 0 | 1126 | 27.36331 | 0.8175 | 1 | 568 | 2989.000 | 19.00301 | 0.7045 | 0 | 212 | 715.0000 | 29.650350 | 0.8592 | 1 | 56 | 3825 | 1.4640523 | 0.53120 | 0 | 2715 | 4115.000 | 65.97813 | 0.7732 | 1 | 1534 | 0 | 0.0000000 | 0.1079 | 0 | 529 | 34.4850065 | 0.9685 | 1 | 101 | 1268 | 7.9652997 | 0.8795 | 1 | 89 | 1268.000 | 7.018927 | 0.6184 | 0 | 17 | 4115 | 0.4131227 | 0.5707 | 0 | 4.54540 | 0.9754 | 5 | 3.39650 | 0.9081 | 2 | 0.7732 | 0.7667 | 1 | 3.1450 | 0.7858 | 2 | 11.86010 | 0.9520 | 10 | Yes | 0 | 0 | \$0 | 1 | 8000000 | \$8,000,000 | 1 |
svi_national_nmtc_county_sum <- summarize_county_nmtc(svi_national_nmtc)

svi_national_nmtc_county_sum %>% head() %>% kbl() %>% kable_styling() %>% scroll_box(width = "100%")
| State | County | Division | post10_nmtc_project_cnt | tract_cnt | post10_nmtc_project_dollars | post10_nmtc_dollars_formatted |
|---|---|---|---|---|---|---|
| AK | Aleutians East Borough | Pacific Division | 1 | 1 | 15762500 | \$15,762,500 |
| AK | Aleutians West Census Area | Pacific Division | 0 | 1 | 0 | \$0 |
| AK | Anchorage Municipality | Pacific Division | 1 | 13 | 9800000 | \$9,800,000 |
| AK | Bethel Census Area | Pacific Division | 0 | 1 | 0 | \$0 |
| AK | Fairbanks North Star Borough | Pacific Division | 0 | 4 | 0 | \$0 |
| AK | Hoonah-Angoon Census Area | Pacific Division | 0 | 1 | 0 | \$0 |
svi_divisional_nmtc_county_sum <- summarize_county_nmtc(svi_divisional_nmtc)
svi_divisional_nmtc_county_sum %>% head() %>% kbl() %>% kable_styling() %>% scroll_box(width = "100%")
| State | County | Division | post10_nmtc_project_cnt | tract_cnt | post10_nmtc_project_dollars | post10_nmtc_dollars_formatted |
|---|---|---|---|---|---|---|
| DC | District of Columbia | South Atlantic Division | 22 | 78 | 377155570 | \$377,155,570 |
| DE | Kent County | South Atlantic Division | 0 | 14 | 0 | \$0 |
| DE | New Castle County | South Atlantic Division | 2 | 44 | 27912271 | \$27,912,271 |
| DE | Sussex County | South Atlantic Division | 0 | 16 | 0 | \$0 |
| FL | Alachua County | South Atlantic Division | 2 | 28 | 16360000 | \$16,360,000 |
| FL | Baker County | South Atlantic Division | 0 | 2 | 0 | \$0 |
Create data frame of NMTC eligible tracts 2010 nationally
# Create data frame of NMTC eligible tracts 2010 nationally
svi_national_nmtc10 <- svi_national_nmtc %>% select(GEOID_2010_trt, FIPS_st, FIPS_county,
    state, state_name, county, region_number, region, division_number,
    division, F_TOTAL_10, E_TOTPOP_10) %>% rename("F_TOTAL" = "F_TOTAL_10")

# Count national-level SVI flags for 2010, create unified fips column
svi_2010_national_county_flags_nmtc <- flag_summarize(svi_national_nmtc10, "E_TOTPOP_10") %>% unite("fips_county_st", FIPS_st:FIPS_county, remove = FALSE, sep="")

# Add suffix to flag columns 2010
colnames(svi_2010_national_county_flags_nmtc)[11:15] <- paste0(colnames(svi_2010_national_county_flags_nmtc)[11:15], 10)

# Create data frame of NMTC eligible tracts 2020 nationally
svi_national_nmtc20 <- svi_national_nmtc %>% select(GEOID_2010_trt, FIPS_st, FIPS_county,
    state, state_name, county, region_number, region, division_number,
    division, F_TOTAL_20, E_TOTPOP_20) %>% rename("F_TOTAL" = "F_TOTAL_20")

# Count national-level SVI flags for 2020, create unified fips column
svi_2020_national_county_flags_nmtc <- flag_summarize(svi_national_nmtc20, "E_TOTPOP_20") %>% unite("fips_county_st", FIPS_st:FIPS_county, remove = FALSE, sep="")

# Identify needed columns for 2020, add suffix
colnames(svi_2020_national_county_flags_nmtc)[11:15] <- paste0(colnames(svi_2020_national_county_flags_nmtc)[11:15], "20")

# Filter to needed columns for 2020 to avoid duplicate column column names
svi_2020_national_county_flags_join_nmtc <- svi_2020_national_county_flags_nmtc %>% ungroup() %>% select("fips_county_st", all_of(colnames(svi_2020_national_county_flags_nmtc)[11:15]))

# Join 2010 and 2020 data
svi_national_county_flags_nmtc <- left_join(svi_2010_national_county_flags_nmtc, svi_2020_national_county_flags_join_nmtc, join_by("fips_county_st" == "fips_county_st"))

svi_national_county_flags_nmtc %>% head() %>% kbl() %>% kable_styling() %>% scroll_box(width = "100%")
| fips_county_st | FIPS_st | FIPS_county | state | state_name | county | region_number | region | division_number | division | flag_count10 | pop10 | flag_by_pop10 | flag_count_quantile10 | flag_pop_quantile10 | flag_count20 | pop20 | flag_by_pop20 | flag_count_quantile20 | flag_pop_quantile20 |
|---|---|---|---|---|---|---|---|---|---|---|---|---|---|---|---|---|---|---|---|
| 01001 | 01 | 001 | AL | Alabama | Autauga County | 3 | South Region | 6 | East South Central Division | 14 | 7982 | 0.0017539 | 0.6 | 0.8 | 18 | 8818 | 0.0020413 | 0.6 | 1.0 |
| 01003 | 01 | 003 | AL | Alabama | Baldwin County | 3 | South Region | 6 | East South Central Division | 34 | 38458 | 0.0008841 | 0.8 | 0.4 | 34 | 46255 | 0.0007351 | 0.8 | 0.2 |
| 01005 | 01 | 005 | AL | Alabama | Barbour County | 3 | South Region | 6 | East South Central Division | 43 | 21287 | 0.0020200 | 0.8 | 1.0 | 44 | 18811 | 0.0023391 | 0.8 | 1.0 |
| 01007 | 01 | 007 | AL | Alabama | Bibb County | 3 | South Region | 6 | East South Central Division | 11 | 17570 | 0.0006261 | 0.4 | 0.2 | 16 | 17663 | 0.0009058 | 0.6 | 0.4 |
| 01009 | 01 | 009 | AL | Alabama | Blount County | 3 | South Region | 6 | East South Central Division | 12 | 16995 | 0.0007061 | 0.4 | 0.2 | 8 | 16546 | 0.0004835 | 0.4 | 0.2 |
| 01011 | 01 | 011 | AL | Alabama | Bullock County | 3 | South Region | 6 | East South Central Division | 21 | 10923 | 0.0019225 | 0.6 | 1.0 | 18 | 10173 | 0.0017694 | 0.6 | 0.8 |
svi_national_county_nmtc <- left_join(svi_national_nmtc_county_sum,
                                      svi_national_county_flags_nmtc,
                                    join_by("State" == "state", "County" == "county",
                                            "Division" == "division"))

svi_national_county_nmtc$post10_nmtc_project_cnt[is.na(svi_national_county_nmtc$post10_nmtc_project_cnt)] <- 0

svi_national_county_nmtc$county_name <- paste0(svi_national_county_nmtc$County, ", ", svi_national_county_nmtc$State)

svi_national_county_nmtc %>% head() %>% kbl() %>% kable_styling() %>% scroll_box(width = "100%")
| State | County | Division | post10_nmtc_project_cnt | tract_cnt | post10_nmtc_project_dollars | post10_nmtc_dollars_formatted | fips_county_st | FIPS_st | FIPS_county | state_name | region_number | region | division_number | flag_count10 | pop10 | flag_by_pop10 | flag_count_quantile10 | flag_pop_quantile10 | flag_count20 | pop20 | flag_by_pop20 | flag_count_quantile20 | flag_pop_quantile20 | county_name |
|---|---|---|---|---|---|---|---|---|---|---|---|---|---|---|---|---|---|---|---|---|---|---|---|---|
| AK | Aleutians East Borough | Pacific Division | 1 | 1 | 15762500 | \$15,762,500 | 02013 | 02 | 013 | Alaska | 4 | West Region | 9 | 8 | 3703 | 0.0021604 | 0.4 | 1.0 | 5 | 3389 | 0.0014754 | 0.2 | 0.8 | Aleutians East Borough, AK |
| AK | Aleutians West Census Area | Pacific Division | 0 | 1 | 0 | \$0 | 02016 | 02 | 016 | Alaska | 4 | West Region | 9 | 6 | 1774 | 0.0033822 | 0.2 | 1.0 | 6 | 950 | 0.0063158 | 0.2 | 1.0 | Aleutians West Census Area, AK |
| AK | Anchorage Municipality | Pacific Division | 1 | 13 | 9800000 | \$9,800,000 | 02020 | 02 | 020 | Alaska | 4 | West Region | 9 | 72 | 64432 | 0.0011175 | 1.0 | 0.4 | 87 | 69679 | 0.0012486 | 1.0 | 0.6 | Anchorage Municipality, AK |
| AK | Bethel Census Area | Pacific Division | 0 | 1 | 0 | \$0 | 02050 | 02 | 050 | Alaska | 4 | West Region | 9 | 8 | 1386 | 0.0057720 | 0.4 | 1.0 | 10 | 1404 | 0.0071225 | 0.4 | 1.0 | Bethel Census Area, AK |
| AK | Fairbanks North Star Borough | Pacific Division | 0 | 4 | 0 | \$0 | 02090 | 02 | 090 | Alaska | 4 | West Region | 9 | 13 | 17281 | 0.0007523 | 0.4 | 0.2 | 17 | 20094 | 0.0008460 | 0.6 | 0.4 | Fairbanks North Star Borough, AK |
| AK | Hoonah-Angoon Census Area | Pacific Division | 0 | 1 | 0 | \$0 | 02105 | 02 | 105 | Alaska | 4 | West Region | 9 | 4 | 1888 | 0.0021186 | 0.2 | 1.0 | 5 | 2073 | 0.0024120 | 0.2 | 1.0 | Hoonah-Angoon Census Area, AK |
Create data frame of NMTC eligible tracts 2020 nationally
# Create data frame of NMTC eligible tracts 2020 nationally
svi_divisional_nmtc10 <- svi_divisional_nmtc %>% select(GEOID_2010_trt, FIPS_st, FIPS_county,
    state, state_name, county, region_number, region, division_number,
    division, F_TOTAL_10, E_TOTPOP_10) %>% rename("F_TOTAL" = "F_TOTAL_10")

# Count divisional-level SVI flags for 2010, create unified fips column
svi_2010_divisional_county_flags_nmtc <- flag_summarize(svi_divisional_nmtc10, "E_TOTPOP_10") %>% unite("fips_county_st", FIPS_st:FIPS_county, remove = FALSE, sep="")

# Add suffix to flag columns 2010
colnames(svi_2010_divisional_county_flags_nmtc)[11:15] <- paste0(colnames(svi_2010_divisional_county_flags_nmtc)[11:15], "10")

# Create data frame of NMTC eligible tracts 2020 nationally
svi_divisional_nmtc20 <- svi_divisional_nmtc %>% select(GEOID_2010_trt, FIPS_st, FIPS_county,
    state, state_name, county, region_number, region, division_number,
    division, F_TOTAL_20, E_TOTPOP_20) %>% rename("F_TOTAL" = "F_TOTAL_20")

# Count divisional-level SVI flags for 2020, create unified fips column
svi_2020_divisional_county_flags_nmtc <- flag_summarize(svi_divisional_nmtc20, "E_TOTPOP_20") %>% unite("fips_county_st", FIPS_st:FIPS_county, remove = FALSE, sep="")

# Identify needed columns for 2020
colnames(svi_2020_divisional_county_flags_nmtc)[11:15] <- paste0(colnames(svi_2020_divisional_county_flags_nmtc)[11:15], "20")

# Filter to needed columns for 2020 to avoid duplicate column column names
svi_2020_divisional_county_flags_join_nmtc <- svi_2020_divisional_county_flags_nmtc %>% ungroup() %>% select("fips_county_st", all_of(colnames(svi_2020_divisional_county_flags_nmtc)[11:15]))

# Join 2010 and 2020 data
svi_divisional_county_flags_nmtc <- left_join(svi_2010_divisional_county_flags_nmtc, svi_2020_divisional_county_flags_join_nmtc, join_by("fips_county_st" == "fips_county_st"))

svi_divisional_county_flags_nmtc %>% head() %>% kbl() %>% kable_styling() %>% scroll_box(width = "100%")
| fips_county_st | FIPS_st | FIPS_county | state | state_name | county | region_number | region | division_number | division | flag_count10 | pop10 | flag_by_pop10 | flag_count_quantile10 | flag_pop_quantile10 | flag_count20 | pop20 | flag_by_pop20 | flag_count_quantile20 | flag_pop_quantile20 |
|---|---|---|---|---|---|---|---|---|---|---|---|---|---|---|---|---|---|---|---|
| 10001 | 10 | 001 | DE | Delaware | Kent County | 3 | South Region | 5 | South Atlantic Division | 57 | 54435 | 0.0010471 | 0.8 | 0.4 | 75 | 58746 | 0.0012767 | 1.0 | 0.6 |
| 10003 | 10 | 003 | DE | Delaware | New Castle County | 3 | South Region | 5 | South Atlantic Division | 230 | 157982 | 0.0014559 | 1.0 | 0.8 | 215 | 157528 | 0.0013648 | 1.0 | 0.8 |
| 10005 | 10 | 005 | DE | Delaware | Sussex County | 3 | South Region | 5 | South Atlantic Division | 65 | 69409 | 0.0009365 | 1.0 | 0.4 | 61 | 77024 | 0.0007920 | 0.8 | 0.4 |
| 11001 | 11 | 001 | DC | District of Columbia | District of Columbia | 3 | South Region | 5 | South Atlantic Division | 605 | 234370 | 0.0025814 | 1.0 | 1.0 | 576 | 290905 | 0.0019800 | 1.0 | 1.0 |
| 12001 | 12 | 001 | FL | Florida | Alachua County | 3 | South Region | 5 | South Atlantic Division | 160 | 107400 | 0.0014898 | 1.0 | 0.8 | 156 | 115817 | 0.0013470 | 1.0 | 0.8 |
| 12003 | 12 | 003 | FL | Florida | Baker County | 3 | South Region | 5 | South Atlantic Division | 9 | 15229 | 0.0005910 | 0.2 | 0.2 | 8 | 15148 | 0.0005281 | 0.2 | 0.2 |
svi_divisional_county_nmtc <- left_join(svi_divisional_nmtc_county_sum,
                                        svi_divisional_county_flags_nmtc,
                                    join_by("State" == "state", "County" == "county",
                                            "Division" == "division"))

svi_divisional_county_nmtc$post10_nmtc_project_cnt[is.na(svi_divisional_county_nmtc $post10_nmtc_project_cnt)] <- 0

svi_divisional_county_nmtc$county_name <- paste0(svi_divisional_county_nmtc$County, ", ", svi_divisional_county_nmtc$State)

svi_divisional_county_nmtc %>% head() %>% kbl() %>% kable_styling() %>% scroll_box(width = "100%")
| State | County | Division | post10_nmtc_project_cnt | tract_cnt | post10_nmtc_project_dollars | post10_nmtc_dollars_formatted | fips_county_st | FIPS_st | FIPS_county | state_name | region_number | region | division_number | flag_count10 | pop10 | flag_by_pop10 | flag_count_quantile10 | flag_pop_quantile10 | flag_count20 | pop20 | flag_by_pop20 | flag_count_quantile20 | flag_pop_quantile20 | county_name |
|---|---|---|---|---|---|---|---|---|---|---|---|---|---|---|---|---|---|---|---|---|---|---|---|---|
| DC | District of Columbia | South Atlantic Division | 22 | 78 | 377155570 | \$377,155,570 | 11001 | 11 | 001 | District of Columbia | 3 | South Region | 5 | 605 | 234370 | 0.0025814 | 1.0 | 1.0 | 576 | 290905 | 0.0019800 | 1.0 | 1.0 | District of Columbia, DC |
| DE | Kent County | South Atlantic Division | 0 | 14 | 0 | \$0 | 10001 | 10 | 001 | Delaware | 3 | South Region | 5 | 57 | 54435 | 0.0010471 | 0.8 | 0.4 | 75 | 58746 | 0.0012767 | 1.0 | 0.6 | Kent County, DE |
| DE | New Castle County | South Atlantic Division | 2 | 44 | 27912271 | \$27,912,271 | 10003 | 10 | 003 | Delaware | 3 | South Region | 5 | 230 | 157982 | 0.0014559 | 1.0 | 0.8 | 215 | 157528 | 0.0013648 | 1.0 | 0.8 | New Castle County, DE |
| DE | Sussex County | South Atlantic Division | 0 | 16 | 0 | \$0 | 10005 | 10 | 005 | Delaware | 3 | South Region | 5 | 65 | 69409 | 0.0009365 | 1.0 | 0.4 | 61 | 77024 | 0.0007920 | 0.8 | 0.4 | Sussex County, DE |
| FL | Alachua County | South Atlantic Division | 2 | 28 | 16360000 | \$16,360,000 | 12001 | 12 | 001 | Florida | 3 | South Region | 5 | 160 | 107400 | 0.0014898 | 1.0 | 0.8 | 156 | 115817 | 0.0013470 | 1.0 | 0.8 | Alachua County, FL |
| FL | Baker County | South Atlantic Division | 0 | 2 | 0 | \$0 | 12003 | 12 | 003 | Florida | 3 | South Region | 5 | 9 | 15229 | 0.0005910 | 0.2 | 0.2 | 8 | 15148 | 0.0005281 | 0.2 | 0.2 | Baker County, FL |
LIHTC Data Wrangling
lihtc_eligible_flag <- lihtc_eligible %>%
  select("fips", "state", "county", "stcnty", "tract", "metro", "cbsa", "qct_2010") %>%
  rename("GEOID10" = "fips") %>%
  mutate(lihtc_eligibility = if_else(qct_2010 == 1, "Yes", "No")) %>%
  filter(tolower(lihtc_eligibility) == "yes") %>%
  select(GEOID10, lihtc_eligibility)

lihtc_eligible_flag %>% head()
## # A tibble: 6 × 2
##   GEOID10     lihtc_eligibility
##   <chr>       <chr>
## 1 01003010600 Yes
## 2 01005950200 Yes
## 3 01005950300 Yes
## 4 01005950400 Yes
## 5 01005950600 Yes
## 6 01005950700 Yes
lihtc_projects10 <- lihtc_projects %>%
  filter(yr_alloc < 8000) %>%
  filter(yr_alloc <= 2010) %>%
  count(fips2010) %>%
  rename("pre10_lihtc_project_cnt" = "n")

lihtc_projects10 %>% head()
##      fips2010 pre10_lihtc_project_cnt
## 1 01001020300                       2
## 2 01001020500                       5
## 3 01001021100                       1
## 4 01003010200                       1
## 5 01003010600                       1
## 6 01003010703                       1
lihtc_dollars10 <- lihtc_projects %>%
  filter(yr_alloc < 8000) %>%
  filter(yr_alloc <= 2010) %>%
  select(fips2010, allocamt)

lihtc_dollars10$allocamt[is.na(lihtc_dollars10$allocamt)] <- 0

lihtc_dollars10 <- lihtc_dollars10 %>%
  group_by(fips2010) %>%
  summarise(pre10_lihtc_project_dollars = sum(allocamt, na.rm = TRUE))

lihtc_dollars10 %>% head()
## # A tibble: 6 × 2
##   fips2010    pre10_lihtc_project_dollars
##   <chr>                             <dbl>
## 1 01001020300                      216593
## 2 01001020500                     2250459
## 3 01001021100                       53109
## 4 01003010200                           0
## 5 01003010600                      376889
## 6 01003010703                      717113
lihtc_projects10 <- left_join(lihtc_projects10, lihtc_dollars10, join_by(fips2010 == fips2010))

lihtc_projects10 %>% head()
##      fips2010 pre10_lihtc_project_cnt pre10_lihtc_project_dollars
## 1 01001020300                       2                      216593
## 2 01001020500                       5                     2250459
## 3 01001021100                       1                       53109
## 4 01003010200                       1                           0
## 5 01003010600                       1                      376889
## 6 01003010703                       1                      717113
lihtc_projects20 <- lihtc_projects %>%
  filter(yr_alloc < 8000) %>%
  filter(yr_alloc > 2010) %>%
  filter(yr_alloc < 2021) %>%
  count(fips2010) %>%
  rename("post10_lihtc_project_cnt" = "n")

lihtc_projects20 %>% head()
##      fips2010 post10_lihtc_project_cnt
## 1 01003010500                        1
## 2 01003011403                        1
## 3 01003011601                        1
## 4 01005950900                        1
## 5 01009050102                        1
## 6 01017954600                        2
lihtc_dollars20 <- lihtc_projects %>%
  filter(yr_alloc < 8000) %>%
  filter(yr_alloc > 2010) %>%
  filter(yr_alloc < 2021) %>%
  select(fips2010, allocamt)

lihtc_dollars20$allocamt[is.na(lihtc_dollars20$allocamt)] <- 0

lihtc_dollars20 <- lihtc_dollars20 %>%
  group_by(fips2010) %>%
  summarise(post10_lihtc_project_dollars = sum(allocamt, na.rm = TRUE))

lihtc_dollars20 %>% head()
## # A tibble: 6 × 2
##   fips2010    post10_lihtc_project_dollars
##   <chr>                              <dbl>
## 1 01003010500                       481325
## 2 01003011403                       828342
## 3 01003011601                       887856
## 4 01005950900                       400758
## 5 01009050102                       463000
## 6 01017954600                       950192
Join National & Divisional Data
lihtc_projects20 <- left_join(lihtc_projects20, lihtc_dollars20, join_by(fips2010 == fips2010))

lihtc_projects20 %>% head() %>% kbl() %>% kable_styling() %>% scroll_box(width = "100%")
| fips2010 | post10_lihtc_project_cnt | post10_lihtc_project_dollars |
|---|---|---|
| 01003010500 | 1 | 481325 |
| 01003011403 | 1 | 828342 |
| 01003011601 | 1 | 887856 |
| 01005950900 | 1 | 400758 |
| 01009050102 | 1 | 463000 |
| 01017954600 | 2 | 950192 |
svi_divisional_lihtc10 <- left_join(svi_divisional, lihtc_projects10, join_by("GEOID_2010_trt" == "fips2010"))

svi_divisional_lihtc10 %>% head() %>% kbl() %>% kable_styling() %>% scroll_box(width = "100%")
| GEOID_2010_trt | FIPS_st | FIPS_county | FIPS_tract | state | state_name | county | region_number | region | division_number | division | E_TOTPOP_10 | E_HU_10 | E_HH_10 | E_POV150_10 | ET_POVSTATUS_10 | EP_POV150_10 | EPL_POV150_10 | F_POV150_10 | E_UNEMP_10 | ET_EMPSTATUS_10 | EP_UNEMP_10 | EPL_UNEMP_10 | F_UNEMP_10 | E_HBURD_OWN_10 | ET_HOUSINGCOST_OWN_10 | EP_HBURD_OWN_10 | EPL_HBURD_OWN_10 | F_HBURD_OWN_10 | E_HBURD_RENT_10 | ET_HOUSINGCOST_RENT_10 | EP_HBURD_RENT_10 | EPL_HBURD_RENT_10 | F_HBURD_RENT_10 | E_HBURD_10 | ET_HOUSINGCOST_10 | EP_HBURD_10 | EPL_HBURD_10 | F_HBURD_10 | E_NOHSDP_10 | ET_EDSTATUS_10 | EP_NOHSDP_10 | EPL_NOHSDP_10 | F_NOHSDP_10 | E_UNINSUR_12 | ET_INSURSTATUS_12 | EP_UNINSUR_12 | EPL_UNINSUR_12 | F_UNINSUR_12 | E_AGE65_10 | EP_AGE65_10 | EPL_AGE65_10 | F_AGE65_10 | E_AGE17_10 | EP_AGE17_10 | EPL_AGE17_10 | F_AGE17_10 | E_DISABL_12 | ET_DISABLSTATUS_12 | EP_DISABL_12 | EPL_DISABL_12 | F_DISABL_12 | E_SNGPNT_10 | ET_FAMILIES_10 | EP_SNGPNT_10 | EPL_SNGPNT_10 | F_SNGPNT_10 | E_LIMENG_10 | ET_POPAGE5UP_10 | EP_LIMENG_10 | EPL_LIMENG_10 | F_LIMENG_10 | E_MINRTY_10 | ET_POPETHRACE_10 | EP_MINRTY_10 | EPL_MINRTY_10 | F_MINRTY_10 | E_STRHU_10 | E_MUNIT_10 | EP_MUNIT_10 | EPL_MUNIT_10 | F_MUNIT_10 | E_MOBILE_10 | EP_MOBILE_10 | EPL_MOBILE_10 | F_MOBILE_10 | E_CROWD_10 | ET_OCCUPANTS_10 | EP_CROWD_10 | EPL_CROWD_10 | F_CROWD_10 | E_NOVEH_10 | ET_KNOWNVEH_10 | EP_NOVEH_10 | EPL_NOVEH_10 | F_NOVEH_10 | E_GROUPQ_10 | ET_HHTYPE_10 | EP_GROUPQ_10 | EPL_GROUPQ_10 | F_GROUPQ_10 | SPL_THEME1_10 | RPL_THEME1_10 | F_THEME1_10 | SPL_THEME2_10 | RPL_THEME2_10 | F_THEME2_10 | SPL_THEME3_10 | RPL_THEME3_10 | F_THEME3_10 | SPL_THEME4_10 | RPL_THEME4_10 | F_THEME4_10 | SPL_THEMES_10 | RPL_THEMES_10 | F_TOTAL_10 | E_TOTPOP_20 | E_HU_20 | E_HH_20 | E_POV150_20 | ET_POVSTATUS_20 | EP_POV150_20 | EPL_POV150_20 | F_POV150_20 | E_UNEMP_20 | ET_EMPSTATUS_20 | EP_UNEMP_20 | EPL_UNEMP_20 | F_UNEMP_20 | E_HBURD_OWN_20 | ET_HOUSINGCOST_OWN_20 | EP_HBURD_OWN_20 | EPL_HBURD_OWN_20 | F_HBURD_OWN_20 | E_HBURD_RENT_20 | ET_HOUSINGCOST_RENT_20 | EP_HBURD_RENT_20 | EPL_HBURD_RENT_20 | F_HBURD_RENT_20 | E_HBURD_20 | ET_HOUSINGCOST_20 | EP_HBURD_20 | EPL_HBURD_20 | F_HBURD_20 | E_NOHSDP_20 | ET_EDSTATUS_20 | EP_NOHSDP_20 | EPL_NOHSDP_20 | F_NOHSDP_20 | E_UNINSUR_20 | ET_INSURSTATUS_20 | EP_UNINSUR_20 | EPL_UNINSUR_20 | F_UNINSUR_20 | E_AGE65_20 | EP_AGE65_20 | EPL_AGE65_20 | F_AGE65_20 | E_AGE17_20 | EP_AGE17_20 | EPL_AGE17_20 | F_AGE17_20 | E_DISABL_20 | ET_DISABLSTATUS_20 | EP_DISABL_20 | EPL_DISABL_20 | F_DISABL_20 | E_SNGPNT_20 | ET_FAMILIES_20 | EP_SNGPNT_20 | EPL_SNGPNT_20 | F_SNGPNT_20 | E_LIMENG_20 | ET_POPAGE5UP_20 | EP_LIMENG_20 | EPL_LIMENG_20 | F_LIMENG_20 | E_MINRTY_20 | ET_POPETHRACE_20 | EP_MINRTY_20 | EPL_MINRTY_20 | F_MINRTY_20 | E_STRHU_20 | E_MUNIT_20 | EP_MUNIT_20 | EPL_MUNIT_20 | F_MUNIT_20 | E_MOBILE_20 | EP_MOBILE_20 | EPL_MOBILE_20 | F_MOBILE_20 | E_CROWD_20 | ET_OCCUPANTS_20 | EP_CROWD_20 | EPL_CROWD_20 | F_CROWD_20 | E_NOVEH_20 | ET_KNOWNVEH_20 | EP_NOVEH_20 | EPL_NOVEH_20 | F_NOVEH_20 | E_GROUPQ_20 | ET_HHTYPE_20 | EP_GROUPQ_20 | EPL_GROUPQ_20 | F_GROUPQ_20 | SPL_THEME1_20 | RPL_THEME1_20 | F_THEME1_20 | SPL_THEME2_20 | RPL_THEME2_20 | F_THEME2_20 | SPL_THEME3_20 | RPL_THEME3_20 | F_THEME3_20 | SPL_THEME4_20 | RPL_THEME4_20 | F_THEME4_20 | SPL_THEMES_20 | RPL_THEMES_20 | F_TOTAL_20 | pre10_lihtc_project_cnt | pre10_lihtc_project_dollars |
|---|---|---|---|---|---|---|---|---|---|---|---|---|---|---|---|---|---|---|---|---|---|---|---|---|---|---|---|---|---|---|---|---|---|---|---|---|---|---|---|---|---|---|---|---|---|---|---|---|---|---|---|---|---|---|---|---|---|---|---|---|---|---|---|---|---|---|---|---|---|---|---|---|---|---|---|---|---|---|---|---|---|---|---|---|---|---|---|---|---|---|---|---|---|---|---|---|---|---|---|---|---|---|---|---|---|---|---|---|---|---|---|---|---|---|---|---|---|---|---|---|---|---|---|---|---|---|---|---|---|---|---|---|---|---|---|---|---|---|---|---|---|---|---|---|---|---|---|---|---|---|---|---|---|---|---|---|---|---|---|---|---|---|---|---|---|---|---|---|---|---|---|---|---|---|---|---|---|---|---|---|---|---|---|---|---|---|---|---|---|---|---|---|---|---|---|---|---|---|---|---|---|---|---|---|---|---|---|---|---|---|---|---|---|---|---|---|---|---|---|---|---|---|
| 10001040100 | 10 | 001 | 040100 | DE | Delaware | Kent County | 3 | South Region | 5 | South Atlantic Division | 6468 | 2388 | 2272 | 868 | 6455 | 13.446940 | 0.2879 | 0 | 201 | 3230 | 6.222910 | 0.3819 | 0 | 708 | 2036 | 34.77407 | 0.6489 | 0 | 47 | 236 | 19.91525 | 0.07811 | 0 | 755 | 2272 | 33.23063 | 0.4315 | 0 | 691 | 4369 | 15.815976 | 0.5692 | 0 | 400 | 6594 | 6.066121 | 0.12090 | 0 | 688 | 10.636982 | 0.3706 | 0 | 1689 | 26.11317 | 0.6923 | 0 | 725 | 5107 | 14.19620 | 0.4566 | 0 | 209 | 1742 | 11.99770 | 0.3673 | 0 | 0 | 5993 | 0.0000000 | 0.1022 | 0 | 845 | 6468 | 13.06432 | 0.2341 | 0 | 2388 | 0 | 0.000000 | 0.1428 | 0 | 601 | 25.167504 | 0.8423 | 1 | 14 | 2272 | 0.6161972 | 0.3716 | 0 | 92 | 2272 | 4.049296 | 0.4329 | 0 | 0 | 6468 | 0.000000 | 0.3814 | 0 | 1.79140 | 0.2784 | 0 | 1.9890 | 0.2036 | 0 | 0.2341 | 0.2310 | 0 | 2.1710 | 0.3144 | 1 | 6.18550 | 0.2310 | 1 | 7531 | 2850 | 2587 | 2226 | 7519 | 29.60500 | 0.7109 | 0 | 392 | 3820 | 10.261780 | 0.8786 | 1 | 527 | 2067 | 25.49589 | 0.6863 | 0 | 180 | 520 | 34.61538 | 0.2805 | 0 | 707 | 2587 | 27.32895 | 0.4528 | 0 | 765 | 4950 | 15.454546 | 0.7234 | 0 | 353 | 7523 | 4.692277 | 0.2050 | 0 | 1007 | 13.37140 | 0.3312 | 0 | 2035 | 27.02164 | 0.8398 | 1 | 1227 | 5488.000 | 22.35787 | 0.8093 | 1 | 239 | 1893.0000 | 12.62546 | 0.4261 | 0 | 276 | 7262 | 3.8006059 | 0.75930 | 1 | 1507 | 7531.000 | 20.01062 | 0.2789 | 0 | 2850 | 1 | 0.0350877 | 0.2526 | 0 | 697 | 24.456140 | 0.8585 | 1 | 93 | 2587 | 3.5948976 | 0.7607 | 1 | 55 | 2587.0000 | 2.126015 | 0.2641 | 0 | 0 | 7531 | 0.000000 | 0.2111 | 0 | 2.9707 | 0.6413 | 1 | 3.16570 | 0.8440 | 3 | 0.2789 | 0.2755 | 0 | 2.3470 | 0.4035 | 2 | 8.76230 | 0.6215 | 6 | NA | NA |
| 10001040201 | 10 | 001 | 040201 | DE | Delaware | Kent County | 3 | South Region | 5 | South Atlantic Division | 5208 | 1953 | 1809 | 850 | 5183 | 16.399769 | 0.3672 | 0 | 147 | 2550 | 5.764706 | 0.3364 | 0 | 385 | 1323 | 29.10053 | 0.4581 | 0 | 222 | 486 | 45.67901 | 0.49650 | 0 | 607 | 1809 | 33.55445 | 0.4431 | 0 | 459 | 3090 | 14.854369 | 0.5386 | 0 | 435 | 5283 | 8.233958 | 0.19610 | 0 | 454 | 8.717358 | 0.2561 | 0 | 1588 | 30.49155 | 0.8927 | 1 | 537 | 3716 | 14.45102 | 0.4708 | 0 | 417 | 1343 | 31.04989 | 0.8599 | 1 | 69 | 4835 | 1.4270941 | 0.5240 | 0 | 1881 | 5208 | 36.11751 | 0.5689 | 0 | 1953 | 87 | 4.454685 | 0.5392 | 0 | 148 | 7.578085 | 0.6495 | 0 | 39 | 1809 | 2.1558872 | 0.6471 | 0 | 121 | 1809 | 6.688778 | 0.6124 | 0 | 0 | 5208 | 0.000000 | 0.3814 | 0 | 1.88140 | 0.3053 | 0 | 3.0035 | 0.7667 | 2 | 0.5689 | 0.5614 | 0 | 2.8296 | 0.6516 | 0 | 8.28340 | 0.5452 | 2 | 4770 | 1906 | 1732 | 755 | 4692 | 16.09122 | 0.3758 | 0 | 92 | 2500 | 3.680000 | 0.3633 | 0 | 197 | 1184 | 16.63851 | 0.2804 | 0 | 235 | 548 | 42.88321 | 0.4609 | 0 | 432 | 1732 | 24.94226 | 0.3622 | 0 | 251 | 3100 | 8.096774 | 0.4085 | 0 | 228 | 4770 | 4.779874 | 0.2116 | 0 | 549 | 11.50943 | 0.2329 | 0 | 1352 | 28.34382 | 0.8865 | 1 | 490 | 3418.125 | 14.33535 | 0.4309 | 0 | 328 | 1263.2064 | 25.96567 | 0.8111 | 1 | 0 | 4526 | 0.0000000 | 0.09987 | 0 | 1875 | 4769.908 | 39.30893 | 0.5372 | 0 | 1906 | 72 | 3.7775446 | 0.4876 | 0 | 128 | 6.715635 | 0.6610 | 0 | 10 | 1732 | 0.5773672 | 0.3165 | 0 | 32 | 1731.7111 | 1.847883 | 0.2303 | 0 | 0 | 4770 | 0.000000 | 0.2111 | 0 | 1.7214 | 0.2531 | 0 | 2.46127 | 0.4594 | 2 | 0.5372 | 0.5306 | 0 | 1.9065 | 0.2183 | 0 | 6.62637 | 0.2829 | 2 | NA | NA |
| 10001040202 | 10 | 001 | 040202 | DE | Delaware | Kent County | 3 | South Region | 5 | South Atlantic Division | 11385 | 4350 | 4041 | 1680 | 10992 | 15.283843 | 0.3360 | 0 | 475 | 5262 | 9.026986 | 0.6217 | 0 | 1237 | 3491 | 35.43397 | 0.6683 | 0 | 255 | 550 | 46.36364 | 0.51190 | 0 | 1492 | 4041 | 36.92155 | 0.5546 | 0 | 751 | 7545 | 9.953612 | 0.3559 | 0 | 803 | 12478 | 6.435326 | 0.13310 | 0 | 1756 | 15.423803 | 0.6665 | 0 | 3042 | 26.71937 | 0.7280 | 0 | 1556 | 9021 | 17.24864 | 0.6195 | 0 | 336 | 3110 | 10.80386 | 0.3143 | 0 | 62 | 10616 | 0.5840241 | 0.3482 | 0 | 3295 | 11385 | 28.94159 | 0.4817 | 0 | 4350 | 100 | 2.298851 | 0.4559 | 0 | 478 | 10.988506 | 0.6962 | 0 | 20 | 4041 | 0.4949270 | 0.3450 | 0 | 192 | 4041 | 4.751299 | 0.4900 | 0 | 387 | 11385 | 3.399209 | 0.8606 | 1 | 2.00130 | 0.3396 | 0 | 2.6765 | 0.5915 | 0 | 0.4817 | 0.4753 | 0 | 2.8477 | 0.6611 | 1 | 8.00720 | 0.5007 | 1 | 16537 | 5776 | 5768 | 2288 | 16141 | 14.17508 | 0.3194 | 0 | 237 | 8403 | 2.820421 | 0.2461 | 0 | 1493 | 4973 | 30.02212 | 0.8197 | 1 | 315 | 795 | 39.62264 | 0.3868 | 0 | 1808 | 5768 | 31.34535 | 0.5823 | 0 | 986 | 11516 | 8.562001 | 0.4338 | 0 | 1326 | 15886 | 8.346972 | 0.4327 | 0 | 2472 | 14.94830 | 0.4225 | 0 | 3814 | 23.06343 | 0.6287 | 0 | 1742 | 12086.000 | 14.41337 | 0.4347 | 0 | 742 | 4396.0000 | 16.87898 | 0.5844 | 0 | 185 | 15466 | 1.1961722 | 0.50680 | 0 | 7164 | 16537.000 | 43.32104 | 0.5828 | 0 | 5776 | 138 | 2.3891967 | 0.4352 | 0 | 385 | 6.665513 | 0.6600 | 0 | 0 | 5768 | 0.0000000 | 0.1168 | 0 | 165 | 5768.0000 | 2.860610 | 0.3442 | 0 | 373 | 16537 | 2.255548 | 0.8244 | 1 | 2.0143 | 0.3437 | 0 | 2.57710 | 0.5357 | 0 | 0.5828 | 0.5757 | 0 | 2.3806 | 0.4199 | 1 | 7.55480 | 0.4282 | 1 | NA | NA |
| 10001040203 | 10 | 001 | 040203 | DE | Delaware | Kent County | 3 | South Region | 5 | South Atlantic Division | 4643 | 1865 | 1718 | 1441 | 4597 | 31.346530 | 0.7241 | 0 | 99 | 2296 | 4.311847 | 0.2007 | 0 | 362 | 1223 | 29.59935 | 0.4754 | 0 | 271 | 495 | 54.74747 | 0.70810 | 0 | 633 | 1718 | 36.84517 | 0.5523 | 0 | 436 | 2783 | 15.666547 | 0.5647 | 0 | 258 | 5110 | 5.048924 | 0.08961 | 0 | 505 | 10.876588 | 0.3849 | 0 | 1390 | 29.93754 | 0.8755 | 1 | 646 | 3590 | 17.99443 | 0.6562 | 0 | 292 | 1181 | 24.72481 | 0.7632 | 1 | 20 | 4310 | 0.4640371 | 0.3134 | 0 | 1780 | 4643 | 38.33728 | 0.5942 | 0 | 1865 | 91 | 4.879357 | 0.5508 | 0 | 252 | 13.512064 | 0.7236 | 0 | 52 | 1718 | 3.0267753 | 0.7465 | 0 | 197 | 1718 | 11.466822 | 0.7913 | 1 | 0 | 4643 | 0.000000 | 0.3814 | 0 | 2.13141 | 0.3754 | 0 | 2.9932 | 0.7618 | 2 | 0.5942 | 0.5863 | 0 | 3.1936 | 0.8133 | 1 | 8.91241 | 0.6347 | 3 | 5310 | 2259 | 2097 | 1163 | 5283 | 22.01401 | 0.5368 | 0 | 69 | 2413 | 2.859511 | 0.2514 | 0 | 418 | 1516 | 27.57256 | 0.7526 | 1 | 382 | 581 | 65.74871 | 0.9074 | 1 | 800 | 2097 | 38.14974 | 0.7609 | 1 | 162 | 3597 | 4.503753 | 0.2087 | 0 | 704 | 5297 | 13.290542 | 0.7059 | 0 | 1320 | 24.85876 | 0.8299 | 1 | 1429 | 26.91149 | 0.8347 | 1 | 513 | 3868.000 | 13.26267 | 0.3691 | 0 | 290 | 1430.0000 | 20.27972 | 0.6849 | 0 | 34 | 5062 | 0.6716713 | 0.39280 | 0 | 2582 | 5310.000 | 48.62524 | 0.6381 | 0 | 2259 | 153 | 6.7729084 | 0.5732 | 0 | 291 | 12.881806 | 0.7430 | 0 | 45 | 2097 | 2.1459227 | 0.6153 | 0 | 71 | 2097.0000 | 3.385789 | 0.3952 | 0 | 5 | 5310 | 0.094162 | 0.4618 | 0 | 2.4637 | 0.4806 | 1 | 3.11140 | 0.8223 | 2 | 0.6381 | 0.6303 | 0 | 2.7885 | 0.6181 | 0 | 9.00170 | 0.6555 | 3 | 4 | 537986 |
| 10001040501 | 10 | 001 | 040501 | DE | Delaware | Kent County | 3 | South Region | 5 | South Atlantic Division | 5172 | 2061 | 1721 | 2008 | 5121 | 39.211092 | 0.8425 | 1 | 134 | 1988 | 6.740443 | 0.4302 | 0 | 443 | 1191 | 37.19563 | 0.7145 | 0 | 312 | 530 | 58.86792 | 0.78710 | 1 | 755 | 1721 | 43.86984 | 0.7444 | 0 | 486 | 3108 | 15.637066 | 0.5640 | 0 | 493 | 4902 | 10.057120 | 0.26220 | 0 | 700 | 13.534416 | 0.5573 | 0 | 1681 | 32.50193 | 0.9414 | 1 | 518 | 3508 | 14.76625 | 0.4887 | 0 | 580 | 1392 | 41.66667 | 0.9424 | 1 | 12 | 4692 | 0.2557545 | 0.2451 | 0 | 3222 | 5172 | 62.29698 | 0.7880 | 1 | 2061 | 281 | 13.634158 | 0.7133 | 0 | 223 | 10.819990 | 0.6938 | 0 | 139 | 1721 | 8.0766996 | 0.9538 | 1 | 63 | 1721 | 3.660662 | 0.3972 | 0 | 0 | 5172 | 0.000000 | 0.3814 | 0 | 2.84330 | 0.5967 | 1 | 3.1749 | 0.8372 | 2 | 0.7880 | 0.7776 | 1 | 3.1395 | 0.7936 | 1 | 9.94570 | 0.7681 | 5 | 4731 | 2061 | 1979 | 1016 | 4703 | 21.60323 | 0.5269 | 0 | 208 | 2511 | 8.283552 | 0.8001 | 1 | 402 | 1423 | 28.25018 | 0.7714 | 1 | 300 | 556 | 53.95683 | 0.7197 | 0 | 702 | 1979 | 35.47246 | 0.6995 | 0 | 412 | 3336 | 12.350120 | 0.6094 | 0 | 230 | 4731 | 4.861552 | 0.2173 | 0 | 964 | 20.37624 | 0.6876 | 0 | 926 | 19.57303 | 0.4025 | 0 | 959 | 3805.000 | 25.20368 | 0.8859 | 1 | 278 | 1180.0000 | 23.55932 | 0.7634 | 1 | 244 | 4465 | 5.4647256 | 0.82700 | 1 | 2404 | 4731.000 | 50.81378 | 0.6589 | 0 | 2061 | 260 | 12.6152353 | 0.6783 | 0 | 299 | 14.507521 | 0.7619 | 1 | 39 | 1979 | 1.9706923 | 0.5899 | 0 | 133 | 1979.0000 | 6.720566 | 0.6323 | 0 | 0 | 4731 | 0.000000 | 0.2111 | 0 | 2.8532 | 0.6053 | 1 | 3.56640 | 0.9479 | 3 | 0.6589 | 0.6509 | 0 | 2.8735 | 0.6632 | 1 | 9.95200 | 0.7755 | 5 | NA | NA |
| 10001040502 | 10 | 001 | 040502 | DE | Delaware | Kent County | 3 | South Region | 5 | South Atlantic Division | 2087 | 921 | 921 | 192 | 2087 | 9.199808 | 0.1738 | 0 | 35 | 722 | 4.847645 | 0.2495 | 0 | 281 | 700 | 40.14286 | 0.7819 | 1 | 64 | 221 | 28.95928 | 0.17110 | 0 | 345 | 921 | 37.45928 | 0.5710 | 0 | 284 | 1546 | 18.369987 | 0.6484 | 0 | 119 | 2121 | 5.610561 | 0.10710 | 0 | 518 | 24.820316 | 0.9068 | 1 | 480 | 22.99952 | 0.4910 | 0 | 328 | 1527 | 21.48003 | 0.7959 | 1 | 173 | 680 | 25.44118 | 0.7769 | 1 | 100 | 1998 | 5.0050050 | 0.7960 | 1 | 560 | 2087 | 26.83277 | 0.4524 | 0 | 921 | 0 | 0.000000 | 0.1428 | 0 | 273 | 29.641694 | 0.8785 | 1 | 0 | 921 | 0.0000000 | 0.1488 | 0 | 30 | 921 | 3.257329 | 0.3600 | 0 | 0 | 2087 | 0.000000 | 0.3814 | 0 | 1.74980 | 0.2670 | 0 | 3.7666 | 0.9666 | 4 | 0.4524 | 0.4464 | 0 | 1.9115 | 0.2071 | 1 | 7.88030 | 0.4785 | 5 | 2555 | 1030 | 954 | 565 | 2555 | 22.11350 | 0.5385 | 0 | 135 | 1154 | 11.698440 | 0.9175 | 1 | 144 | 691 | 20.83936 | 0.4865 | 0 | 168 | 262 | 64.12214 | 0.8894 | 1 | 312 | 953 | 32.73872 | 0.6259 | 0 | 192 | 1782 | 10.774411 | 0.5377 | 0 | 198 | 2519 | 7.860262 | 0.4016 | 0 | 519 | 20.31311 | 0.6851 | 0 | 664 | 25.98826 | 0.7939 | 1 | 341 | 1854.295 | 18.38974 | 0.6427 | 0 | 195 | 614.6519 | 31.72527 | 0.8870 | 1 | 75 | 2351 | 3.1901319 | 0.72360 | 0 | 1215 | 2555.353 | 47.54725 | 0.6272 | 0 | 1030 | 61 | 5.9223301 | 0.5514 | 0 | 170 | 16.504854 | 0.7844 | 1 | 58 | 954 | 6.0796646 | 0.8947 | 1 | 83 | 953.5886 | 8.703963 | 0.7220 | 0 | 0 | 2555 | 0.000000 | 0.2111 | 0 | 3.0212 | 0.6565 | 1 | 3.73230 | 0.9680 | 2 | 0.6272 | 0.6195 | 0 | 3.1636 | 0.7893 | 2 | 10.54430 | 0.8433 | 5 | 2 | 245978 |
svi_national_lihtc10 <- left_join(svi_national, lihtc_projects10, join_by("GEOID_2010_trt" == "fips2010"))

svi_national_lihtc10 %>% head() %>% kbl() %>% kable_styling() %>% scroll_box(width = "100%")
| GEOID_2010_trt | FIPS_st | FIPS_county | FIPS_tract | state | state_name | county | region_number | region | division_number | division | E_TOTPOP_10 | E_HU_10 | E_HH_10 | E_POV150_10 | ET_POVSTATUS_10 | EP_POV150_10 | EPL_POV150_10 | F_POV150_10 | E_UNEMP_10 | ET_EMPSTATUS_10 | EP_UNEMP_10 | EPL_UNEMP_10 | F_UNEMP_10 | E_HBURD_OWN_10 | ET_HOUSINGCOST_OWN_10 | EP_HBURD_OWN_10 | EPL_HBURD_OWN_10 | F_HBURD_OWN_10 | E_HBURD_RENT_10 | ET_HOUSINGCOST_RENT_10 | EP_HBURD_RENT_10 | EPL_HBURD_RENT_10 | F_HBURD_RENT_10 | E_HBURD_10 | ET_HOUSINGCOST_10 | EP_HBURD_10 | EPL_HBURD_10 | F_HBURD_10 | E_NOHSDP_10 | ET_EDSTATUS_10 | EP_NOHSDP_10 | EPL_NOHSDP_10 | F_NOHSDP_10 | E_UNINSUR_12 | ET_INSURSTATUS_12 | EP_UNINSUR_12 | EPL_UNINSUR_12 | F_UNINSUR_12 | E_AGE65_10 | EP_AGE65_10 | EPL_AGE65_10 | F_AGE65_10 | E_AGE17_10 | EP_AGE17_10 | EPL_AGE17_10 | F_AGE17_10 | E_DISABL_12 | ET_DISABLSTATUS_12 | EP_DISABL_12 | EPL_DISABL_12 | F_DISABL_12 | E_SNGPNT_10 | ET_FAMILIES_10 | EP_SNGPNT_10 | EPL_SNGPNT_10 | F_SNGPNT_10 | E_LIMENG_10 | ET_POPAGE5UP_10 | EP_LIMENG_10 | EPL_LIMENG_10 | F_LIMENG_10 | E_MINRTY_10 | ET_POPETHRACE_10 | EP_MINRTY_10 | EPL_MINRTY_10 | F_MINRTY_10 | E_STRHU_10 | E_MUNIT_10 | EP_MUNIT_10 | EPL_MUNIT_10 | F_MUNIT_10 | E_MOBILE_10 | EP_MOBILE_10 | EPL_MOBILE_10 | F_MOBILE_10 | E_CROWD_10 | ET_OCCUPANTS_10 | EP_CROWD_10 | EPL_CROWD_10 | F_CROWD_10 | E_NOVEH_10 | ET_KNOWNVEH_10 | EP_NOVEH_10 | EPL_NOVEH_10 | F_NOVEH_10 | E_GROUPQ_10 | ET_HHTYPE_10 | EP_GROUPQ_10 | EPL_GROUPQ_10 | F_GROUPQ_10 | SPL_THEME1_10 | RPL_THEME1_10 | F_THEME1_10 | SPL_THEME2_10 | RPL_THEME2_10 | F_THEME2_10 | SPL_THEME3_10 | RPL_THEME3_10 | F_THEME3_10 | SPL_THEME4_10 | RPL_THEME4_10 | F_THEME4_10 | SPL_THEMES_10 | RPL_THEMES_10 | F_TOTAL_10 | E_TOTPOP_20 | E_HU_20 | E_HH_20 | E_POV150_20 | ET_POVSTATUS_20 | EP_POV150_20 | EPL_POV150_20 | F_POV150_20 | E_UNEMP_20 | ET_EMPSTATUS_20 | EP_UNEMP_20 | EPL_UNEMP_20 | F_UNEMP_20 | E_HBURD_OWN_20 | ET_HOUSINGCOST_OWN_20 | EP_HBURD_OWN_20 | EPL_HBURD_OWN_20 | F_HBURD_OWN_20 | E_HBURD_RENT_20 | ET_HOUSINGCOST_RENT_20 | EP_HBURD_RENT_20 | EPL_HBURD_RENT_20 | F_HBURD_RENT_20 | E_HBURD_20 | ET_HOUSINGCOST_20 | EP_HBURD_20 | EPL_HBURD_20 | F_HBURD_20 | E_NOHSDP_20 | ET_EDSTATUS_20 | EP_NOHSDP_20 | EPL_NOHSDP_20 | F_NOHSDP_20 | E_UNINSUR_20 | ET_INSURSTATUS_20 | EP_UNINSUR_20 | EPL_UNINSUR_20 | F_UNINSUR_20 | E_AGE65_20 | EP_AGE65_20 | EPL_AGE65_20 | F_AGE65_20 | E_AGE17_20 | EP_AGE17_20 | EPL_AGE17_20 | F_AGE17_20 | E_DISABL_20 | ET_DISABLSTATUS_20 | EP_DISABL_20 | EPL_DISABL_20 | F_DISABL_20 | E_SNGPNT_20 | ET_FAMILIES_20 | EP_SNGPNT_20 | EPL_SNGPNT_20 | F_SNGPNT_20 | E_LIMENG_20 | ET_POPAGE5UP_20 | EP_LIMENG_20 | EPL_LIMENG_20 | F_LIMENG_20 | E_MINRTY_20 | ET_POPETHRACE_20 | EP_MINRTY_20 | EPL_MINRTY_20 | F_MINRTY_20 | E_STRHU_20 | E_MUNIT_20 | EP_MUNIT_20 | EPL_MUNIT_20 | F_MUNIT_20 | E_MOBILE_20 | EP_MOBILE_20 | EPL_MOBILE_20 | F_MOBILE_20 | E_CROWD_20 | ET_OCCUPANTS_20 | EP_CROWD_20 | EPL_CROWD_20 | F_CROWD_20 | E_NOVEH_20 | ET_KNOWNVEH_20 | EP_NOVEH_20 | EPL_NOVEH_20 | F_NOVEH_20 | E_GROUPQ_20 | ET_HHTYPE_20 | EP_GROUPQ_20 | EPL_GROUPQ_20 | F_GROUPQ_20 | SPL_THEME1_20 | RPL_THEME1_20 | F_THEME1_20 | SPL_THEME2_20 | RPL_THEME2_20 | F_THEME2_20 | SPL_THEME3_20 | RPL_THEME3_20 | F_THEME3_20 | SPL_THEME4_20 | RPL_THEME4_20 | F_THEME4_20 | SPL_THEMES_20 | RPL_THEMES_20 | F_TOTAL_20 | pre10_lihtc_project_cnt | pre10_lihtc_project_dollars |
|---|---|---|---|---|---|---|---|---|---|---|---|---|---|---|---|---|---|---|---|---|---|---|---|---|---|---|---|---|---|---|---|---|---|---|---|---|---|---|---|---|---|---|---|---|---|---|---|---|---|---|---|---|---|---|---|---|---|---|---|---|---|---|---|---|---|---|---|---|---|---|---|---|---|---|---|---|---|---|---|---|---|---|---|---|---|---|---|---|---|---|---|---|---|---|---|---|---|---|---|---|---|---|---|---|---|---|---|---|---|---|---|---|---|---|---|---|---|---|---|---|---|---|---|---|---|---|---|---|---|---|---|---|---|---|---|---|---|---|---|---|---|---|---|---|---|---|---|---|---|---|---|---|---|---|---|---|---|---|---|---|---|---|---|---|---|---|---|---|---|---|---|---|---|---|---|---|---|---|---|---|---|---|---|---|---|---|---|---|---|---|---|---|---|---|---|---|---|---|---|---|---|---|---|---|---|---|---|---|---|---|---|---|---|---|---|---|---|---|---|---|---|---|
| 01001020100 | 01 | 001 | 020100 | AL | Alabama | Autauga County | 3 | South Region | 6 | East South Central Division | 1809 | 771 | 696 | 297 | 1809 | 16.41791 | 0.3871 | 0 | 36 | 889 | 4.049494 | 0.1790 | 0 | 127 | 598 | 21.23746 | 0.20770 | 0 | 47 | 98 | 47.95918 | 0.5767 | 0 | 174 | 696 | 25.00000 | 0.18790 | 0 | 196 | 1242 | 15.780998 | 0.6093 | 0 | 186 | 1759 | 10.574190 | 0.3790 | 0 | 222 | 12.271973 | 0.4876 | 0 | 445 | 24.59923 | 0.5473 | 0 | 298 | 1335 | 22.32210 | 0.8454 | 1 | 27 | 545 | 4.954128 | 0.09275 | 0 | 36 | 1705 | 2.1114370 | 0.59040 | 0 | 385 | 1809 | 21.282477 | 0.4524 | 0 | 771 | 0 | 0.0000000 | 0.1224 | 0 | 92 | 11.9325551 | 0.8005 | 1 | 0 | 696 | 0.0000000 | 0.1238 | 0 | 50 | 696 | 7.183908 | 0.6134 | 0 | 0 | 1809 | 0 | 0.364 | 0 | 1.74230 | 0.28200 | 0 | 2.56345 | 0.5296 | 1 | 0.4524 | 0.4482 | 0 | 2.0241 | 0.2519 | 1 | 6.78225 | 0.3278 | 2 | 1941 | 710 | 693 | 352 | 1941 | 18.13498 | 0.4630 | 0 | 18 | 852 | 2.112676 | 0.15070 | 0 | 81 | 507 | 15.976331 | 0.26320 | 0 | 63 | 186 | 33.87097 | 0.2913 | 0 | 144 | 693 | 20.77922 | 0.2230 | 0 | 187 | 1309 | 14.285714 | 0.6928 | 0 | 187 | 1941 | 9.634209 | 0.6617 | 0 | 295 | 15.19835 | 0.4601 | 0 | 415 | 21.38073 | 0.4681 | 0 | 391 | 1526 | 25.62254 | 0.9011 | 1 | 58 | 555 | 10.45045 | 0.3451 | 0 | 0 | 1843 | 0.0000000 | 0.09479 | 0 | 437 | 1941 | 22.51417 | 0.3902 | 0 | 710 | 0 | 0.0000000 | 0.1079 | 0 | 88 | 12.3943662 | 0.8263 | 1 | 0 | 693 | 0.0000000 | 0.09796 | 0 | 10 | 693 | 1.443001 | 0.1643 | 0 | 0 | 1941 | 0.000000 | 0.1831 | 0 | 2.19120 | 0.4084 | 0 | 2.26919 | 0.3503 | 1 | 0.3902 | 0.3869 | 0 | 1.37956 | 0.07216 | 1 | 6.23015 | 0.2314 | 2 | NA | NA |
| 01001020200 | 01 | 001 | 020200 | AL | Alabama | Autauga County | 3 | South Region | 6 | East South Central Division | 2020 | 816 | 730 | 495 | 1992 | 24.84940 | 0.5954 | 0 | 68 | 834 | 8.153477 | 0.5754 | 0 | 49 | 439 | 11.16173 | 0.02067 | 0 | 105 | 291 | 36.08247 | 0.3019 | 0 | 154 | 730 | 21.09589 | 0.09312 | 0 | 339 | 1265 | 26.798419 | 0.8392 | 1 | 313 | 2012 | 15.556660 | 0.6000 | 0 | 204 | 10.099010 | 0.3419 | 0 | 597 | 29.55446 | 0.8192 | 1 | 359 | 1515 | 23.69637 | 0.8791 | 1 | 132 | 456 | 28.947368 | 0.83510 | 1 | 15 | 1890 | 0.7936508 | 0.40130 | 0 | 1243 | 2020 | 61.534653 | 0.7781 | 1 | 816 | 0 | 0.0000000 | 0.1224 | 0 | 34 | 4.1666667 | 0.6664 | 0 | 13 | 730 | 1.7808219 | 0.5406 | 0 | 115 | 730 | 15.753425 | 0.8382 | 1 | 0 | 2020 | 0 | 0.364 | 0 | 2.70312 | 0.56650 | 1 | 3.27660 | 0.8614 | 3 | 0.7781 | 0.7709 | 1 | 2.5316 | 0.5047 | 1 | 9.28942 | 0.6832 | 6 | 1757 | 720 | 573 | 384 | 1511 | 25.41363 | 0.6427 | 0 | 29 | 717 | 4.044630 | 0.41320 | 0 | 33 | 392 | 8.418367 | 0.03542 | 0 | 116 | 181 | 64.08840 | 0.9086 | 1 | 149 | 573 | 26.00349 | 0.4041 | 0 | 139 | 1313 | 10.586443 | 0.5601 | 0 | 91 | 1533 | 5.936073 | 0.4343 | 0 | 284 | 16.16392 | 0.5169 | 0 | 325 | 18.49744 | 0.2851 | 0 | 164 | 1208 | 13.57616 | 0.4127 | 0 | 42 | 359 | 11.69916 | 0.3998 | 0 | 0 | 1651 | 0.0000000 | 0.09479 | 0 | 1116 | 1757 | 63.51736 | 0.7591 | 1 | 720 | 3 | 0.4166667 | 0.2470 | 0 | 5 | 0.6944444 | 0.5106 | 0 | 9 | 573 | 1.5706806 | 0.46880 | 0 | 57 | 573 | 9.947644 | 0.7317 | 0 | 212 | 1757 | 12.066022 | 0.9549 | 1 | 2.45440 | 0.4888 | 0 | 1.70929 | 0.1025 | 0 | 0.7591 | 0.7527 | 1 | 2.91300 | 0.68620 | 1 | 7.83579 | 0.4802 | 2 | NA | NA |
| 01001020300 | 01 | 001 | 020300 | AL | Alabama | Autauga County | 3 | South Region | 6 | East South Central Division | 3543 | 1403 | 1287 | 656 | 3533 | 18.56779 | 0.4443 | 0 | 93 | 1552 | 5.992268 | 0.3724 | 0 | 273 | 957 | 28.52665 | 0.45780 | 0 | 178 | 330 | 53.93939 | 0.7152 | 0 | 451 | 1287 | 35.04274 | 0.49930 | 0 | 346 | 2260 | 15.309734 | 0.5950 | 0 | 252 | 3102 | 8.123791 | 0.2596 | 0 | 487 | 13.745413 | 0.5868 | 0 | 998 | 28.16822 | 0.7606 | 1 | 371 | 2224 | 16.68165 | 0.6266 | 0 | 126 | 913 | 13.800657 | 0.46350 | 0 | 0 | 3365 | 0.0000000 | 0.09298 | 0 | 637 | 3543 | 17.979114 | 0.4049 | 0 | 1403 | 10 | 0.7127584 | 0.3015 | 0 | 2 | 0.1425517 | 0.4407 | 0 | 0 | 1287 | 0.0000000 | 0.1238 | 0 | 101 | 1287 | 7.847708 | 0.6443 | 0 | 0 | 3543 | 0 | 0.364 | 0 | 2.17060 | 0.41010 | 0 | 2.53048 | 0.5116 | 1 | 0.4049 | 0.4011 | 0 | 1.8743 | 0.1942 | 0 | 6.98028 | 0.3576 | 1 | 3694 | 1464 | 1351 | 842 | 3694 | 22.79372 | 0.5833 | 0 | 53 | 1994 | 2.657974 | 0.22050 | 0 | 117 | 967 | 12.099276 | 0.11370 | 0 | 147 | 384 | 38.28125 | 0.3856 | 0 | 264 | 1351 | 19.54108 | 0.1827 | 0 | 317 | 2477 | 12.797739 | 0.6460 | 0 | 127 | 3673 | 3.457664 | 0.2308 | 0 | 464 | 12.56091 | 0.3088 | 0 | 929 | 25.14889 | 0.7080 | 0 | 473 | 2744 | 17.23761 | 0.6211 | 0 | 263 | 975 | 26.97436 | 0.8234 | 1 | 128 | 3586 | 3.5694367 | 0.70770 | 0 | 1331 | 3694 | 36.03140 | 0.5515 | 0 | 1464 | 26 | 1.7759563 | 0.3675 | 0 | 14 | 0.9562842 | 0.5389 | 0 | 35 | 1351 | 2.5906736 | 0.60550 | 0 | 42 | 1351 | 3.108808 | 0.3415 | 0 | 0 | 3694 | 0.000000 | 0.1831 | 0 | 1.86330 | 0.3063 | 0 | 3.16900 | 0.8380 | 1 | 0.5515 | 0.5468 | 0 | 2.03650 | 0.26830 | 0 | 7.62030 | 0.4460 | 1 | 2 | 216593 |
| 01001020400 | 01 | 001 | 020400 | AL | Alabama | Autauga County | 3 | South Region | 6 | East South Central Division | 4840 | 1957 | 1839 | 501 | 4840 | 10.35124 | 0.2177 | 0 | 101 | 2129 | 4.744011 | 0.2447 | 0 | 310 | 1549 | 20.01291 | 0.17080 | 0 | 89 | 290 | 30.68966 | 0.2044 | 0 | 399 | 1839 | 21.69657 | 0.10540 | 0 | 274 | 3280 | 8.353658 | 0.3205 | 0 | 399 | 4293 | 9.294200 | 0.3171 | 0 | 955 | 19.731405 | 0.8643 | 1 | 1195 | 24.69008 | 0.5530 | 0 | 625 | 3328 | 18.78005 | 0.7233 | 0 | 152 | 1374 | 11.062591 | 0.34710 | 0 | 10 | 4537 | 0.2204100 | 0.22560 | 0 | 297 | 4840 | 6.136364 | 0.1647 | 0 | 1957 | 33 | 1.6862545 | 0.3843 | 0 | 25 | 1.2774655 | 0.5516 | 0 | 14 | 1839 | 0.7612833 | 0.3564 | 0 | 19 | 1839 | 1.033170 | 0.1127 | 0 | 0 | 4840 | 0 | 0.364 | 0 | 1.20540 | 0.13470 | 0 | 2.71330 | 0.6129 | 1 | 0.1647 | 0.1632 | 0 | 1.7690 | 0.1591 | 0 | 5.85240 | 0.1954 | 1 | 3539 | 1741 | 1636 | 503 | 3539 | 14.21305 | 0.3472 | 0 | 39 | 1658 | 2.352232 | 0.17990 | 0 | 219 | 1290 | 16.976744 | 0.30880 | 0 | 74 | 346 | 21.38728 | 0.1037 | 0 | 293 | 1636 | 17.90954 | 0.1333 | 0 | 173 | 2775 | 6.234234 | 0.3351 | 0 | 169 | 3529 | 4.788892 | 0.3448 | 0 | 969 | 27.38062 | 0.9225 | 1 | 510 | 14.41085 | 0.1208 | 0 | 670 | 3019 | 22.19278 | 0.8194 | 1 | 148 | 1137 | 13.01671 | 0.4541 | 0 | 89 | 3409 | 2.6107363 | 0.64690 | 0 | 454 | 3539 | 12.82848 | 0.2364 | 0 | 1741 | 143 | 8.2136703 | 0.6028 | 0 | 0 | 0.0000000 | 0.2186 | 0 | 10 | 1636 | 0.6112469 | 0.28340 | 0 | 72 | 1636 | 4.400978 | 0.4538 | 0 | 0 | 3539 | 0.000000 | 0.1831 | 0 | 1.34030 | 0.1575 | 0 | 2.96370 | 0.7496 | 2 | 0.2364 | 0.2344 | 0 | 1.74170 | 0.16270 | 0 | 6.28210 | 0.2389 | 2 | NA | NA |
| 01001020500 | 01 | 001 | 020500 | AL | Alabama | Autauga County | 3 | South Region | 6 | East South Central Division | 9938 | 3969 | 3741 | 1096 | 9938 | 11.02838 | 0.2364 | 0 | 188 | 4937 | 3.807981 | 0.1577 | 0 | 426 | 2406 | 17.70574 | 0.11050 | 0 | 528 | 1335 | 39.55056 | 0.3753 | 0 | 954 | 3741 | 25.50120 | 0.20140 | 0 | 293 | 5983 | 4.897209 | 0.1655 | 0 | 740 | 10110 | 7.319486 | 0.2211 | 0 | 837 | 8.422218 | 0.2408 | 0 | 3012 | 30.30791 | 0.8455 | 1 | 759 | 7155 | 10.60797 | 0.2668 | 0 | 476 | 2529 | 18.821669 | 0.63540 | 0 | 78 | 9297 | 0.8389803 | 0.41110 | 0 | 1970 | 9938 | 19.822902 | 0.4330 | 0 | 3969 | 306 | 7.7097506 | 0.6153 | 0 | 0 | 0.0000000 | 0.2198 | 0 | 7 | 3741 | 0.1871157 | 0.2535 | 0 | 223 | 3741 | 5.960973 | 0.5483 | 0 | 0 | 9938 | 0 | 0.364 | 0 | 0.98210 | 0.08468 | 0 | 2.39960 | 0.4381 | 1 | 0.4330 | 0.4290 | 0 | 2.0009 | 0.2430 | 0 | 5.81560 | 0.1905 | 1 | 10674 | 4504 | 4424 | 1626 | 10509 | 15.47245 | 0.3851 | 0 | 81 | 5048 | 1.604596 | 0.09431 | 0 | 321 | 2299 | 13.962592 | 0.17970 | 0 | 711 | 2125 | 33.45882 | 0.2836 | 0 | 1032 | 4424 | 23.32731 | 0.3109 | 0 | 531 | 6816 | 7.790493 | 0.4251 | 0 | 301 | 10046 | 2.996217 | 0.1894 | 0 | 1613 | 15.11149 | 0.4553 | 0 | 2765 | 25.90407 | 0.7494 | 0 | 1124 | 7281 | 15.43744 | 0.5253 | 0 | 342 | 2912 | 11.74451 | 0.4019 | 0 | 52 | 9920 | 0.5241935 | 0.35230 | 0 | 2603 | 10674 | 24.38636 | 0.4160 | 0 | 4504 | 703 | 15.6083481 | 0.7378 | 0 | 29 | 0.6438721 | 0.5037 | 0 | 37 | 4424 | 0.8363472 | 0.33420 | 0 | 207 | 4424 | 4.679023 | 0.4754 | 0 | 176 | 10674 | 1.648866 | 0.7598 | 1 | 1.40481 | 0.1743 | 0 | 2.48420 | 0.4802 | 0 | 0.4160 | 0.4125 | 0 | 2.81090 | 0.63730 | 1 | 7.11591 | 0.3654 | 1 | 5 | 2250459 |
| 01001020600 | 01 | 001 | 020600 | AL | Alabama | Autauga County | 3 | South Region | 6 | East South Central Division | 3402 | 1456 | 1308 | 735 | 3402 | 21.60494 | 0.5199 | 0 | 134 | 1720 | 7.790698 | 0.5436 | 0 | 242 | 1032 | 23.44961 | 0.28010 | 0 | 62 | 276 | 22.46377 | 0.1035 | 0 | 304 | 1308 | 23.24159 | 0.14070 | 0 | 301 | 2151 | 13.993491 | 0.5510 | 0 | 355 | 3445 | 10.304790 | 0.3656 | 0 | 386 | 11.346267 | 0.4232 | 0 | 931 | 27.36626 | 0.7200 | 0 | 440 | 2439 | 18.04018 | 0.6912 | 0 | 143 | 924 | 15.476190 | 0.52900 | 0 | 4 | 3254 | 0.1229256 | 0.19840 | 0 | 723 | 3402 | 21.252205 | 0.4519 | 0 | 1456 | 18 | 1.2362637 | 0.3507 | 0 | 433 | 29.7390110 | 0.9468 | 1 | 16 | 1308 | 1.2232416 | 0.4493 | 0 | 28 | 1308 | 2.140673 | 0.2298 | 0 | 0 | 3402 | 0 | 0.364 | 0 | 2.12080 | 0.39510 | 0 | 2.56180 | 0.5288 | 0 | 0.4519 | 0.4477 | 0 | 2.3406 | 0.4048 | 1 | 7.47510 | 0.4314 | 1 | 3536 | 1464 | 1330 | 1279 | 3523 | 36.30429 | 0.8215 | 1 | 34 | 1223 | 2.780049 | 0.23780 | 0 | 321 | 1111 | 28.892889 | 0.75870 | 1 | 67 | 219 | 30.59361 | 0.2305 | 0 | 388 | 1330 | 29.17293 | 0.5075 | 0 | 306 | 2380 | 12.857143 | 0.6480 | 0 | 415 | 3496 | 11.870709 | 0.7535 | 1 | 547 | 15.46946 | 0.4760 | 0 | 982 | 27.77149 | 0.8327 | 1 | 729 | 2514 | 28.99761 | 0.9488 | 1 | 95 | 880 | 10.79545 | 0.3601 | 0 | 0 | 3394 | 0.0000000 | 0.09479 | 0 | 985 | 3536 | 27.85633 | 0.4608 | 0 | 1464 | 0 | 0.0000000 | 0.1079 | 0 | 364 | 24.8633880 | 0.9300 | 1 | 0 | 1330 | 0.0000000 | 0.09796 | 0 | 17 | 1330 | 1.278196 | 0.1463 | 0 | 0 | 3536 | 0.000000 | 0.1831 | 0 | 2.96830 | 0.6434 | 2 | 2.71239 | 0.6156 | 2 | 0.4608 | 0.4569 | 0 | 1.46526 | 0.08976 | 1 | 7.60675 | 0.4440 | 5 | NA | NA |
svi_divisional_lihtc20 <- left_join(svi_divisional_lihtc10, lihtc_projects20, join_by("GEOID_2010_trt" == "fips2010"))

svi_divisional_lihtc20 %>% head() %>% kbl() %>% kable_styling() %>% scroll_box(width = "100%")
| GEOID_2010_trt | FIPS_st | FIPS_county | FIPS_tract | state | state_name | county | region_number | region | division_number | division | E_TOTPOP_10 | E_HU_10 | E_HH_10 | E_POV150_10 | ET_POVSTATUS_10 | EP_POV150_10 | EPL_POV150_10 | F_POV150_10 | E_UNEMP_10 | ET_EMPSTATUS_10 | EP_UNEMP_10 | EPL_UNEMP_10 | F_UNEMP_10 | E_HBURD_OWN_10 | ET_HOUSINGCOST_OWN_10 | EP_HBURD_OWN_10 | EPL_HBURD_OWN_10 | F_HBURD_OWN_10 | E_HBURD_RENT_10 | ET_HOUSINGCOST_RENT_10 | EP_HBURD_RENT_10 | EPL_HBURD_RENT_10 | F_HBURD_RENT_10 | E_HBURD_10 | ET_HOUSINGCOST_10 | EP_HBURD_10 | EPL_HBURD_10 | F_HBURD_10 | E_NOHSDP_10 | ET_EDSTATUS_10 | EP_NOHSDP_10 | EPL_NOHSDP_10 | F_NOHSDP_10 | E_UNINSUR_12 | ET_INSURSTATUS_12 | EP_UNINSUR_12 | EPL_UNINSUR_12 | F_UNINSUR_12 | E_AGE65_10 | EP_AGE65_10 | EPL_AGE65_10 | F_AGE65_10 | E_AGE17_10 | EP_AGE17_10 | EPL_AGE17_10 | F_AGE17_10 | E_DISABL_12 | ET_DISABLSTATUS_12 | EP_DISABL_12 | EPL_DISABL_12 | F_DISABL_12 | E_SNGPNT_10 | ET_FAMILIES_10 | EP_SNGPNT_10 | EPL_SNGPNT_10 | F_SNGPNT_10 | E_LIMENG_10 | ET_POPAGE5UP_10 | EP_LIMENG_10 | EPL_LIMENG_10 | F_LIMENG_10 | E_MINRTY_10 | ET_POPETHRACE_10 | EP_MINRTY_10 | EPL_MINRTY_10 | F_MINRTY_10 | E_STRHU_10 | E_MUNIT_10 | EP_MUNIT_10 | EPL_MUNIT_10 | F_MUNIT_10 | E_MOBILE_10 | EP_MOBILE_10 | EPL_MOBILE_10 | F_MOBILE_10 | E_CROWD_10 | ET_OCCUPANTS_10 | EP_CROWD_10 | EPL_CROWD_10 | F_CROWD_10 | E_NOVEH_10 | ET_KNOWNVEH_10 | EP_NOVEH_10 | EPL_NOVEH_10 | F_NOVEH_10 | E_GROUPQ_10 | ET_HHTYPE_10 | EP_GROUPQ_10 | EPL_GROUPQ_10 | F_GROUPQ_10 | SPL_THEME1_10 | RPL_THEME1_10 | F_THEME1_10 | SPL_THEME2_10 | RPL_THEME2_10 | F_THEME2_10 | SPL_THEME3_10 | RPL_THEME3_10 | F_THEME3_10 | SPL_THEME4_10 | RPL_THEME4_10 | F_THEME4_10 | SPL_THEMES_10 | RPL_THEMES_10 | F_TOTAL_10 | E_TOTPOP_20 | E_HU_20 | E_HH_20 | E_POV150_20 | ET_POVSTATUS_20 | EP_POV150_20 | EPL_POV150_20 | F_POV150_20 | E_UNEMP_20 | ET_EMPSTATUS_20 | EP_UNEMP_20 | EPL_UNEMP_20 | F_UNEMP_20 | E_HBURD_OWN_20 | ET_HOUSINGCOST_OWN_20 | EP_HBURD_OWN_20 | EPL_HBURD_OWN_20 | F_HBURD_OWN_20 | E_HBURD_RENT_20 | ET_HOUSINGCOST_RENT_20 | EP_HBURD_RENT_20 | EPL_HBURD_RENT_20 | F_HBURD_RENT_20 | E_HBURD_20 | ET_HOUSINGCOST_20 | EP_HBURD_20 | EPL_HBURD_20 | F_HBURD_20 | E_NOHSDP_20 | ET_EDSTATUS_20 | EP_NOHSDP_20 | EPL_NOHSDP_20 | F_NOHSDP_20 | E_UNINSUR_20 | ET_INSURSTATUS_20 | EP_UNINSUR_20 | EPL_UNINSUR_20 | F_UNINSUR_20 | E_AGE65_20 | EP_AGE65_20 | EPL_AGE65_20 | F_AGE65_20 | E_AGE17_20 | EP_AGE17_20 | EPL_AGE17_20 | F_AGE17_20 | E_DISABL_20 | ET_DISABLSTATUS_20 | EP_DISABL_20 | EPL_DISABL_20 | F_DISABL_20 | E_SNGPNT_20 | ET_FAMILIES_20 | EP_SNGPNT_20 | EPL_SNGPNT_20 | F_SNGPNT_20 | E_LIMENG_20 | ET_POPAGE5UP_20 | EP_LIMENG_20 | EPL_LIMENG_20 | F_LIMENG_20 | E_MINRTY_20 | ET_POPETHRACE_20 | EP_MINRTY_20 | EPL_MINRTY_20 | F_MINRTY_20 | E_STRHU_20 | E_MUNIT_20 | EP_MUNIT_20 | EPL_MUNIT_20 | F_MUNIT_20 | E_MOBILE_20 | EP_MOBILE_20 | EPL_MOBILE_20 | F_MOBILE_20 | E_CROWD_20 | ET_OCCUPANTS_20 | EP_CROWD_20 | EPL_CROWD_20 | F_CROWD_20 | E_NOVEH_20 | ET_KNOWNVEH_20 | EP_NOVEH_20 | EPL_NOVEH_20 | F_NOVEH_20 | E_GROUPQ_20 | ET_HHTYPE_20 | EP_GROUPQ_20 | EPL_GROUPQ_20 | F_GROUPQ_20 | SPL_THEME1_20 | RPL_THEME1_20 | F_THEME1_20 | SPL_THEME2_20 | RPL_THEME2_20 | F_THEME2_20 | SPL_THEME3_20 | RPL_THEME3_20 | F_THEME3_20 | SPL_THEME4_20 | RPL_THEME4_20 | F_THEME4_20 | SPL_THEMES_20 | RPL_THEMES_20 | F_TOTAL_20 | pre10_lihtc_project_cnt | pre10_lihtc_project_dollars | post10_lihtc_project_cnt | post10_lihtc_project_dollars |
|---|---|---|---|---|---|---|---|---|---|---|---|---|---|---|---|---|---|---|---|---|---|---|---|---|---|---|---|---|---|---|---|---|---|---|---|---|---|---|---|---|---|---|---|---|---|---|---|---|---|---|---|---|---|---|---|---|---|---|---|---|---|---|---|---|---|---|---|---|---|---|---|---|---|---|---|---|---|---|---|---|---|---|---|---|---|---|---|---|---|---|---|---|---|---|---|---|---|---|---|---|---|---|---|---|---|---|---|---|---|---|---|---|---|---|---|---|---|---|---|---|---|---|---|---|---|---|---|---|---|---|---|---|---|---|---|---|---|---|---|---|---|---|---|---|---|---|---|---|---|---|---|---|---|---|---|---|---|---|---|---|---|---|---|---|---|---|---|---|---|---|---|---|---|---|---|---|---|---|---|---|---|---|---|---|---|---|---|---|---|---|---|---|---|---|---|---|---|---|---|---|---|---|---|---|---|---|---|---|---|---|---|---|---|---|---|---|---|---|---|---|---|---|---|---|
| 10001040100 | 10 | 001 | 040100 | DE | Delaware | Kent County | 3 | South Region | 5 | South Atlantic Division | 6468 | 2388 | 2272 | 868 | 6455 | 13.446940 | 0.2879 | 0 | 201 | 3230 | 6.222910 | 0.3819 | 0 | 708 | 2036 | 34.77407 | 0.6489 | 0 | 47 | 236 | 19.91525 | 0.07811 | 0 | 755 | 2272 | 33.23063 | 0.4315 | 0 | 691 | 4369 | 15.815976 | 0.5692 | 0 | 400 | 6594 | 6.066121 | 0.12090 | 0 | 688 | 10.636982 | 0.3706 | 0 | 1689 | 26.11317 | 0.6923 | 0 | 725 | 5107 | 14.19620 | 0.4566 | 0 | 209 | 1742 | 11.99770 | 0.3673 | 0 | 0 | 5993 | 0.0000000 | 0.1022 | 0 | 845 | 6468 | 13.06432 | 0.2341 | 0 | 2388 | 0 | 0.000000 | 0.1428 | 0 | 601 | 25.167504 | 0.8423 | 1 | 14 | 2272 | 0.6161972 | 0.3716 | 0 | 92 | 2272 | 4.049296 | 0.4329 | 0 | 0 | 6468 | 0.000000 | 0.3814 | 0 | 1.79140 | 0.2784 | 0 | 1.9890 | 0.2036 | 0 | 0.2341 | 0.2310 | 0 | 2.1710 | 0.3144 | 1 | 6.18550 | 0.2310 | 1 | 7531 | 2850 | 2587 | 2226 | 7519 | 29.60500 | 0.7109 | 0 | 392 | 3820 | 10.261780 | 0.8786 | 1 | 527 | 2067 | 25.49589 | 0.6863 | 0 | 180 | 520 | 34.61538 | 0.2805 | 0 | 707 | 2587 | 27.32895 | 0.4528 | 0 | 765 | 4950 | 15.454546 | 0.7234 | 0 | 353 | 7523 | 4.692277 | 0.2050 | 0 | 1007 | 13.37140 | 0.3312 | 0 | 2035 | 27.02164 | 0.8398 | 1 | 1227 | 5488.000 | 22.35787 | 0.8093 | 1 | 239 | 1893.0000 | 12.62546 | 0.4261 | 0 | 276 | 7262 | 3.8006059 | 0.75930 | 1 | 1507 | 7531.000 | 20.01062 | 0.2789 | 0 | 2850 | 1 | 0.0350877 | 0.2526 | 0 | 697 | 24.456140 | 0.8585 | 1 | 93 | 2587 | 3.5948976 | 0.7607 | 1 | 55 | 2587.0000 | 2.126015 | 0.2641 | 0 | 0 | 7531 | 0.000000 | 0.2111 | 0 | 2.9707 | 0.6413 | 1 | 3.16570 | 0.8440 | 3 | 0.2789 | 0.2755 | 0 | 2.3470 | 0.4035 | 2 | 8.76230 | 0.6215 | 6 | NA | NA | NA | NA |
| 10001040201 | 10 | 001 | 040201 | DE | Delaware | Kent County | 3 | South Region | 5 | South Atlantic Division | 5208 | 1953 | 1809 | 850 | 5183 | 16.399769 | 0.3672 | 0 | 147 | 2550 | 5.764706 | 0.3364 | 0 | 385 | 1323 | 29.10053 | 0.4581 | 0 | 222 | 486 | 45.67901 | 0.49650 | 0 | 607 | 1809 | 33.55445 | 0.4431 | 0 | 459 | 3090 | 14.854369 | 0.5386 | 0 | 435 | 5283 | 8.233958 | 0.19610 | 0 | 454 | 8.717358 | 0.2561 | 0 | 1588 | 30.49155 | 0.8927 | 1 | 537 | 3716 | 14.45102 | 0.4708 | 0 | 417 | 1343 | 31.04989 | 0.8599 | 1 | 69 | 4835 | 1.4270941 | 0.5240 | 0 | 1881 | 5208 | 36.11751 | 0.5689 | 0 | 1953 | 87 | 4.454685 | 0.5392 | 0 | 148 | 7.578085 | 0.6495 | 0 | 39 | 1809 | 2.1558872 | 0.6471 | 0 | 121 | 1809 | 6.688778 | 0.6124 | 0 | 0 | 5208 | 0.000000 | 0.3814 | 0 | 1.88140 | 0.3053 | 0 | 3.0035 | 0.7667 | 2 | 0.5689 | 0.5614 | 0 | 2.8296 | 0.6516 | 0 | 8.28340 | 0.5452 | 2 | 4770 | 1906 | 1732 | 755 | 4692 | 16.09122 | 0.3758 | 0 | 92 | 2500 | 3.680000 | 0.3633 | 0 | 197 | 1184 | 16.63851 | 0.2804 | 0 | 235 | 548 | 42.88321 | 0.4609 | 0 | 432 | 1732 | 24.94226 | 0.3622 | 0 | 251 | 3100 | 8.096774 | 0.4085 | 0 | 228 | 4770 | 4.779874 | 0.2116 | 0 | 549 | 11.50943 | 0.2329 | 0 | 1352 | 28.34382 | 0.8865 | 1 | 490 | 3418.125 | 14.33535 | 0.4309 | 0 | 328 | 1263.2064 | 25.96567 | 0.8111 | 1 | 0 | 4526 | 0.0000000 | 0.09987 | 0 | 1875 | 4769.908 | 39.30893 | 0.5372 | 0 | 1906 | 72 | 3.7775446 | 0.4876 | 0 | 128 | 6.715635 | 0.6610 | 0 | 10 | 1732 | 0.5773672 | 0.3165 | 0 | 32 | 1731.7111 | 1.847883 | 0.2303 | 0 | 0 | 4770 | 0.000000 | 0.2111 | 0 | 1.7214 | 0.2531 | 0 | 2.46127 | 0.4594 | 2 | 0.5372 | 0.5306 | 0 | 1.9065 | 0.2183 | 0 | 6.62637 | 0.2829 | 2 | NA | NA | NA | NA |
| 10001040202 | 10 | 001 | 040202 | DE | Delaware | Kent County | 3 | South Region | 5 | South Atlantic Division | 11385 | 4350 | 4041 | 1680 | 10992 | 15.283843 | 0.3360 | 0 | 475 | 5262 | 9.026986 | 0.6217 | 0 | 1237 | 3491 | 35.43397 | 0.6683 | 0 | 255 | 550 | 46.36364 | 0.51190 | 0 | 1492 | 4041 | 36.92155 | 0.5546 | 0 | 751 | 7545 | 9.953612 | 0.3559 | 0 | 803 | 12478 | 6.435326 | 0.13310 | 0 | 1756 | 15.423803 | 0.6665 | 0 | 3042 | 26.71937 | 0.7280 | 0 | 1556 | 9021 | 17.24864 | 0.6195 | 0 | 336 | 3110 | 10.80386 | 0.3143 | 0 | 62 | 10616 | 0.5840241 | 0.3482 | 0 | 3295 | 11385 | 28.94159 | 0.4817 | 0 | 4350 | 100 | 2.298851 | 0.4559 | 0 | 478 | 10.988506 | 0.6962 | 0 | 20 | 4041 | 0.4949270 | 0.3450 | 0 | 192 | 4041 | 4.751299 | 0.4900 | 0 | 387 | 11385 | 3.399209 | 0.8606 | 1 | 2.00130 | 0.3396 | 0 | 2.6765 | 0.5915 | 0 | 0.4817 | 0.4753 | 0 | 2.8477 | 0.6611 | 1 | 8.00720 | 0.5007 | 1 | 16537 | 5776 | 5768 | 2288 | 16141 | 14.17508 | 0.3194 | 0 | 237 | 8403 | 2.820421 | 0.2461 | 0 | 1493 | 4973 | 30.02212 | 0.8197 | 1 | 315 | 795 | 39.62264 | 0.3868 | 0 | 1808 | 5768 | 31.34535 | 0.5823 | 0 | 986 | 11516 | 8.562001 | 0.4338 | 0 | 1326 | 15886 | 8.346972 | 0.4327 | 0 | 2472 | 14.94830 | 0.4225 | 0 | 3814 | 23.06343 | 0.6287 | 0 | 1742 | 12086.000 | 14.41337 | 0.4347 | 0 | 742 | 4396.0000 | 16.87898 | 0.5844 | 0 | 185 | 15466 | 1.1961722 | 0.50680 | 0 | 7164 | 16537.000 | 43.32104 | 0.5828 | 0 | 5776 | 138 | 2.3891967 | 0.4352 | 0 | 385 | 6.665513 | 0.6600 | 0 | 0 | 5768 | 0.0000000 | 0.1168 | 0 | 165 | 5768.0000 | 2.860610 | 0.3442 | 0 | 373 | 16537 | 2.255548 | 0.8244 | 1 | 2.0143 | 0.3437 | 0 | 2.57710 | 0.5357 | 0 | 0.5828 | 0.5757 | 0 | 2.3806 | 0.4199 | 1 | 7.55480 | 0.4282 | 1 | NA | NA | NA | NA |
| 10001040203 | 10 | 001 | 040203 | DE | Delaware | Kent County | 3 | South Region | 5 | South Atlantic Division | 4643 | 1865 | 1718 | 1441 | 4597 | 31.346530 | 0.7241 | 0 | 99 | 2296 | 4.311847 | 0.2007 | 0 | 362 | 1223 | 29.59935 | 0.4754 | 0 | 271 | 495 | 54.74747 | 0.70810 | 0 | 633 | 1718 | 36.84517 | 0.5523 | 0 | 436 | 2783 | 15.666547 | 0.5647 | 0 | 258 | 5110 | 5.048924 | 0.08961 | 0 | 505 | 10.876588 | 0.3849 | 0 | 1390 | 29.93754 | 0.8755 | 1 | 646 | 3590 | 17.99443 | 0.6562 | 0 | 292 | 1181 | 24.72481 | 0.7632 | 1 | 20 | 4310 | 0.4640371 | 0.3134 | 0 | 1780 | 4643 | 38.33728 | 0.5942 | 0 | 1865 | 91 | 4.879357 | 0.5508 | 0 | 252 | 13.512064 | 0.7236 | 0 | 52 | 1718 | 3.0267753 | 0.7465 | 0 | 197 | 1718 | 11.466822 | 0.7913 | 1 | 0 | 4643 | 0.000000 | 0.3814 | 0 | 2.13141 | 0.3754 | 0 | 2.9932 | 0.7618 | 2 | 0.5942 | 0.5863 | 0 | 3.1936 | 0.8133 | 1 | 8.91241 | 0.6347 | 3 | 5310 | 2259 | 2097 | 1163 | 5283 | 22.01401 | 0.5368 | 0 | 69 | 2413 | 2.859511 | 0.2514 | 0 | 418 | 1516 | 27.57256 | 0.7526 | 1 | 382 | 581 | 65.74871 | 0.9074 | 1 | 800 | 2097 | 38.14974 | 0.7609 | 1 | 162 | 3597 | 4.503753 | 0.2087 | 0 | 704 | 5297 | 13.290542 | 0.7059 | 0 | 1320 | 24.85876 | 0.8299 | 1 | 1429 | 26.91149 | 0.8347 | 1 | 513 | 3868.000 | 13.26267 | 0.3691 | 0 | 290 | 1430.0000 | 20.27972 | 0.6849 | 0 | 34 | 5062 | 0.6716713 | 0.39280 | 0 | 2582 | 5310.000 | 48.62524 | 0.6381 | 0 | 2259 | 153 | 6.7729084 | 0.5732 | 0 | 291 | 12.881806 | 0.7430 | 0 | 45 | 2097 | 2.1459227 | 0.6153 | 0 | 71 | 2097.0000 | 3.385789 | 0.3952 | 0 | 5 | 5310 | 0.094162 | 0.4618 | 0 | 2.4637 | 0.4806 | 1 | 3.11140 | 0.8223 | 2 | 0.6381 | 0.6303 | 0 | 2.7885 | 0.6181 | 0 | 9.00170 | 0.6555 | 3 | 4 | 537986 | 1 | 540738 |
| 10001040501 | 10 | 001 | 040501 | DE | Delaware | Kent County | 3 | South Region | 5 | South Atlantic Division | 5172 | 2061 | 1721 | 2008 | 5121 | 39.211092 | 0.8425 | 1 | 134 | 1988 | 6.740443 | 0.4302 | 0 | 443 | 1191 | 37.19563 | 0.7145 | 0 | 312 | 530 | 58.86792 | 0.78710 | 1 | 755 | 1721 | 43.86984 | 0.7444 | 0 | 486 | 3108 | 15.637066 | 0.5640 | 0 | 493 | 4902 | 10.057120 | 0.26220 | 0 | 700 | 13.534416 | 0.5573 | 0 | 1681 | 32.50193 | 0.9414 | 1 | 518 | 3508 | 14.76625 | 0.4887 | 0 | 580 | 1392 | 41.66667 | 0.9424 | 1 | 12 | 4692 | 0.2557545 | 0.2451 | 0 | 3222 | 5172 | 62.29698 | 0.7880 | 1 | 2061 | 281 | 13.634158 | 0.7133 | 0 | 223 | 10.819990 | 0.6938 | 0 | 139 | 1721 | 8.0766996 | 0.9538 | 1 | 63 | 1721 | 3.660662 | 0.3972 | 0 | 0 | 5172 | 0.000000 | 0.3814 | 0 | 2.84330 | 0.5967 | 1 | 3.1749 | 0.8372 | 2 | 0.7880 | 0.7776 | 1 | 3.1395 | 0.7936 | 1 | 9.94570 | 0.7681 | 5 | 4731 | 2061 | 1979 | 1016 | 4703 | 21.60323 | 0.5269 | 0 | 208 | 2511 | 8.283552 | 0.8001 | 1 | 402 | 1423 | 28.25018 | 0.7714 | 1 | 300 | 556 | 53.95683 | 0.7197 | 0 | 702 | 1979 | 35.47246 | 0.6995 | 0 | 412 | 3336 | 12.350120 | 0.6094 | 0 | 230 | 4731 | 4.861552 | 0.2173 | 0 | 964 | 20.37624 | 0.6876 | 0 | 926 | 19.57303 | 0.4025 | 0 | 959 | 3805.000 | 25.20368 | 0.8859 | 1 | 278 | 1180.0000 | 23.55932 | 0.7634 | 1 | 244 | 4465 | 5.4647256 | 0.82700 | 1 | 2404 | 4731.000 | 50.81378 | 0.6589 | 0 | 2061 | 260 | 12.6152353 | 0.6783 | 0 | 299 | 14.507521 | 0.7619 | 1 | 39 | 1979 | 1.9706923 | 0.5899 | 0 | 133 | 1979.0000 | 6.720566 | 0.6323 | 0 | 0 | 4731 | 0.000000 | 0.2111 | 0 | 2.8532 | 0.6053 | 1 | 3.56640 | 0.9479 | 3 | 0.6589 | 0.6509 | 0 | 2.8735 | 0.6632 | 1 | 9.95200 | 0.7755 | 5 | NA | NA | NA | NA |
| 10001040502 | 10 | 001 | 040502 | DE | Delaware | Kent County | 3 | South Region | 5 | South Atlantic Division | 2087 | 921 | 921 | 192 | 2087 | 9.199808 | 0.1738 | 0 | 35 | 722 | 4.847645 | 0.2495 | 0 | 281 | 700 | 40.14286 | 0.7819 | 1 | 64 | 221 | 28.95928 | 0.17110 | 0 | 345 | 921 | 37.45928 | 0.5710 | 0 | 284 | 1546 | 18.369987 | 0.6484 | 0 | 119 | 2121 | 5.610561 | 0.10710 | 0 | 518 | 24.820316 | 0.9068 | 1 | 480 | 22.99952 | 0.4910 | 0 | 328 | 1527 | 21.48003 | 0.7959 | 1 | 173 | 680 | 25.44118 | 0.7769 | 1 | 100 | 1998 | 5.0050050 | 0.7960 | 1 | 560 | 2087 | 26.83277 | 0.4524 | 0 | 921 | 0 | 0.000000 | 0.1428 | 0 | 273 | 29.641694 | 0.8785 | 1 | 0 | 921 | 0.0000000 | 0.1488 | 0 | 30 | 921 | 3.257329 | 0.3600 | 0 | 0 | 2087 | 0.000000 | 0.3814 | 0 | 1.74980 | 0.2670 | 0 | 3.7666 | 0.9666 | 4 | 0.4524 | 0.4464 | 0 | 1.9115 | 0.2071 | 1 | 7.88030 | 0.4785 | 5 | 2555 | 1030 | 954 | 565 | 2555 | 22.11350 | 0.5385 | 0 | 135 | 1154 | 11.698440 | 0.9175 | 1 | 144 | 691 | 20.83936 | 0.4865 | 0 | 168 | 262 | 64.12214 | 0.8894 | 1 | 312 | 953 | 32.73872 | 0.6259 | 0 | 192 | 1782 | 10.774411 | 0.5377 | 0 | 198 | 2519 | 7.860262 | 0.4016 | 0 | 519 | 20.31311 | 0.6851 | 0 | 664 | 25.98826 | 0.7939 | 1 | 341 | 1854.295 | 18.38974 | 0.6427 | 0 | 195 | 614.6519 | 31.72527 | 0.8870 | 1 | 75 | 2351 | 3.1901319 | 0.72360 | 0 | 1215 | 2555.353 | 47.54725 | 0.6272 | 0 | 1030 | 61 | 5.9223301 | 0.5514 | 0 | 170 | 16.504854 | 0.7844 | 1 | 58 | 954 | 6.0796646 | 0.8947 | 1 | 83 | 953.5886 | 8.703963 | 0.7220 | 0 | 0 | 2555 | 0.000000 | 0.2111 | 0 | 3.0212 | 0.6565 | 1 | 3.73230 | 0.9680 | 2 | 0.6272 | 0.6195 | 0 | 3.1636 | 0.7893 | 2 | 10.54430 | 0.8433 | 5 | 2 | 245978 | NA | NA |
svi_national_lihtc20 <- left_join(svi_national_lihtc10, lihtc_projects20, join_by("GEOID_2010_trt" == "fips2010"))

svi_national_lihtc20 %>% head() %>% kbl() %>% kable_styling() %>% scroll_box(width = "100%")
| GEOID_2010_trt | FIPS_st | FIPS_county | FIPS_tract | state | state_name | county | region_number | region | division_number | division | E_TOTPOP_10 | E_HU_10 | E_HH_10 | E_POV150_10 | ET_POVSTATUS_10 | EP_POV150_10 | EPL_POV150_10 | F_POV150_10 | E_UNEMP_10 | ET_EMPSTATUS_10 | EP_UNEMP_10 | EPL_UNEMP_10 | F_UNEMP_10 | E_HBURD_OWN_10 | ET_HOUSINGCOST_OWN_10 | EP_HBURD_OWN_10 | EPL_HBURD_OWN_10 | F_HBURD_OWN_10 | E_HBURD_RENT_10 | ET_HOUSINGCOST_RENT_10 | EP_HBURD_RENT_10 | EPL_HBURD_RENT_10 | F_HBURD_RENT_10 | E_HBURD_10 | ET_HOUSINGCOST_10 | EP_HBURD_10 | EPL_HBURD_10 | F_HBURD_10 | E_NOHSDP_10 | ET_EDSTATUS_10 | EP_NOHSDP_10 | EPL_NOHSDP_10 | F_NOHSDP_10 | E_UNINSUR_12 | ET_INSURSTATUS_12 | EP_UNINSUR_12 | EPL_UNINSUR_12 | F_UNINSUR_12 | E_AGE65_10 | EP_AGE65_10 | EPL_AGE65_10 | F_AGE65_10 | E_AGE17_10 | EP_AGE17_10 | EPL_AGE17_10 | F_AGE17_10 | E_DISABL_12 | ET_DISABLSTATUS_12 | EP_DISABL_12 | EPL_DISABL_12 | F_DISABL_12 | E_SNGPNT_10 | ET_FAMILIES_10 | EP_SNGPNT_10 | EPL_SNGPNT_10 | F_SNGPNT_10 | E_LIMENG_10 | ET_POPAGE5UP_10 | EP_LIMENG_10 | EPL_LIMENG_10 | F_LIMENG_10 | E_MINRTY_10 | ET_POPETHRACE_10 | EP_MINRTY_10 | EPL_MINRTY_10 | F_MINRTY_10 | E_STRHU_10 | E_MUNIT_10 | EP_MUNIT_10 | EPL_MUNIT_10 | F_MUNIT_10 | E_MOBILE_10 | EP_MOBILE_10 | EPL_MOBILE_10 | F_MOBILE_10 | E_CROWD_10 | ET_OCCUPANTS_10 | EP_CROWD_10 | EPL_CROWD_10 | F_CROWD_10 | E_NOVEH_10 | ET_KNOWNVEH_10 | EP_NOVEH_10 | EPL_NOVEH_10 | F_NOVEH_10 | E_GROUPQ_10 | ET_HHTYPE_10 | EP_GROUPQ_10 | EPL_GROUPQ_10 | F_GROUPQ_10 | SPL_THEME1_10 | RPL_THEME1_10 | F_THEME1_10 | SPL_THEME2_10 | RPL_THEME2_10 | F_THEME2_10 | SPL_THEME3_10 | RPL_THEME3_10 | F_THEME3_10 | SPL_THEME4_10 | RPL_THEME4_10 | F_THEME4_10 | SPL_THEMES_10 | RPL_THEMES_10 | F_TOTAL_10 | E_TOTPOP_20 | E_HU_20 | E_HH_20 | E_POV150_20 | ET_POVSTATUS_20 | EP_POV150_20 | EPL_POV150_20 | F_POV150_20 | E_UNEMP_20 | ET_EMPSTATUS_20 | EP_UNEMP_20 | EPL_UNEMP_20 | F_UNEMP_20 | E_HBURD_OWN_20 | ET_HOUSINGCOST_OWN_20 | EP_HBURD_OWN_20 | EPL_HBURD_OWN_20 | F_HBURD_OWN_20 | E_HBURD_RENT_20 | ET_HOUSINGCOST_RENT_20 | EP_HBURD_RENT_20 | EPL_HBURD_RENT_20 | F_HBURD_RENT_20 | E_HBURD_20 | ET_HOUSINGCOST_20 | EP_HBURD_20 | EPL_HBURD_20 | F_HBURD_20 | E_NOHSDP_20 | ET_EDSTATUS_20 | EP_NOHSDP_20 | EPL_NOHSDP_20 | F_NOHSDP_20 | E_UNINSUR_20 | ET_INSURSTATUS_20 | EP_UNINSUR_20 | EPL_UNINSUR_20 | F_UNINSUR_20 | E_AGE65_20 | EP_AGE65_20 | EPL_AGE65_20 | F_AGE65_20 | E_AGE17_20 | EP_AGE17_20 | EPL_AGE17_20 | F_AGE17_20 | E_DISABL_20 | ET_DISABLSTATUS_20 | EP_DISABL_20 | EPL_DISABL_20 | F_DISABL_20 | E_SNGPNT_20 | ET_FAMILIES_20 | EP_SNGPNT_20 | EPL_SNGPNT_20 | F_SNGPNT_20 | E_LIMENG_20 | ET_POPAGE5UP_20 | EP_LIMENG_20 | EPL_LIMENG_20 | F_LIMENG_20 | E_MINRTY_20 | ET_POPETHRACE_20 | EP_MINRTY_20 | EPL_MINRTY_20 | F_MINRTY_20 | E_STRHU_20 | E_MUNIT_20 | EP_MUNIT_20 | EPL_MUNIT_20 | F_MUNIT_20 | E_MOBILE_20 | EP_MOBILE_20 | EPL_MOBILE_20 | F_MOBILE_20 | E_CROWD_20 | ET_OCCUPANTS_20 | EP_CROWD_20 | EPL_CROWD_20 | F_CROWD_20 | E_NOVEH_20 | ET_KNOWNVEH_20 | EP_NOVEH_20 | EPL_NOVEH_20 | F_NOVEH_20 | E_GROUPQ_20 | ET_HHTYPE_20 | EP_GROUPQ_20 | EPL_GROUPQ_20 | F_GROUPQ_20 | SPL_THEME1_20 | RPL_THEME1_20 | F_THEME1_20 | SPL_THEME2_20 | RPL_THEME2_20 | F_THEME2_20 | SPL_THEME3_20 | RPL_THEME3_20 | F_THEME3_20 | SPL_THEME4_20 | RPL_THEME4_20 | F_THEME4_20 | SPL_THEMES_20 | RPL_THEMES_20 | F_TOTAL_20 | pre10_lihtc_project_cnt | pre10_lihtc_project_dollars | post10_lihtc_project_cnt | post10_lihtc_project_dollars |
|---|---|---|---|---|---|---|---|---|---|---|---|---|---|---|---|---|---|---|---|---|---|---|---|---|---|---|---|---|---|---|---|---|---|---|---|---|---|---|---|---|---|---|---|---|---|---|---|---|---|---|---|---|---|---|---|---|---|---|---|---|---|---|---|---|---|---|---|---|---|---|---|---|---|---|---|---|---|---|---|---|---|---|---|---|---|---|---|---|---|---|---|---|---|---|---|---|---|---|---|---|---|---|---|---|---|---|---|---|---|---|---|---|---|---|---|---|---|---|---|---|---|---|---|---|---|---|---|---|---|---|---|---|---|---|---|---|---|---|---|---|---|---|---|---|---|---|---|---|---|---|---|---|---|---|---|---|---|---|---|---|---|---|---|---|---|---|---|---|---|---|---|---|---|---|---|---|---|---|---|---|---|---|---|---|---|---|---|---|---|---|---|---|---|---|---|---|---|---|---|---|---|---|---|---|---|---|---|---|---|---|---|---|---|---|---|---|---|---|---|---|---|---|---|---|
| 01001020100 | 01 | 001 | 020100 | AL | Alabama | Autauga County | 3 | South Region | 6 | East South Central Division | 1809 | 771 | 696 | 297 | 1809 | 16.41791 | 0.3871 | 0 | 36 | 889 | 4.049494 | 0.1790 | 0 | 127 | 598 | 21.23746 | 0.20770 | 0 | 47 | 98 | 47.95918 | 0.5767 | 0 | 174 | 696 | 25.00000 | 0.18790 | 0 | 196 | 1242 | 15.780998 | 0.6093 | 0 | 186 | 1759 | 10.574190 | 0.3790 | 0 | 222 | 12.271973 | 0.4876 | 0 | 445 | 24.59923 | 0.5473 | 0 | 298 | 1335 | 22.32210 | 0.8454 | 1 | 27 | 545 | 4.954128 | 0.09275 | 0 | 36 | 1705 | 2.1114370 | 0.59040 | 0 | 385 | 1809 | 21.282477 | 0.4524 | 0 | 771 | 0 | 0.0000000 | 0.1224 | 0 | 92 | 11.9325551 | 0.8005 | 1 | 0 | 696 | 0.0000000 | 0.1238 | 0 | 50 | 696 | 7.183908 | 0.6134 | 0 | 0 | 1809 | 0 | 0.364 | 0 | 1.74230 | 0.28200 | 0 | 2.56345 | 0.5296 | 1 | 0.4524 | 0.4482 | 0 | 2.0241 | 0.2519 | 1 | 6.78225 | 0.3278 | 2 | 1941 | 710 | 693 | 352 | 1941 | 18.13498 | 0.4630 | 0 | 18 | 852 | 2.112676 | 0.15070 | 0 | 81 | 507 | 15.976331 | 0.26320 | 0 | 63 | 186 | 33.87097 | 0.2913 | 0 | 144 | 693 | 20.77922 | 0.2230 | 0 | 187 | 1309 | 14.285714 | 0.6928 | 0 | 187 | 1941 | 9.634209 | 0.6617 | 0 | 295 | 15.19835 | 0.4601 | 0 | 415 | 21.38073 | 0.4681 | 0 | 391 | 1526 | 25.62254 | 0.9011 | 1 | 58 | 555 | 10.45045 | 0.3451 | 0 | 0 | 1843 | 0.0000000 | 0.09479 | 0 | 437 | 1941 | 22.51417 | 0.3902 | 0 | 710 | 0 | 0.0000000 | 0.1079 | 0 | 88 | 12.3943662 | 0.8263 | 1 | 0 | 693 | 0.0000000 | 0.09796 | 0 | 10 | 693 | 1.443001 | 0.1643 | 0 | 0 | 1941 | 0.000000 | 0.1831 | 0 | 2.19120 | 0.4084 | 0 | 2.26919 | 0.3503 | 1 | 0.3902 | 0.3869 | 0 | 1.37956 | 0.07216 | 1 | 6.23015 | 0.2314 | 2 | NA | NA | NA | NA |
| 01001020200 | 01 | 001 | 020200 | AL | Alabama | Autauga County | 3 | South Region | 6 | East South Central Division | 2020 | 816 | 730 | 495 | 1992 | 24.84940 | 0.5954 | 0 | 68 | 834 | 8.153477 | 0.5754 | 0 | 49 | 439 | 11.16173 | 0.02067 | 0 | 105 | 291 | 36.08247 | 0.3019 | 0 | 154 | 730 | 21.09589 | 0.09312 | 0 | 339 | 1265 | 26.798419 | 0.8392 | 1 | 313 | 2012 | 15.556660 | 0.6000 | 0 | 204 | 10.099010 | 0.3419 | 0 | 597 | 29.55446 | 0.8192 | 1 | 359 | 1515 | 23.69637 | 0.8791 | 1 | 132 | 456 | 28.947368 | 0.83510 | 1 | 15 | 1890 | 0.7936508 | 0.40130 | 0 | 1243 | 2020 | 61.534653 | 0.7781 | 1 | 816 | 0 | 0.0000000 | 0.1224 | 0 | 34 | 4.1666667 | 0.6664 | 0 | 13 | 730 | 1.7808219 | 0.5406 | 0 | 115 | 730 | 15.753425 | 0.8382 | 1 | 0 | 2020 | 0 | 0.364 | 0 | 2.70312 | 0.56650 | 1 | 3.27660 | 0.8614 | 3 | 0.7781 | 0.7709 | 1 | 2.5316 | 0.5047 | 1 | 9.28942 | 0.6832 | 6 | 1757 | 720 | 573 | 384 | 1511 | 25.41363 | 0.6427 | 0 | 29 | 717 | 4.044630 | 0.41320 | 0 | 33 | 392 | 8.418367 | 0.03542 | 0 | 116 | 181 | 64.08840 | 0.9086 | 1 | 149 | 573 | 26.00349 | 0.4041 | 0 | 139 | 1313 | 10.586443 | 0.5601 | 0 | 91 | 1533 | 5.936073 | 0.4343 | 0 | 284 | 16.16392 | 0.5169 | 0 | 325 | 18.49744 | 0.2851 | 0 | 164 | 1208 | 13.57616 | 0.4127 | 0 | 42 | 359 | 11.69916 | 0.3998 | 0 | 0 | 1651 | 0.0000000 | 0.09479 | 0 | 1116 | 1757 | 63.51736 | 0.7591 | 1 | 720 | 3 | 0.4166667 | 0.2470 | 0 | 5 | 0.6944444 | 0.5106 | 0 | 9 | 573 | 1.5706806 | 0.46880 | 0 | 57 | 573 | 9.947644 | 0.7317 | 0 | 212 | 1757 | 12.066022 | 0.9549 | 1 | 2.45440 | 0.4888 | 0 | 1.70929 | 0.1025 | 0 | 0.7591 | 0.7527 | 1 | 2.91300 | 0.68620 | 1 | 7.83579 | 0.4802 | 2 | NA | NA | NA | NA |
| 01001020300 | 01 | 001 | 020300 | AL | Alabama | Autauga County | 3 | South Region | 6 | East South Central Division | 3543 | 1403 | 1287 | 656 | 3533 | 18.56779 | 0.4443 | 0 | 93 | 1552 | 5.992268 | 0.3724 | 0 | 273 | 957 | 28.52665 | 0.45780 | 0 | 178 | 330 | 53.93939 | 0.7152 | 0 | 451 | 1287 | 35.04274 | 0.49930 | 0 | 346 | 2260 | 15.309734 | 0.5950 | 0 | 252 | 3102 | 8.123791 | 0.2596 | 0 | 487 | 13.745413 | 0.5868 | 0 | 998 | 28.16822 | 0.7606 | 1 | 371 | 2224 | 16.68165 | 0.6266 | 0 | 126 | 913 | 13.800657 | 0.46350 | 0 | 0 | 3365 | 0.0000000 | 0.09298 | 0 | 637 | 3543 | 17.979114 | 0.4049 | 0 | 1403 | 10 | 0.7127584 | 0.3015 | 0 | 2 | 0.1425517 | 0.4407 | 0 | 0 | 1287 | 0.0000000 | 0.1238 | 0 | 101 | 1287 | 7.847708 | 0.6443 | 0 | 0 | 3543 | 0 | 0.364 | 0 | 2.17060 | 0.41010 | 0 | 2.53048 | 0.5116 | 1 | 0.4049 | 0.4011 | 0 | 1.8743 | 0.1942 | 0 | 6.98028 | 0.3576 | 1 | 3694 | 1464 | 1351 | 842 | 3694 | 22.79372 | 0.5833 | 0 | 53 | 1994 | 2.657974 | 0.22050 | 0 | 117 | 967 | 12.099276 | 0.11370 | 0 | 147 | 384 | 38.28125 | 0.3856 | 0 | 264 | 1351 | 19.54108 | 0.1827 | 0 | 317 | 2477 | 12.797739 | 0.6460 | 0 | 127 | 3673 | 3.457664 | 0.2308 | 0 | 464 | 12.56091 | 0.3088 | 0 | 929 | 25.14889 | 0.7080 | 0 | 473 | 2744 | 17.23761 | 0.6211 | 0 | 263 | 975 | 26.97436 | 0.8234 | 1 | 128 | 3586 | 3.5694367 | 0.70770 | 0 | 1331 | 3694 | 36.03140 | 0.5515 | 0 | 1464 | 26 | 1.7759563 | 0.3675 | 0 | 14 | 0.9562842 | 0.5389 | 0 | 35 | 1351 | 2.5906736 | 0.60550 | 0 | 42 | 1351 | 3.108808 | 0.3415 | 0 | 0 | 3694 | 0.000000 | 0.1831 | 0 | 1.86330 | 0.3063 | 0 | 3.16900 | 0.8380 | 1 | 0.5515 | 0.5468 | 0 | 2.03650 | 0.26830 | 0 | 7.62030 | 0.4460 | 1 | 2 | 216593 | NA | NA |
| 01001020400 | 01 | 001 | 020400 | AL | Alabama | Autauga County | 3 | South Region | 6 | East South Central Division | 4840 | 1957 | 1839 | 501 | 4840 | 10.35124 | 0.2177 | 0 | 101 | 2129 | 4.744011 | 0.2447 | 0 | 310 | 1549 | 20.01291 | 0.17080 | 0 | 89 | 290 | 30.68966 | 0.2044 | 0 | 399 | 1839 | 21.69657 | 0.10540 | 0 | 274 | 3280 | 8.353658 | 0.3205 | 0 | 399 | 4293 | 9.294200 | 0.3171 | 0 | 955 | 19.731405 | 0.8643 | 1 | 1195 | 24.69008 | 0.5530 | 0 | 625 | 3328 | 18.78005 | 0.7233 | 0 | 152 | 1374 | 11.062591 | 0.34710 | 0 | 10 | 4537 | 0.2204100 | 0.22560 | 0 | 297 | 4840 | 6.136364 | 0.1647 | 0 | 1957 | 33 | 1.6862545 | 0.3843 | 0 | 25 | 1.2774655 | 0.5516 | 0 | 14 | 1839 | 0.7612833 | 0.3564 | 0 | 19 | 1839 | 1.033170 | 0.1127 | 0 | 0 | 4840 | 0 | 0.364 | 0 | 1.20540 | 0.13470 | 0 | 2.71330 | 0.6129 | 1 | 0.1647 | 0.1632 | 0 | 1.7690 | 0.1591 | 0 | 5.85240 | 0.1954 | 1 | 3539 | 1741 | 1636 | 503 | 3539 | 14.21305 | 0.3472 | 0 | 39 | 1658 | 2.352232 | 0.17990 | 0 | 219 | 1290 | 16.976744 | 0.30880 | 0 | 74 | 346 | 21.38728 | 0.1037 | 0 | 293 | 1636 | 17.90954 | 0.1333 | 0 | 173 | 2775 | 6.234234 | 0.3351 | 0 | 169 | 3529 | 4.788892 | 0.3448 | 0 | 969 | 27.38062 | 0.9225 | 1 | 510 | 14.41085 | 0.1208 | 0 | 670 | 3019 | 22.19278 | 0.8194 | 1 | 148 | 1137 | 13.01671 | 0.4541 | 0 | 89 | 3409 | 2.6107363 | 0.64690 | 0 | 454 | 3539 | 12.82848 | 0.2364 | 0 | 1741 | 143 | 8.2136703 | 0.6028 | 0 | 0 | 0.0000000 | 0.2186 | 0 | 10 | 1636 | 0.6112469 | 0.28340 | 0 | 72 | 1636 | 4.400978 | 0.4538 | 0 | 0 | 3539 | 0.000000 | 0.1831 | 0 | 1.34030 | 0.1575 | 0 | 2.96370 | 0.7496 | 2 | 0.2364 | 0.2344 | 0 | 1.74170 | 0.16270 | 0 | 6.28210 | 0.2389 | 2 | NA | NA | NA | NA |
| 01001020500 | 01 | 001 | 020500 | AL | Alabama | Autauga County | 3 | South Region | 6 | East South Central Division | 9938 | 3969 | 3741 | 1096 | 9938 | 11.02838 | 0.2364 | 0 | 188 | 4937 | 3.807981 | 0.1577 | 0 | 426 | 2406 | 17.70574 | 0.11050 | 0 | 528 | 1335 | 39.55056 | 0.3753 | 0 | 954 | 3741 | 25.50120 | 0.20140 | 0 | 293 | 5983 | 4.897209 | 0.1655 | 0 | 740 | 10110 | 7.319486 | 0.2211 | 0 | 837 | 8.422218 | 0.2408 | 0 | 3012 | 30.30791 | 0.8455 | 1 | 759 | 7155 | 10.60797 | 0.2668 | 0 | 476 | 2529 | 18.821669 | 0.63540 | 0 | 78 | 9297 | 0.8389803 | 0.41110 | 0 | 1970 | 9938 | 19.822902 | 0.4330 | 0 | 3969 | 306 | 7.7097506 | 0.6153 | 0 | 0 | 0.0000000 | 0.2198 | 0 | 7 | 3741 | 0.1871157 | 0.2535 | 0 | 223 | 3741 | 5.960973 | 0.5483 | 0 | 0 | 9938 | 0 | 0.364 | 0 | 0.98210 | 0.08468 | 0 | 2.39960 | 0.4381 | 1 | 0.4330 | 0.4290 | 0 | 2.0009 | 0.2430 | 0 | 5.81560 | 0.1905 | 1 | 10674 | 4504 | 4424 | 1626 | 10509 | 15.47245 | 0.3851 | 0 | 81 | 5048 | 1.604596 | 0.09431 | 0 | 321 | 2299 | 13.962592 | 0.17970 | 0 | 711 | 2125 | 33.45882 | 0.2836 | 0 | 1032 | 4424 | 23.32731 | 0.3109 | 0 | 531 | 6816 | 7.790493 | 0.4251 | 0 | 301 | 10046 | 2.996217 | 0.1894 | 0 | 1613 | 15.11149 | 0.4553 | 0 | 2765 | 25.90407 | 0.7494 | 0 | 1124 | 7281 | 15.43744 | 0.5253 | 0 | 342 | 2912 | 11.74451 | 0.4019 | 0 | 52 | 9920 | 0.5241935 | 0.35230 | 0 | 2603 | 10674 | 24.38636 | 0.4160 | 0 | 4504 | 703 | 15.6083481 | 0.7378 | 0 | 29 | 0.6438721 | 0.5037 | 0 | 37 | 4424 | 0.8363472 | 0.33420 | 0 | 207 | 4424 | 4.679023 | 0.4754 | 0 | 176 | 10674 | 1.648866 | 0.7598 | 1 | 1.40481 | 0.1743 | 0 | 2.48420 | 0.4802 | 0 | 0.4160 | 0.4125 | 0 | 2.81090 | 0.63730 | 1 | 7.11591 | 0.3654 | 1 | 5 | 2250459 | NA | NA |
| 01001020600 | 01 | 001 | 020600 | AL | Alabama | Autauga County | 3 | South Region | 6 | East South Central Division | 3402 | 1456 | 1308 | 735 | 3402 | 21.60494 | 0.5199 | 0 | 134 | 1720 | 7.790698 | 0.5436 | 0 | 242 | 1032 | 23.44961 | 0.28010 | 0 | 62 | 276 | 22.46377 | 0.1035 | 0 | 304 | 1308 | 23.24159 | 0.14070 | 0 | 301 | 2151 | 13.993491 | 0.5510 | 0 | 355 | 3445 | 10.304790 | 0.3656 | 0 | 386 | 11.346267 | 0.4232 | 0 | 931 | 27.36626 | 0.7200 | 0 | 440 | 2439 | 18.04018 | 0.6912 | 0 | 143 | 924 | 15.476190 | 0.52900 | 0 | 4 | 3254 | 0.1229256 | 0.19840 | 0 | 723 | 3402 | 21.252205 | 0.4519 | 0 | 1456 | 18 | 1.2362637 | 0.3507 | 0 | 433 | 29.7390110 | 0.9468 | 1 | 16 | 1308 | 1.2232416 | 0.4493 | 0 | 28 | 1308 | 2.140673 | 0.2298 | 0 | 0 | 3402 | 0 | 0.364 | 0 | 2.12080 | 0.39510 | 0 | 2.56180 | 0.5288 | 0 | 0.4519 | 0.4477 | 0 | 2.3406 | 0.4048 | 1 | 7.47510 | 0.4314 | 1 | 3536 | 1464 | 1330 | 1279 | 3523 | 36.30429 | 0.8215 | 1 | 34 | 1223 | 2.780049 | 0.23780 | 0 | 321 | 1111 | 28.892889 | 0.75870 | 1 | 67 | 219 | 30.59361 | 0.2305 | 0 | 388 | 1330 | 29.17293 | 0.5075 | 0 | 306 | 2380 | 12.857143 | 0.6480 | 0 | 415 | 3496 | 11.870709 | 0.7535 | 1 | 547 | 15.46946 | 0.4760 | 0 | 982 | 27.77149 | 0.8327 | 1 | 729 | 2514 | 28.99761 | 0.9488 | 1 | 95 | 880 | 10.79545 | 0.3601 | 0 | 0 | 3394 | 0.0000000 | 0.09479 | 0 | 985 | 3536 | 27.85633 | 0.4608 | 0 | 1464 | 0 | 0.0000000 | 0.1079 | 0 | 364 | 24.8633880 | 0.9300 | 1 | 0 | 1330 | 0.0000000 | 0.09796 | 0 | 17 | 1330 | 1.278196 | 0.1463 | 0 | 0 | 3536 | 0.000000 | 0.1831 | 0 | 2.96830 | 0.6434 | 2 | 2.71239 | 0.6156 | 2 | 0.4608 | 0.4569 | 0 | 1.46526 | 0.08976 | 1 | 7.60675 | 0.4440 | 5 | NA | NA | NA | NA |
svi_divisional_lihtc20 <- svi_divisional_lihtc20 %>%
  filter(is.na(pre10_lihtc_project_cnt)) %>%
  filter(post10_lihtc_project_cnt >= 1) %>%
  select(GEOID_2010_trt, pre10_lihtc_project_cnt, pre10_lihtc_project_dollars, post10_lihtc_project_cnt, post10_lihtc_project_dollars)

# View data
svi_divisional_lihtc20 %>% head() %>% kbl() %>% kable_styling() %>% scroll_box(width = "100%")
| GEOID_2010_trt | pre10_lihtc_project_cnt | pre10_lihtc_project_dollars | post10_lihtc_project_cnt | post10_lihtc_project_dollars |
|---|---|---|---|---|
| 10003001902 | NA | NA | 1 | 0 |
| 10003010300 | NA | NA | 1 | 366252 |
| 10003012700 | NA | NA | 1 | 495592 |
| 10003014100 | NA | NA | 1 | 0 |
| 10003014501 | NA | NA | 2 | 0 |
| 10003014705 | NA | NA | 1 | 0 |
svi_national_lihtc20 <- svi_national_lihtc20 %>%
  filter(is.na(pre10_lihtc_project_cnt)) %>%
  filter(post10_lihtc_project_cnt >= 1) %>%
  select(GEOID_2010_trt, pre10_lihtc_project_cnt, pre10_lihtc_project_dollars, post10_lihtc_project_cnt, post10_lihtc_project_dollars)

# View data
svi_national_lihtc20 %>% head() %>% kbl() %>% kable_styling() %>% scroll_box(width = "100%")
| GEOID_2010_trt | pre10_lihtc_project_cnt | pre10_lihtc_project_dollars | post10_lihtc_project_cnt | post10_lihtc_project_dollars |
|---|---|---|---|---|
| 01003010500 | NA | NA | 1 | 481325 |
| 01003011601 | NA | NA | 1 | 887856 |
| 01017954600 | NA | NA | 2 | 950192 |
| 01021060101 | NA | NA | 1 | 812048 |
| 01039962600 | NA | NA | 1 | 434742 |
| 01043964900 | NA | NA | 1 | 1046201 |
Filter to Relevant Time-Frame
# Filter SVI divisional data to remove all tracts that had a project in 2010 or before:
svi_divisional_lihtc <-  svi_divisional %>%
  filter(! GEOID_2010_trt %in% lihtc_projects10$fips2010)

# Merge SVI divisional data with post 2010 project data, create flag for projects (1 for tracts that have LIHTC project, 0 for those that do not):
svi_divisional_lihtc <- left_join(svi_divisional_lihtc,
                                  svi_divisional_lihtc20,
                                  join_by("GEOID_2010_trt" == "GEOID_2010_trt")) %>%
                        mutate(pre10_lihtc_project_cnt = replace_na(pre10_lihtc_project_cnt, 0),
                               post10_lihtc_project_cnt = replace_na(post10_lihtc_project_cnt, 0),
                               pre10_lihtc_project_dollars = replace_na(pre10_lihtc_project_dollars, 0),
                               post10_lihtc_project_dollars = replace_na(post10_lihtc_project_dollars, 0),
                               lihtc_flag = if_else(post10_lihtc_project_cnt >= 1, 1, 0))

# Finally, we want to filter our dataset to only have tracts that are eligible for the LIHTC program and that have SVI data:
svi_divisional_lihtc <- left_join(svi_divisional_lihtc, lihtc_eligible_flag,
                                  join_by("GEOID_2010_trt" == "GEOID10")) %>%
                        filter(tolower(lihtc_eligibility) == "yes") %>%
                        filter(!is.na(F_TOTAL_10)) %>%
                        filter(!is.na(F_TOTAL_20))


# View data
svi_divisional_lihtc %>% head() %>% kbl() %>% kable_styling() %>% scroll_box(width = "100%")
| GEOID_2010_trt | FIPS_st | FIPS_county | FIPS_tract | state | state_name | county | region_number | region | division_number | division | E_TOTPOP_10 | E_HU_10 | E_HH_10 | E_POV150_10 | ET_POVSTATUS_10 | EP_POV150_10 | EPL_POV150_10 | F_POV150_10 | E_UNEMP_10 | ET_EMPSTATUS_10 | EP_UNEMP_10 | EPL_UNEMP_10 | F_UNEMP_10 | E_HBURD_OWN_10 | ET_HOUSINGCOST_OWN_10 | EP_HBURD_OWN_10 | EPL_HBURD_OWN_10 | F_HBURD_OWN_10 | E_HBURD_RENT_10 | ET_HOUSINGCOST_RENT_10 | EP_HBURD_RENT_10 | EPL_HBURD_RENT_10 | F_HBURD_RENT_10 | E_HBURD_10 | ET_HOUSINGCOST_10 | EP_HBURD_10 | EPL_HBURD_10 | F_HBURD_10 | E_NOHSDP_10 | ET_EDSTATUS_10 | EP_NOHSDP_10 | EPL_NOHSDP_10 | F_NOHSDP_10 | E_UNINSUR_12 | ET_INSURSTATUS_12 | EP_UNINSUR_12 | EPL_UNINSUR_12 | F_UNINSUR_12 | E_AGE65_10 | EP_AGE65_10 | EPL_AGE65_10 | F_AGE65_10 | E_AGE17_10 | EP_AGE17_10 | EPL_AGE17_10 | F_AGE17_10 | E_DISABL_12 | ET_DISABLSTATUS_12 | EP_DISABL_12 | EPL_DISABL_12 | F_DISABL_12 | E_SNGPNT_10 | ET_FAMILIES_10 | EP_SNGPNT_10 | EPL_SNGPNT_10 | F_SNGPNT_10 | E_LIMENG_10 | ET_POPAGE5UP_10 | EP_LIMENG_10 | EPL_LIMENG_10 | F_LIMENG_10 | E_MINRTY_10 | ET_POPETHRACE_10 | EP_MINRTY_10 | EPL_MINRTY_10 | F_MINRTY_10 | E_STRHU_10 | E_MUNIT_10 | EP_MUNIT_10 | EPL_MUNIT_10 | F_MUNIT_10 | E_MOBILE_10 | EP_MOBILE_10 | EPL_MOBILE_10 | F_MOBILE_10 | E_CROWD_10 | ET_OCCUPANTS_10 | EP_CROWD_10 | EPL_CROWD_10 | F_CROWD_10 | E_NOVEH_10 | ET_KNOWNVEH_10 | EP_NOVEH_10 | EPL_NOVEH_10 | F_NOVEH_10 | E_GROUPQ_10 | ET_HHTYPE_10 | EP_GROUPQ_10 | EPL_GROUPQ_10 | F_GROUPQ_10 | SPL_THEME1_10 | RPL_THEME1_10 | F_THEME1_10 | SPL_THEME2_10 | RPL_THEME2_10 | F_THEME2_10 | SPL_THEME3_10 | RPL_THEME3_10 | F_THEME3_10 | SPL_THEME4_10 | RPL_THEME4_10 | F_THEME4_10 | SPL_THEMES_10 | RPL_THEMES_10 | F_TOTAL_10 | E_TOTPOP_20 | E_HU_20 | E_HH_20 | E_POV150_20 | ET_POVSTATUS_20 | EP_POV150_20 | EPL_POV150_20 | F_POV150_20 | E_UNEMP_20 | ET_EMPSTATUS_20 | EP_UNEMP_20 | EPL_UNEMP_20 | F_UNEMP_20 | E_HBURD_OWN_20 | ET_HOUSINGCOST_OWN_20 | EP_HBURD_OWN_20 | EPL_HBURD_OWN_20 | F_HBURD_OWN_20 | E_HBURD_RENT_20 | ET_HOUSINGCOST_RENT_20 | EP_HBURD_RENT_20 | EPL_HBURD_RENT_20 | F_HBURD_RENT_20 | E_HBURD_20 | ET_HOUSINGCOST_20 | EP_HBURD_20 | EPL_HBURD_20 | F_HBURD_20 | E_NOHSDP_20 | ET_EDSTATUS_20 | EP_NOHSDP_20 | EPL_NOHSDP_20 | F_NOHSDP_20 | E_UNINSUR_20 | ET_INSURSTATUS_20 | EP_UNINSUR_20 | EPL_UNINSUR_20 | F_UNINSUR_20 | E_AGE65_20 | EP_AGE65_20 | EPL_AGE65_20 | F_AGE65_20 | E_AGE17_20 | EP_AGE17_20 | EPL_AGE17_20 | F_AGE17_20 | E_DISABL_20 | ET_DISABLSTATUS_20 | EP_DISABL_20 | EPL_DISABL_20 | F_DISABL_20 | E_SNGPNT_20 | ET_FAMILIES_20 | EP_SNGPNT_20 | EPL_SNGPNT_20 | F_SNGPNT_20 | E_LIMENG_20 | ET_POPAGE5UP_20 | EP_LIMENG_20 | EPL_LIMENG_20 | F_LIMENG_20 | E_MINRTY_20 | ET_POPETHRACE_20 | EP_MINRTY_20 | EPL_MINRTY_20 | F_MINRTY_20 | E_STRHU_20 | E_MUNIT_20 | EP_MUNIT_20 | EPL_MUNIT_20 | F_MUNIT_20 | E_MOBILE_20 | EP_MOBILE_20 | EPL_MOBILE_20 | F_MOBILE_20 | E_CROWD_20 | ET_OCCUPANTS_20 | EP_CROWD_20 | EPL_CROWD_20 | F_CROWD_20 | E_NOVEH_20 | ET_KNOWNVEH_20 | EP_NOVEH_20 | EPL_NOVEH_20 | F_NOVEH_20 | E_GROUPQ_20 | ET_HHTYPE_20 | EP_GROUPQ_20 | EPL_GROUPQ_20 | F_GROUPQ_20 | SPL_THEME1_20 | RPL_THEME1_20 | F_THEME1_20 | SPL_THEME2_20 | RPL_THEME2_20 | F_THEME2_20 | SPL_THEME3_20 | RPL_THEME3_20 | F_THEME3_20 | SPL_THEME4_20 | RPL_THEME4_20 | F_THEME4_20 | SPL_THEMES_20 | RPL_THEMES_20 | F_TOTAL_20 | pre10_lihtc_project_cnt | pre10_lihtc_project_dollars | post10_lihtc_project_cnt | post10_lihtc_project_dollars | lihtc_flag | lihtc_eligibility |
|---|---|---|---|---|---|---|---|---|---|---|---|---|---|---|---|---|---|---|---|---|---|---|---|---|---|---|---|---|---|---|---|---|---|---|---|---|---|---|---|---|---|---|---|---|---|---|---|---|---|---|---|---|---|---|---|---|---|---|---|---|---|---|---|---|---|---|---|---|---|---|---|---|---|---|---|---|---|---|---|---|---|---|---|---|---|---|---|---|---|---|---|---|---|---|---|---|---|---|---|---|---|---|---|---|---|---|---|---|---|---|---|---|---|---|---|---|---|---|---|---|---|---|---|---|---|---|---|---|---|---|---|---|---|---|---|---|---|---|---|---|---|---|---|---|---|---|---|---|---|---|---|---|---|---|---|---|---|---|---|---|---|---|---|---|---|---|---|---|---|---|---|---|---|---|---|---|---|---|---|---|---|---|---|---|---|---|---|---|---|---|---|---|---|---|---|---|---|---|---|---|---|---|---|---|---|---|---|---|---|---|---|---|---|---|---|---|---|---|---|---|---|---|---|---|---|---|
| 10003002200 | 10 | 003 | 002200 | DE | Delaware | New Castle County | 3 | South Region | 5 | South Atlantic Division | 3765 | 1162 | 957 | 2101 | 3738 | 56.20653 | 0.9604 | 1 | 191 | 1458 | 13.1001372 | 0.83340 | 1 | 194 | 329 | 58.96657 | 0.97690 | 1 | 377 | 628 | 60.03185 | 0.8081 | 1 | 571 | 957 | 59.66562 | 0.9664 | 1 | 779 | 1798 | 43.325918 | 0.9854 | 1 | 493 | 3339 | 14.764900 | 0.46710 | 0 | 225 | 5.976096 | 0.11800 | 0 | 1429 | 37.9548473 | 0.989700 | 1 | 417 | 1970 | 21.167513 | 0.78440 | 1 | 314 | 714 | 43.97759 | 0.95280 | 1 | 500 | 3388 | 14.7579693 | 0.9426 | 1 | 3668 | 3765 | 97.423639 | 0.9678 | 1 | 1162 | 23 | 1.979346 | 0.4385 | 0 | 0 | 0 | 0.1809 | 0 | 134 | 957 | 14.0020899 | 0.9922 | 1 | 308 | 957 | 32.18391 | 0.9657 | 1 | 7 | 3765 | 0.185923 | 0.7635 | 1 | 4.21270 | 0.9244 | 4 | 3.787500 | 0.968900 | 4 | 0.9678 | 0.9550 | 1 | 3.3408 | 0.8640 | 3 | 12.308800 | 0.9629 | 12 | 2815 | 994 | 737 | 1430 | 2784 | 51.36494 | 0.9554 | 1 | 106 | 1114 | 9.515260 | 0.8545 | 1 | 143 | 340 | 42.05882 | 0.9621 | 1 | 155 | 397 | 39.04282 | 0.3733 | 0 | 298 | 737 | 40.43419 | 0.8083 | 1 | 606 | 1745 | 34.727794 | 0.9837 | 1 | 402 | 2815 | 14.280639 | 0.7435 | 0 | 503 | 17.868561 | 0.57060 | 0 | 846 | 30.053286 | 0.92830 | 1 | 491 | 1969 | 24.936516 | 0.88050 | 1 | 151 | 565 | 26.72566 | 0.825600 | 1 | 560 | 2625 | 21.3333333 | 0.9754 | 1 | 2646 | 2815 | 93.99645 | 0.9462 | 1 | 994 | 11 | 1.10664 | 0.3592 | 0 | 0 | 0 | 0.18 | 0 | 6 | 737 | 0.8141113 | 0.3774 | 0 | 108 | 737 | 14.65400 | 0.8690 | 1 | 31 | 2815 | 1.1012433 | 0.7405 | 0 | 4.3454 | 0.9499 | 4 | 4.180400 | 0.984000 | 4 | 0.9462 | 0.9347 | 1 | 2.5261 | 0.4921 | 1 | 11.998100 | 0.9568 | 10 | 0 | 0 | 0 | 0 | 0 | Yes |
| 10003014501 | 10 | 003 | 014501 | DE | Delaware | New Castle County | 3 | South Region | 5 | South Atlantic Division | 1955 | 939 | 777 | 1386 | 1955 | 70.89514 | 0.9895 | 1 | 48 | 1122 | 4.2780749 | 0.19780 | 0 | 0 | 60 | 0.00000 | 0.00257 | 0 | 541 | 717 | 75.45328 | 0.9611 | 1 | 541 | 777 | 69.62677 | 0.9944 | 1 | 147 | 618 | 23.786408 | 0.7845 | 1 | 52 | 2056 | 2.529183 | 0.02664 | 0 | 131 | 6.700767 | 0.15180 | 0 | 6 | 0.3069054 | 0.005545 | 0 | 176 | 2056 | 8.560311 | 0.16120 | 0 | 0 | 80 | 0.00000 | 0.01071 | 0 | 8 | 1955 | 0.4092072 | 0.2950 | 0 | 184 | 1955 | 9.411765 | 0.1643 | 0 | 939 | 370 | 39.403621 | 0.9074 | 1 | 0 | 0 | 0.1809 | 0 | 0 | 777 | 0.0000000 | 0.1488 | 0 | 146 | 777 | 18.79022 | 0.9044 | 1 | 0 | 1955 | 0.000000 | 0.3814 | 0 | 2.99284 | 0.6440 | 3 | 0.624255 | 0.003867 | 0 | 0.1643 | 0.1621 | 0 | 2.5229 | 0.4936 | 2 | 6.304295 | 0.2474 | 5 | 2126 | 1068 | 956 | 1531 | 2126 | 72.01317 | 0.9948 | 1 | 136 | 1067 | 12.746017 | 0.9370 | 1 | 17 | 19 | 89.47368 | 0.9990 | 1 | 638 | 937 | 68.08965 | 0.9311 | 1 | 655 | 956 | 68.51464 | 0.9967 | 1 | 36 | 615 | 5.853658 | 0.2880 | 0 | 175 | 2126 | 8.231421 | 0.4254 | 0 | 174 | 8.184384 | 0.10240 | 0 | 140 | 6.585136 | 0.03945 | 0 | 121 | 1986 | 6.092649 | 0.05007 | 0 | 37 | 102 | 36.27451 | 0.923300 | 1 | 50 | 2074 | 2.4108004 | 0.6655 | 0 | 796 | 2126 | 37.44120 | 0.5142 | 0 | 1068 | 676 | 63.29588 | 0.9619 | 1 | 0 | 0 | 0.18 | 0 | 95 | 956 | 9.9372385 | 0.9670 | 1 | 322 | 956 | 33.68201 | 0.9751 | 1 | 0 | 2126 | 0.0000000 | 0.2111 | 0 | 3.6419 | 0.8250 | 3 | 1.780720 | 0.113400 | 1 | 0.5142 | 0.5080 | 0 | 3.2951 | 0.8374 | 3 | 9.231920 | 0.6857 | 7 | 0 | 0 | 2 | 0 | 1 | Yes |
| 10003014502 | 10 | 003 | 014502 | DE | Delaware | New Castle County | 3 | South Region | 5 | South Atlantic Division | 5783 | 1441 | 1105 | 2275 | 2996 | 75.93458 | 0.9934 | 1 | 132 | 2389 | 5.5253244 | 0.31400 | 0 | 50 | 229 | 21.83406 | 0.19290 | 0 | 652 | 876 | 74.42922 | 0.9567 | 1 | 702 | 1105 | 63.52941 | 0.9830 | 1 | 33 | 587 | 5.621806 | 0.1831 | 0 | 180 | 6088 | 2.956636 | 0.03618 | 0 | 118 | 2.040463 | 0.02041 | 0 | 233 | 4.0290507 | 0.020260 | 0 | 151 | 3410 | 4.428153 | 0.02916 | 0 | 115 | 199 | 57.78894 | 0.98670 | 1 | 39 | 5711 | 0.6828927 | 0.3758 | 0 | 491 | 5783 | 8.490403 | 0.1472 | 0 | 1441 | 472 | 32.755031 | 0.8757 | 1 | 0 | 0 | 0.1809 | 0 | 52 | 1105 | 4.7058824 | 0.8627 | 1 | 242 | 1105 | 21.90045 | 0.9274 | 1 | 2787 | 5783 | 48.192979 | 0.9885 | 1 | 2.50968 | 0.4907 | 2 | 1.432330 | 0.040710 | 1 | 0.1472 | 0.1453 | 0 | 3.8352 | 0.9660 | 4 | 7.924410 | 0.4875 | 7 | 6752 | 1338 | 1064 | 2027 | 2989 | 67.81532 | 0.9920 | 1 | 353 | 2685 | 13.147114 | 0.9437 | 1 | 45 | 160 | 28.12500 | 0.7682 | 1 | 620 | 904 | 68.58407 | 0.9350 | 1 | 665 | 1064 | 62.50000 | 0.9903 | 1 | 52 | 1141 | 4.557406 | 0.2116 | 0 | 305 | 6727 | 4.533968 | 0.1964 | 0 | 201 | 2.976896 | 0.01566 | 0 | 103 | 1.525474 | 0.01056 | 0 | 182 | 2931 | 6.209485 | 0.05207 | 0 | 0 | 196 | 0.00000 | 0.008258 | 0 | 33 | 6752 | 0.4887441 | 0.3436 | 0 | 1244 | 6752 | 18.42417 | 0.2554 | 0 | 1338 | 386 | 28.84903 | 0.8433 | 1 | 0 | 0 | 0.18 | 0 | 0 | 1064 | 0.0000000 | 0.1168 | 0 | 117 | 1064 | 10.99624 | 0.7959 | 1 | 3772 | 6752 | 55.8649289 | 0.9908 | 1 | 3.3340 | 0.7465 | 3 | 0.430148 | 0.002408 | 0 | 0.2554 | 0.2523 | 0 | 2.9268 | 0.6874 | 3 | 6.946348 | 0.3282 | 6 | 0 | 0 | 0 | 0 | 0 | Yes |
| 11001001803 | 11 | 001 | 001803 | DC | District of Columbia | District of Columbia | 3 | South Region | 5 | South Atlantic Division | 2965 | 1716 | 1585 | 712 | 2965 | 24.01349 | 0.5660 | 0 | 249 | 1742 | 14.2939150 | 0.86780 | 1 | 85 | 352 | 24.14773 | 0.27170 | 0 | 654 | 1233 | 53.04136 | 0.6691 | 0 | 739 | 1585 | 46.62461 | 0.8084 | 1 | 530 | 2290 | 23.144105 | 0.7689 | 1 | 621 | 3307 | 18.778349 | 0.64490 | 0 | 442 | 14.907251 | 0.64050 | 0 | 433 | 14.6037099 | 0.130700 | 0 | 397 | 2619 | 15.158457 | 0.50950 | 0 | 128 | 666 | 19.21922 | 0.63310 | 0 | 323 | 2875 | 11.2347826 | 0.9153 | 1 | 2807 | 2965 | 94.671164 | 0.9471 | 1 | 1716 | 1178 | 68.648019 | 0.9715 | 1 | 0 | 0 | 0.1809 | 0 | 92 | 1585 | 5.8044164 | 0.9056 | 1 | 605 | 1585 | 38.17035 | 0.9779 | 1 | 0 | 2965 | 0.000000 | 0.3814 | 0 | 3.65600 | 0.8220 | 3 | 2.829100 | 0.677100 | 1 | 0.9471 | 0.9346 | 1 | 3.4173 | 0.8900 | 3 | 10.849500 | 0.8633 | 8 | 4161 | 1765 | 1623 | 1067 | 4161 | 25.64287 | 0.6257 | 0 | 166 | 2245 | 7.394209 | 0.7467 | 0 | 60 | 216 | 27.77778 | 0.7579 | 1 | 682 | 1407 | 48.47193 | 0.5905 | 0 | 742 | 1623 | 45.71781 | 0.8878 | 1 | 624 | 2995 | 20.834725 | 0.8628 | 1 | 563 | 4161 | 13.530401 | 0.7154 | 0 | 400 | 9.613074 | 0.14970 | 0 | 918 | 22.062004 | 0.56160 | 0 | 717 | 3243 | 22.109158 | 0.80240 | 1 | 200 | 730 | 27.39726 | 0.836500 | 1 | 533 | 3914 | 13.6177823 | 0.9433 | 1 | 3689 | 4161 | 88.65657 | 0.9109 | 1 | 1765 | 1317 | 74.61756 | 0.9757 | 1 | 0 | 0 | 0.18 | 0 | 199 | 1623 | 12.2612446 | 0.9830 | 1 | 690 | 1623 | 42.51386 | 0.9878 | 1 | 5 | 4161 | 0.1201634 | 0.4852 | 0 | 3.8384 | 0.8685 | 2 | 3.293500 | 0.887500 | 3 | 0.9109 | 0.8998 | 1 | 3.6117 | 0.9260 | 3 | 11.654500 | 0.9370 | 9 | 0 | 0 | 0 | 0 | 0 | Yes |
| 11001002001 | 11 | 001 | 002001 | DC | District of Columbia | District of Columbia | 3 | South Region | 5 | South Atlantic Division | 2668 | 1096 | 1004 | 345 | 2668 | 12.93103 | 0.2723 | 0 | 13 | 1550 | 0.8387097 | 0.02102 | 0 | 78 | 406 | 19.21182 | 0.12550 | 0 | 398 | 598 | 66.55518 | 0.8962 | 1 | 476 | 1004 | 47.41036 | 0.8256 | 1 | 327 | 2055 | 15.912409 | 0.5720 | 0 | 219 | 2427 | 9.023486 | 0.22340 | 0 | 308 | 11.544228 | 0.42830 | 0 | 457 | 17.1289355 | 0.196800 | 0 | 299 | 1964 | 15.224033 | 0.51180 | 0 | 221 | 606 | 36.46865 | 0.91070 | 1 | 127 | 2521 | 5.0376835 | 0.7970 | 1 | 2082 | 2668 | 78.035982 | 0.8691 | 1 | 1096 | 471 | 42.974453 | 0.9187 | 1 | 0 | 0 | 0.1809 | 0 | 3 | 1004 | 0.2988048 | 0.3128 | 0 | 342 | 1004 | 34.06374 | 0.9705 | 1 | 183 | 2668 | 6.859070 | 0.9133 | 1 | 1.91432 | 0.3153 | 1 | 2.844600 | 0.685900 | 2 | 0.8691 | 0.8576 | 1 | 3.2962 | 0.8507 | 3 | 8.924220 | 0.6368 | 7 | 3578 | 1241 | 1181 | 1230 | 3571 | 34.44413 | 0.7939 | 1 | 88 | 1925 | 4.571429 | 0.4798 | 0 | 96 | 340 | 28.23529 | 0.7710 | 1 | 534 | 841 | 63.49584 | 0.8822 | 1 | 630 | 1181 | 53.34462 | 0.9577 | 1 | 828 | 2392 | 34.615385 | 0.9832 | 1 | 137 | 3572 | 3.835386 | 0.1527 | 0 | 570 | 15.930687 | 0.47320 | 0 | 988 | 27.613192 | 0.86160 | 1 | 358 | 2588 | 13.833076 | 0.40220 | 0 | 188 | 855 | 21.98830 | 0.727700 | 0 | 698 | 3258 | 21.4241866 | 0.9755 | 1 | 3296 | 3578 | 92.11850 | 0.9329 | 1 | 1241 | 838 | 67.52619 | 0.9678 | 1 | 0 | 0 | 0.18 | 0 | 216 | 1181 | 18.2895851 | 0.9962 | 1 | 490 | 1181 | 41.49026 | 0.9866 | 1 | 96 | 3578 | 2.6830632 | 0.8444 | 1 | 3.3673 | 0.7557 | 3 | 3.440200 | 0.924000 | 2 | 0.9329 | 0.9215 | 1 | 3.9750 | 0.9729 | 4 | 11.715400 | 0.9405 | 10 | 0 | 0 | 0 | 0 | 0 | Yes |
| 11001002101 | 11 | 001 | 002101 | DC | District of Columbia | District of Columbia | 3 | South Region | 5 | South Atlantic Division | 4735 | 2173 | 1797 | 1273 | 4735 | 26.88490 | 0.6333 | 0 | 380 | 2545 | 14.9312377 | 0.88620 | 1 | 413 | 910 | 45.38462 | 0.87540 | 1 | 528 | 887 | 59.52649 | 0.7988 | 1 | 941 | 1797 | 52.36505 | 0.9021 | 1 | 974 | 3332 | 29.231693 | 0.8912 | 1 | 1104 | 5530 | 19.963834 | 0.68980 | 0 | 511 | 10.791975 | 0.37930 | 0 | 962 | 20.3167899 | 0.326700 | 0 | 473 | 4252 | 11.124177 | 0.29400 | 0 | 318 | 997 | 31.89569 | 0.86880 | 1 | 523 | 4484 | 11.6636931 | 0.9194 | 1 | 4604 | 4735 | 97.233368 | 0.9664 | 1 | 2173 | 861 | 39.622642 | 0.9084 | 1 | 0 | 0 | 0.1809 | 0 | 60 | 1797 | 3.3388982 | 0.7732 | 1 | 427 | 1797 | 23.76183 | 0.9390 | 1 | 116 | 4735 | 2.449842 | 0.8331 | 1 | 4.00260 | 0.8910 | 3 | 2.788200 | 0.656100 | 2 | 0.9664 | 0.9536 | 1 | 3.6346 | 0.9380 | 4 | 11.391800 | 0.9101 | 10 | 5693 | 2360 | 2143 | 1011 | 5693 | 17.75865 | 0.4264 | 0 | 82 | 3360 | 2.440476 | 0.1930 | 0 | 390 | 1070 | 36.44860 | 0.9206 | 1 | 344 | 1073 | 32.05965 | 0.2338 | 0 | 734 | 2143 | 34.25105 | 0.6685 | 0 | 518 | 3999 | 12.953238 | 0.6323 | 0 | 320 | 5693 | 5.620938 | 0.2628 | 0 | 684 | 12.014755 | 0.25940 | 0 | 1440 | 25.294221 | 0.75820 | 1 | 387 | 4253 | 9.099459 | 0.15780 | 0 | 438 | 1260 | 34.76190 | 0.914000 | 1 | 281 | 5250 | 5.3523810 | 0.8235 | 1 | 5097 | 5693 | 89.53100 | 0.9159 | 1 | 2360 | 1021 | 43.26271 | 0.9125 | 1 | 0 | 0 | 0.18 | 0 | 70 | 2143 | 3.2664489 | 0.7350 | 0 | 490 | 2143 | 22.86514 | 0.9409 | 1 | 12 | 5693 | 0.2107852 | 0.5502 | 0 | 2.1830 | 0.3950 | 0 | 2.912900 | 0.728400 | 3 | 0.9159 | 0.9047 | 1 | 3.3186 | 0.8452 | 2 | 9.330400 | 0.6994 | 6 | 0 | 0 | 2 | 301689 | 1 | Yes |
# Filter SVI national data to remove all tracts that had a project in 2010 or before:
svi_national_lihtc <-  svi_national %>%
  filter(! GEOID_2010_trt %in% lihtc_projects10$fips2010)

# Merge SVI national data with post 2010 project data, create flag for projects (1 for tracts that have LIHTC project, 0 for those that do not):
svi_national_lihtc <- left_join(svi_national_lihtc,
                                  svi_national_lihtc20,
                                  join_by("GEOID_2010_trt" == "GEOID_2010_trt")) %>%
                        mutate(pre10_lihtc_project_cnt = replace_na(pre10_lihtc_project_cnt, 0),
                               post10_lihtc_project_cnt = replace_na(post10_lihtc_project_cnt, 0),
                                pre10_lihtc_project_dollars = replace_na(pre10_lihtc_project_dollars, 0),
                               post10_lihtc_project_dollars = replace_na(post10_lihtc_project_dollars, 0),
                               lihtc_flag = if_else(post10_lihtc_project_cnt >= 1, 1, 0))

# Finally, we want to filter our dataset to only have tracts that are eligible for the LIHTC program and that have SVI data:
svi_national_lihtc <- left_join(svi_national_lihtc, lihtc_eligible_flag,
                                  join_by("GEOID_2010_trt" == "GEOID10")) %>%
                        filter(tolower(lihtc_eligibility) == "yes") %>%
                        filter(!is.na(F_TOTAL_10)) %>%
                        filter(!is.na(F_TOTAL_20))


# View data
svi_national_lihtc %>% head() %>% kbl() %>% kable_styling() %>% scroll_box(width = "100%")
| GEOID_2010_trt | FIPS_st | FIPS_county | FIPS_tract | state | state_name | county | region_number | region | division_number | division | E_TOTPOP_10 | E_HU_10 | E_HH_10 | E_POV150_10 | ET_POVSTATUS_10 | EP_POV150_10 | EPL_POV150_10 | F_POV150_10 | E_UNEMP_10 | ET_EMPSTATUS_10 | EP_UNEMP_10 | EPL_UNEMP_10 | F_UNEMP_10 | E_HBURD_OWN_10 | ET_HOUSINGCOST_OWN_10 | EP_HBURD_OWN_10 | EPL_HBURD_OWN_10 | F_HBURD_OWN_10 | E_HBURD_RENT_10 | ET_HOUSINGCOST_RENT_10 | EP_HBURD_RENT_10 | EPL_HBURD_RENT_10 | F_HBURD_RENT_10 | E_HBURD_10 | ET_HOUSINGCOST_10 | EP_HBURD_10 | EPL_HBURD_10 | F_HBURD_10 | E_NOHSDP_10 | ET_EDSTATUS_10 | EP_NOHSDP_10 | EPL_NOHSDP_10 | F_NOHSDP_10 | E_UNINSUR_12 | ET_INSURSTATUS_12 | EP_UNINSUR_12 | EPL_UNINSUR_12 | F_UNINSUR_12 | E_AGE65_10 | EP_AGE65_10 | EPL_AGE65_10 | F_AGE65_10 | E_AGE17_10 | EP_AGE17_10 | EPL_AGE17_10 | F_AGE17_10 | E_DISABL_12 | ET_DISABLSTATUS_12 | EP_DISABL_12 | EPL_DISABL_12 | F_DISABL_12 | E_SNGPNT_10 | ET_FAMILIES_10 | EP_SNGPNT_10 | EPL_SNGPNT_10 | F_SNGPNT_10 | E_LIMENG_10 | ET_POPAGE5UP_10 | EP_LIMENG_10 | EPL_LIMENG_10 | F_LIMENG_10 | E_MINRTY_10 | ET_POPETHRACE_10 | EP_MINRTY_10 | EPL_MINRTY_10 | F_MINRTY_10 | E_STRHU_10 | E_MUNIT_10 | EP_MUNIT_10 | EPL_MUNIT_10 | F_MUNIT_10 | E_MOBILE_10 | EP_MOBILE_10 | EPL_MOBILE_10 | F_MOBILE_10 | E_CROWD_10 | ET_OCCUPANTS_10 | EP_CROWD_10 | EPL_CROWD_10 | F_CROWD_10 | E_NOVEH_10 | ET_KNOWNVEH_10 | EP_NOVEH_10 | EPL_NOVEH_10 | F_NOVEH_10 | E_GROUPQ_10 | ET_HHTYPE_10 | EP_GROUPQ_10 | EPL_GROUPQ_10 | F_GROUPQ_10 | SPL_THEME1_10 | RPL_THEME1_10 | F_THEME1_10 | SPL_THEME2_10 | RPL_THEME2_10 | F_THEME2_10 | SPL_THEME3_10 | RPL_THEME3_10 | F_THEME3_10 | SPL_THEME4_10 | RPL_THEME4_10 | F_THEME4_10 | SPL_THEMES_10 | RPL_THEMES_10 | F_TOTAL_10 | E_TOTPOP_20 | E_HU_20 | E_HH_20 | E_POV150_20 | ET_POVSTATUS_20 | EP_POV150_20 | EPL_POV150_20 | F_POV150_20 | E_UNEMP_20 | ET_EMPSTATUS_20 | EP_UNEMP_20 | EPL_UNEMP_20 | F_UNEMP_20 | E_HBURD_OWN_20 | ET_HOUSINGCOST_OWN_20 | EP_HBURD_OWN_20 | EPL_HBURD_OWN_20 | F_HBURD_OWN_20 | E_HBURD_RENT_20 | ET_HOUSINGCOST_RENT_20 | EP_HBURD_RENT_20 | EPL_HBURD_RENT_20 | F_HBURD_RENT_20 | E_HBURD_20 | ET_HOUSINGCOST_20 | EP_HBURD_20 | EPL_HBURD_20 | F_HBURD_20 | E_NOHSDP_20 | ET_EDSTATUS_20 | EP_NOHSDP_20 | EPL_NOHSDP_20 | F_NOHSDP_20 | E_UNINSUR_20 | ET_INSURSTATUS_20 | EP_UNINSUR_20 | EPL_UNINSUR_20 | F_UNINSUR_20 | E_AGE65_20 | EP_AGE65_20 | EPL_AGE65_20 | F_AGE65_20 | E_AGE17_20 | EP_AGE17_20 | EPL_AGE17_20 | F_AGE17_20 | E_DISABL_20 | ET_DISABLSTATUS_20 | EP_DISABL_20 | EPL_DISABL_20 | F_DISABL_20 | E_SNGPNT_20 | ET_FAMILIES_20 | EP_SNGPNT_20 | EPL_SNGPNT_20 | F_SNGPNT_20 | E_LIMENG_20 | ET_POPAGE5UP_20 | EP_LIMENG_20 | EPL_LIMENG_20 | F_LIMENG_20 | E_MINRTY_20 | ET_POPETHRACE_20 | EP_MINRTY_20 | EPL_MINRTY_20 | F_MINRTY_20 | E_STRHU_20 | E_MUNIT_20 | EP_MUNIT_20 | EPL_MUNIT_20 | F_MUNIT_20 | E_MOBILE_20 | EP_MOBILE_20 | EPL_MOBILE_20 | F_MOBILE_20 | E_CROWD_20 | ET_OCCUPANTS_20 | EP_CROWD_20 | EPL_CROWD_20 | F_CROWD_20 | E_NOVEH_20 | ET_KNOWNVEH_20 | EP_NOVEH_20 | EPL_NOVEH_20 | F_NOVEH_20 | E_GROUPQ_20 | ET_HHTYPE_20 | EP_GROUPQ_20 | EPL_GROUPQ_20 | F_GROUPQ_20 | SPL_THEME1_20 | RPL_THEME1_20 | F_THEME1_20 | SPL_THEME2_20 | RPL_THEME2_20 | F_THEME2_20 | SPL_THEME3_20 | RPL_THEME3_20 | F_THEME3_20 | SPL_THEME4_20 | RPL_THEME4_20 | F_THEME4_20 | SPL_THEMES_20 | RPL_THEMES_20 | F_TOTAL_20 | pre10_lihtc_project_cnt | pre10_lihtc_project_dollars | post10_lihtc_project_cnt | post10_lihtc_project_dollars | lihtc_flag | lihtc_eligibility |
|---|---|---|---|---|---|---|---|---|---|---|---|---|---|---|---|---|---|---|---|---|---|---|---|---|---|---|---|---|---|---|---|---|---|---|---|---|---|---|---|---|---|---|---|---|---|---|---|---|---|---|---|---|---|---|---|---|---|---|---|---|---|---|---|---|---|---|---|---|---|---|---|---|---|---|---|---|---|---|---|---|---|---|---|---|---|---|---|---|---|---|---|---|---|---|---|---|---|---|---|---|---|---|---|---|---|---|---|---|---|---|---|---|---|---|---|---|---|---|---|---|---|---|---|---|---|---|---|---|---|---|---|---|---|---|---|---|---|---|---|---|---|---|---|---|---|---|---|---|---|---|---|---|---|---|---|---|---|---|---|---|---|---|---|---|---|---|---|---|---|---|---|---|---|---|---|---|---|---|---|---|---|---|---|---|---|---|---|---|---|---|---|---|---|---|---|---|---|---|---|---|---|---|---|---|---|---|---|---|---|---|---|---|---|---|---|---|---|---|---|---|---|---|---|---|---|---|
| 01005950700 | 01 | 005 | 950700 | AL | Alabama | Barbour County | 3 | South Region | 6 | East South Central Division | 1753 | 687 | 563 | 615 | 1628 | 37.77641 | 0.8088 | 1 | 17 | 667 | 2.548726 | 0.06941 | 0 | 41 | 376 | 10.90426 | 0.01945 | 0 | 62 | 187 | 33.15508 | 0.2464 | 0 | 103 | 563 | 18.29485 | 0.04875 | 0 | 264 | 1208 | 21.85430 | 0.7570 | 1 | 201 | 1527 | 13.163065 | 0.4991 | 0 | 368 | 20.992584 | 0.89510 | 1 | 462 | 26.354820 | 0.66130 | 0 | 211 | 1085 | 19.44700 | 0.7505 | 1 | 107 | 399 | 26.81704 | 0.8048 | 1 | 0 | 1628 | 0.000000 | 0.09298 | 0 | 861 | 1753 | 49.11580 | 0.7101 | 0 | 687 | 17 | 2.474527 | 0.4324 | 0 | 38 | 5.5312955 | 0.6970 | 0 | 3 | 563 | 0.5328597 | 0.3037 | 0 | 19 | 563 | 3.374778 | 0.3529 | 0 | 233 | 1753 | 13.29150 | 0.9517 | 1 | 2.18306 | 0.4137 | 2 | 3.20468 | 0.8377 | 3 | 0.7101 | 0.7035 | 0 | 2.7377 | 0.6100 | 1 | 8.83554 | 0.6264 | 6 | 1527 | 691 | 595 | 565 | 1365 | 41.39194 | 0.8765 | 1 | 37 | 572 | 6.468532 | 0.6776 | 0 | 70 | 376 | 18.617021 | 0.38590 | 0 | 92 | 219 | 42.00913 | 0.4736 | 0 | 162 | 595 | 27.22689 | 0.4454 | 0 | 280 | 1114 | 25.13465 | 0.8942 | 1 | 105 | 1378 | 7.619739 | 0.5505 | 0 | 383 | 25.081860 | 0.88450 | 1 | 337 | 22.069417 | 0.51380 | 0 | 237 | 1041.0000 | 22.76657 | 0.8360 | 1 | 144 | 413.0000 | 34.86683 | 0.9114 | 1 | 11 | 1466 | 0.7503411 | 0.40700 | 0 | 711 | 1527.0000 | 46.56189 | 0.6441 | 0 | 691 | 13 | 1.881331 | 0.3740 | 0 | 37 | 5.3545586 | 0.7152 | 0 | 0 | 595 | 0.0000000 | 0.09796 | 0 | 115 | 595.0000 | 19.327731 | 0.8859 | 1 | 149 | 1527 | 9.757695 | 0.9470 | 1 | 3.4442 | 0.7707 | 2 | 3.55270 | 0.9403 | 3 | 0.6441 | 0.6387 | 0 | 3.02006 | 0.7337 | 2 | 10.66106 | 0.8537 | 7 | 0 | 0 | 0 | 0 | 0 | Yes |
| 01011952100 | 01 | 011 | 952100 | AL | Alabama | Bullock County | 3 | South Region | 6 | East South Central Division | 1652 | 796 | 554 | 564 | 1652 | 34.14044 | 0.7613 | 1 | 46 | 816 | 5.637255 | 0.33630 | 0 | 96 | 458 | 20.96070 | 0.19930 | 0 | 62 | 96 | 64.58333 | 0.8917 | 1 | 158 | 554 | 28.51986 | 0.29220 | 0 | 271 | 1076 | 25.18587 | 0.8163 | 1 | 155 | 1663 | 9.320505 | 0.3183 | 0 | 199 | 12.046005 | 0.47180 | 0 | 420 | 25.423729 | 0.60240 | 0 | 327 | 1279 | 25.56685 | 0.9151 | 1 | 137 | 375 | 36.53333 | 0.9108 | 1 | 0 | 1590 | 0.000000 | 0.09298 | 0 | 1428 | 1652 | 86.44068 | 0.8939 | 1 | 796 | 0 | 0.000000 | 0.1224 | 0 | 384 | 48.2412060 | 0.9897 | 1 | 19 | 554 | 3.4296029 | 0.7145 | 0 | 45 | 554 | 8.122744 | 0.6556 | 0 | 0 | 1652 | 0.00000 | 0.3640 | 0 | 2.52440 | 0.5138 | 2 | 2.99308 | 0.7515 | 2 | 0.8939 | 0.8856 | 1 | 2.8462 | 0.6637 | 1 | 9.25758 | 0.6790 | 6 | 1382 | 748 | 549 | 742 | 1382 | 53.69030 | 0.9560 | 1 | 40 | 511 | 7.827789 | 0.7730 | 1 | 110 | 402 | 27.363184 | 0.71780 | 0 | 45 | 147 | 30.61224 | 0.2307 | 0 | 155 | 549 | 28.23315 | 0.4773 | 0 | 181 | 905 | 20.00000 | 0.8253 | 1 | 232 | 1382 | 16.787265 | 0.8813 | 1 | 164 | 11.866860 | 0.27170 | 0 | 250 | 18.089725 | 0.26290 | 0 | 258 | 1132.0000 | 22.79152 | 0.8368 | 1 | 99 | 279.0000 | 35.48387 | 0.9162 | 1 | 33 | 1275 | 2.5882353 | 0.64520 | 0 | 1347 | 1382.0000 | 97.46744 | 0.9681 | 1 | 748 | 0 | 0.000000 | 0.1079 | 0 | 375 | 50.1336898 | 0.9922 | 1 | 0 | 549 | 0.0000000 | 0.09796 | 0 | 37 | 549.0000 | 6.739526 | 0.6039 | 0 | 0 | 1382 | 0.000000 | 0.1831 | 0 | 3.9129 | 0.8785 | 4 | 2.93280 | 0.7342 | 2 | 0.9681 | 0.9599 | 1 | 1.98506 | 0.2471 | 1 | 9.79886 | 0.7570 | 8 | 0 | 0 | 0 | 0 | 0 | Yes |
| 01015000300 | 01 | 015 | 000300 | AL | Alabama | Calhoun County | 3 | South Region | 6 | East South Central Division | 3074 | 1635 | 1330 | 1904 | 3067 | 62.08021 | 0.9710 | 1 | 293 | 1362 | 21.512482 | 0.96630 | 1 | 180 | 513 | 35.08772 | 0.65450 | 0 | 383 | 817 | 46.87882 | 0.5504 | 0 | 563 | 1330 | 42.33083 | 0.70280 | 0 | 720 | 2127 | 33.85049 | 0.9148 | 1 | 628 | 2835 | 22.151675 | 0.8076 | 1 | 380 | 12.361744 | 0.49340 | 0 | 713 | 23.194535 | 0.45030 | 0 | 647 | 2111 | 30.64898 | 0.9708 | 1 | 298 | 773 | 38.55110 | 0.9247 | 1 | 0 | 2878 | 0.000000 | 0.09298 | 0 | 2623 | 3074 | 85.32856 | 0.8883 | 1 | 1635 | 148 | 9.051988 | 0.6465 | 0 | 6 | 0.3669725 | 0.4502 | 0 | 68 | 1330 | 5.1127820 | 0.8082 | 1 | 303 | 1330 | 22.781955 | 0.9029 | 1 | 0 | 3074 | 0.00000 | 0.3640 | 0 | 4.36250 | 0.9430 | 4 | 2.93218 | 0.7233 | 2 | 0.8883 | 0.8800 | 1 | 3.1718 | 0.8070 | 2 | 11.35478 | 0.9009 | 9 | 2390 | 1702 | 1282 | 1287 | 2390 | 53.84937 | 0.9566 | 1 | 102 | 1066 | 9.568480 | 0.8541 | 1 | 158 | 609 | 25.944171 | 0.67520 | 0 | 286 | 673 | 42.49629 | 0.4856 | 0 | 444 | 1282 | 34.63339 | 0.6634 | 0 | 467 | 1685 | 27.71513 | 0.9180 | 1 | 369 | 2379 | 15.510719 | 0.8562 | 1 | 342 | 14.309623 | 0.40850 | 0 | 548 | 22.928870 | 0.57100 | 0 | 647 | 1831.0000 | 35.33588 | 0.9862 | 1 | 202 | 576.0000 | 35.06944 | 0.9130 | 1 | 16 | 2134 | 0.7497657 | 0.40690 | 0 | 1896 | 2390.0000 | 79.33054 | 0.8451 | 1 | 1702 | 96 | 5.640423 | 0.5329 | 0 | 0 | 0.0000000 | 0.2186 | 0 | 0 | 1282 | 0.0000000 | 0.09796 | 0 | 186 | 1282.0000 | 14.508580 | 0.8308 | 1 | 43 | 2390 | 1.799163 | 0.7727 | 1 | 4.2483 | 0.9395 | 4 | 3.28560 | 0.8773 | 2 | 0.8451 | 0.8379 | 1 | 2.45296 | 0.4602 | 2 | 10.83196 | 0.8718 | 9 | 0 | 0 | 0 | 0 | 0 | Yes |
| 01015000500 | 01 | 015 | 000500 | AL | Alabama | Calhoun County | 3 | South Region | 6 | East South Central Division | 1731 | 1175 | 743 | 1042 | 1619 | 64.36072 | 0.9767 | 1 | 124 | 472 | 26.271186 | 0.98460 | 1 | 136 | 461 | 29.50108 | 0.48970 | 0 | 163 | 282 | 57.80142 | 0.7919 | 1 | 299 | 743 | 40.24226 | 0.64910 | 0 | 340 | 1270 | 26.77165 | 0.8389 | 1 | 460 | 1794 | 25.641026 | 0.8722 | 1 | 271 | 15.655690 | 0.70190 | 0 | 368 | 21.259388 | 0.32190 | 0 | 507 | 1449 | 34.98965 | 0.9885 | 1 | 150 | 386 | 38.86010 | 0.9269 | 1 | 0 | 1677 | 0.000000 | 0.09298 | 0 | 1559 | 1731 | 90.06355 | 0.9123 | 1 | 1175 | 50 | 4.255319 | 0.5128 | 0 | 4 | 0.3404255 | 0.4480 | 0 | 0 | 743 | 0.0000000 | 0.1238 | 0 | 122 | 743 | 16.419919 | 0.8473 | 1 | 0 | 1731 | 0.00000 | 0.3640 | 0 | 4.32150 | 0.9362 | 4 | 3.03218 | 0.7679 | 2 | 0.9123 | 0.9038 | 1 | 2.2959 | 0.3818 | 1 | 10.56188 | 0.8244 | 8 | 940 | 907 | 488 | 586 | 940 | 62.34043 | 0.9815 | 1 | 59 | 297 | 19.865320 | 0.9833 | 1 | 100 | 330 | 30.303030 | 0.79220 | 1 | 58 | 158 | 36.70886 | 0.3497 | 0 | 158 | 488 | 32.37705 | 0.6020 | 0 | 199 | 795 | 25.03145 | 0.8930 | 1 | 118 | 940 | 12.553192 | 0.7770 | 1 | 246 | 26.170213 | 0.90530 | 1 | 118 | 12.553192 | 0.08233 | 0 | 383 | 822.5089 | 46.56484 | 0.9984 | 1 | 30 | 197.8892 | 15.16000 | 0.5363 | 0 | 0 | 889 | 0.0000000 | 0.09479 | 0 | 898 | 940.3866 | 95.49264 | 0.9489 | 1 | 907 | 0 | 0.000000 | 0.1079 | 0 | 2 | 0.2205072 | 0.4456 | 0 | 2 | 488 | 0.4098361 | 0.23670 | 0 | 146 | 487.6463 | 29.939736 | 0.9404 | 1 | 0 | 940 | 0.000000 | 0.1831 | 0 | 4.2368 | 0.9379 | 4 | 2.61712 | 0.5593 | 2 | 0.9489 | 0.9409 | 1 | 1.91370 | 0.2196 | 1 | 9.71652 | 0.7468 | 8 | 0 | 0 | 0 | 0 | 0 | Yes |
| 01015000600 | 01 | 015 | 000600 | AL | Alabama | Calhoun County | 3 | South Region | 6 | East South Central Division | 2571 | 992 | 796 | 1394 | 2133 | 65.35396 | 0.9789 | 1 | 263 | 905 | 29.060773 | 0.98990 | 1 | 121 | 306 | 39.54248 | 0.75940 | 1 | 209 | 490 | 42.65306 | 0.4481 | 0 | 330 | 796 | 41.45729 | 0.68030 | 0 | 641 | 1556 | 41.19537 | 0.9554 | 1 | 416 | 1760 | 23.636364 | 0.8383 | 1 | 220 | 8.556982 | 0.24910 | 0 | 584 | 22.714897 | 0.41610 | 0 | 539 | 1353 | 39.83740 | 0.9955 | 1 | 243 | 466 | 52.14592 | 0.9783 | 1 | 30 | 2366 | 1.267963 | 0.48990 | 0 | 1944 | 2571 | 75.61260 | 0.8440 | 1 | 992 | 164 | 16.532258 | 0.7673 | 1 | 8 | 0.8064516 | 0.5110 | 0 | 46 | 796 | 5.7788945 | 0.8329 | 1 | 184 | 796 | 23.115578 | 0.9049 | 1 | 614 | 2571 | 23.88176 | 0.9734 | 1 | 4.44280 | 0.9548 | 4 | 3.12890 | 0.8088 | 2 | 0.8440 | 0.8362 | 1 | 3.9895 | 0.9792 | 4 | 12.40520 | 0.9696 | 11 | 1950 | 964 | 719 | 837 | 1621 | 51.63479 | 0.9467 | 1 | 157 | 652 | 24.079755 | 0.9922 | 1 | 22 | 364 | 6.043956 | 0.01547 | 0 | 129 | 355 | 36.33803 | 0.3420 | 0 | 151 | 719 | 21.00139 | 0.2303 | 0 | 363 | 1387 | 26.17159 | 0.9048 | 1 | 351 | 1613 | 21.760694 | 0.9435 | 1 | 249 | 12.769231 | 0.32090 | 0 | 356 | 18.256410 | 0.27140 | 0 | 332 | 1259.7041 | 26.35540 | 0.9135 | 1 | 136 | 435.6156 | 31.22018 | 0.8775 | 1 | 0 | 1891 | 0.0000000 | 0.09479 | 0 | 1463 | 1949.9821 | 75.02633 | 0.8219 | 1 | 964 | 14 | 1.452282 | 0.3459 | 0 | 8 | 0.8298755 | 0.5269 | 0 | 19 | 719 | 2.6425591 | 0.61120 | 0 | 197 | 719.0542 | 27.397100 | 0.9316 | 1 | 329 | 1950 | 16.871795 | 0.9655 | 1 | 4.0175 | 0.9001 | 4 | 2.47809 | 0.4764 | 2 | 0.8219 | 0.8149 | 1 | 3.38110 | 0.8712 | 2 | 10.69859 | 0.8583 | 9 | 0 | 0 | 0 | 0 | 0 | Yes |
| 01015002101 | 01 | 015 | 002101 | AL | Alabama | Calhoun County | 3 | South Region | 6 | East South Central Division | 3872 | 1454 | 1207 | 1729 | 2356 | 73.38710 | 0.9916 | 1 | 489 | 2020 | 24.207921 | 0.97860 | 1 | 20 | 168 | 11.90476 | 0.02541 | 0 | 718 | 1039 | 69.10491 | 0.9332 | 1 | 738 | 1207 | 61.14333 | 0.96900 | 1 | 113 | 725 | 15.58621 | 0.6035 | 0 | 664 | 3943 | 16.839970 | 0.6495 | 0 | 167 | 4.313016 | 0.05978 | 0 | 238 | 6.146694 | 0.02255 | 0 | 264 | 2359 | 11.19118 | 0.3027 | 0 | 94 | 263 | 35.74144 | 0.9050 | 1 | 46 | 3769 | 1.220483 | 0.48250 | 0 | 1601 | 3872 | 41.34814 | 0.6572 | 0 | 1454 | 761 | 52.338377 | 0.9504 | 1 | 65 | 4.4704264 | 0.6738 | 0 | 5 | 1207 | 0.4142502 | 0.2791 | 0 | 113 | 1207 | 9.362055 | 0.7004 | 0 | 1516 | 3872 | 39.15289 | 0.9860 | 1 | 4.19220 | 0.9133 | 3 | 1.77253 | 0.1304 | 1 | 0.6572 | 0.6511 | 0 | 3.5897 | 0.9337 | 2 | 10.21163 | 0.7885 | 6 | 3238 | 1459 | 1014 | 1082 | 1836 | 58.93246 | 0.9735 | 1 | 251 | 1403 | 17.890235 | 0.9767 | 1 | 31 | 155 | 20.000000 | 0.44920 | 0 | 515 | 859 | 59.95343 | 0.8554 | 1 | 546 | 1014 | 53.84615 | 0.9535 | 1 | 134 | 916 | 14.62882 | 0.7033 | 0 | 251 | 3238 | 7.751699 | 0.5588 | 0 | 167 | 5.157505 | 0.03597 | 0 | 169 | 5.219271 | 0.02111 | 0 | 323 | 1667.0000 | 19.37612 | 0.7205 | 0 | 94 | 277.0000 | 33.93502 | 0.9040 | 1 | 0 | 3164 | 0.0000000 | 0.09479 | 0 | 1045 | 3238.0000 | 32.27301 | 0.5125 | 0 | 1459 | 607 | 41.603838 | 0.9185 | 1 | 65 | 4.4551062 | 0.6949 | 0 | 24 | 1014 | 2.3668639 | 0.57900 | 0 | 85 | 1014.0000 | 8.382643 | 0.6775 | 0 | 1402 | 3238 | 43.298332 | 0.9876 | 1 | 4.1658 | 0.9263 | 3 | 1.77637 | 0.1225 | 1 | 0.5125 | 0.5082 | 0 | 3.85750 | 0.9661 | 2 | 10.31217 | 0.8160 | 6 | 0 | 0 | 0 | 0 | 0 | Yes |
svi_national_lihtc_county_sum <- summarize_county_lihtc(svi_national_lihtc)

svi_national_lihtc_county_sum %>% head() %>% kbl() %>% kable_styling() %>% scroll_box(width = "100%")
| State | County | Division | post10_lihtc_project_cnt | tract_cnt | post10_lihtc_project_dollars | post10_lihtc_dollars_formatted |
|---|---|---|---|---|---|---|
| AK | Bethel Census Area | Pacific Division | 0 | 2 | 0 | \$0 |
| AK | Dillingham Census Area | Pacific Division | 0 | 1 | 0 | \$0 |
| AK | Kenai Peninsula Borough | Pacific Division | 0 | 1 | 0 | \$0 |
| AK | Nome Census Area | Pacific Division | 0 | 1 | 0 | \$0 |
| AK | Yukon-Koyukuk Census Area | Pacific Division | 0 | 2 | 0 | \$0 |
| AL | Barbour County | East South Central Division | 0 | 1 | 0 | \$0 |
svi_divisional_lihtc_county_sum <- summarize_county_lihtc(svi_divisional_lihtc)
svi_divisional_lihtc_county_sum %>% head() %>% kbl() %>% kable_styling() %>% scroll_box(width = "100%")
| State | County | Division | post10_lihtc_project_cnt | tract_cnt | post10_lihtc_project_dollars | post10_lihtc_dollars_formatted |
|---|---|---|---|---|---|---|
| DC | District of Columbia | South Atlantic Division | 21 | 53 | 11695555 | \$11,695,555 |
| DE | New Castle County | South Atlantic Division | 2 | 3 | 0 | \$0 |
| FL | Alachua County | South Atlantic Division | 0 | 1 | 0 | \$0 |
| FL | Bay County | South Atlantic Division | 1 | 2 | 0 | \$0 |
| FL | Brevard County | South Atlantic Division | 0 | 1 | 0 | \$0 |
| FL | Broward County | South Atlantic Division | 3 | 17 | 2561000 | \$2,561,000 |
Create data frame of LIHTC eligible tracts 2010 nationally
# Create data frame of LIHTC eligible tracts 2010 nationally
svi_national_lihtc10 <- svi_national_lihtc %>% select(GEOID_2010_trt, FIPS_st, FIPS_county,
    state, state_name, county, region_number, region, division_number,
    division, F_TOTAL_10, E_TOTPOP_10) %>% rename("F_TOTAL" = "F_TOTAL_10")

# Count national-level SVI flags for 2010, create unified fips column
svi_2010_national_county_flags_lihtc <- flag_summarize(svi_national_lihtc10, "E_TOTPOP_10") %>% unite("fips_county_st", FIPS_st:FIPS_county, remove = FALSE, sep="")

# Add suffix to flag columns 2010
colnames(svi_2010_national_county_flags_lihtc)[11:15] <- paste0(colnames(svi_2010_national_county_flags_lihtc)[11:15], 10)

# Create data frame of LIHTC eligible tracts 2020 nationally
svi_national_lihtc20 <- svi_national_lihtc %>% select(GEOID_2010_trt, FIPS_st, FIPS_county,
    state, state_name, county, region_number, region, division_number,
    division, F_TOTAL_20, E_TOTPOP_20) %>% rename("F_TOTAL" = "F_TOTAL_20")

# Count national-level SVI flags for 2020, create unified fips column
svi_2020_national_county_flags_lihtc <- flag_summarize(svi_national_lihtc20, "E_TOTPOP_20") %>% unite("fips_county_st", FIPS_st:FIPS_county, remove = FALSE, sep="")

# Identify needed columns for 2020, add suffix
colnames(svi_2020_national_county_flags_lihtc)[11:15] <- paste0(colnames(svi_2020_national_county_flags_lihtc)[11:15], "20")

# Filter to needed columns for 2020 to avoid duplicate column column names
svi_2020_national_county_flags_join_lihtc <- svi_2020_national_county_flags_lihtc %>% ungroup() %>% select("fips_county_st", all_of(colnames(svi_2020_national_county_flags_lihtc)[11:15]))

# Join 2010 and 2020 data
svi_national_county_flags_lihtc <- left_join(svi_2010_national_county_flags_lihtc, svi_2020_national_county_flags_join_lihtc, join_by("fips_county_st" == "fips_county_st"))

svi_national_county_flags_lihtc %>% head() %>% kbl() %>% kable_styling() %>% scroll_box(width = "100%")
| fips_county_st | FIPS_st | FIPS_county | state | state_name | county | region_number | region | division_number | division | flag_count10 | pop10 | flag_by_pop10 | flag_count_quantile10 | flag_pop_quantile10 | flag_count20 | pop20 | flag_by_pop20 | flag_count_quantile20 | flag_pop_quantile20 |
|---|---|---|---|---|---|---|---|---|---|---|---|---|---|---|---|---|---|---|---|
| 01005 | 01 | 005 | AL | Alabama | Barbour County | 3 | South Region | 6 | East South Central Division | 6 | 1753 | 0.0034227 | 0.2 | 0.8 | 7 | 1527 | 0.0045842 | 0.2 | 1.0 |
| 01011 | 01 | 011 | AL | Alabama | Bullock County | 3 | South Region | 6 | East South Central Division | 6 | 1652 | 0.0036320 | 0.2 | 0.8 | 8 | 1382 | 0.0057887 | 0.4 | 1.0 |
| 01015 | 01 | 015 | AL | Alabama | Calhoun County | 3 | South Region | 6 | East South Central Division | 40 | 15130 | 0.0026438 | 0.8 | 0.6 | 37 | 11783 | 0.0031401 | 0.8 | 0.8 |
| 01023 | 01 | 023 | AL | Alabama | Choctaw County | 3 | South Region | 6 | East South Central Division | 12 | 5578 | 0.0021513 | 0.6 | 0.4 | 15 | 5412 | 0.0027716 | 0.6 | 0.8 |
| 01031 | 01 | 031 | AL | Alabama | Coffee County | 3 | South Region | 6 | East South Central Division | 12 | 8139 | 0.0014744 | 0.6 | 0.2 | 13 | 8517 | 0.0015264 | 0.6 | 0.2 |
| 01033 | 01 | 033 | AL | Alabama | Colbert County | 3 | South Region | 6 | East South Central Division | 10 | 1983 | 0.0050429 | 0.4 | 1.0 | 8 | 1931 | 0.0041429 | 0.4 | 1.0 |
svi_national_county_lihtc <- left_join(svi_national_lihtc_county_sum,
                                      svi_national_county_flags_lihtc,
                                    join_by("State" == "state", "County" == "county",
                                            "Division" == "division"))

svi_national_county_lihtc$post10_lihtc_project_cnt[is.na(svi_national_county_lihtc$post10_lihtc_project_cnt)] <- 0

svi_national_county_lihtc$county_name <- paste0(svi_national_county_lihtc$County, ", ", svi_national_county_lihtc$State)

svi_national_county_lihtc %>% head() %>% kbl() %>% kable_styling() %>% scroll_box(width = "100%")
| State | County | Division | post10_lihtc_project_cnt | tract_cnt | post10_lihtc_project_dollars | post10_lihtc_dollars_formatted | fips_county_st | FIPS_st | FIPS_county | state_name | region_number | region | division_number | flag_count10 | pop10 | flag_by_pop10 | flag_count_quantile10 | flag_pop_quantile10 | flag_count20 | pop20 | flag_by_pop20 | flag_count_quantile20 | flag_pop_quantile20 | county_name |
|---|---|---|---|---|---|---|---|---|---|---|---|---|---|---|---|---|---|---|---|---|---|---|---|---|
| AK | Bethel Census Area | Pacific Division | 0 | 2 | 0 | \$0 | 02050 | 02 | 050 | Alaska | 4 | West Region | 9 | 18 | 10867 | 0.0016564 | 0.6 | 0.4 | 20 | 11715 | 0.0017072 | 0.8 | 0.4 | Bethel Census Area, AK |
| AK | Dillingham Census Area | Pacific Division | 0 | 1 | 0 | \$0 | 02070 | 02 | 070 | Alaska | 4 | West Region | 9 | 9 | 2569 | 0.0035033 | 0.4 | 0.8 | 10 | 2801 | 0.0035702 | 0.4 | 0.8 | Dillingham Census Area, AK |
| AK | Kenai Peninsula Borough | Pacific Division | 0 | 1 | 0 | \$0 | 02122 | 02 | 122 | Alaska | 4 | West Region | 9 | 7 | 251 | 0.0278884 | 0.2 | 1.0 | 8 | 531 | 0.0150659 | 0.4 | 1.0 | Kenai Peninsula Borough, AK |
| AK | Nome Census Area | Pacific Division | 0 | 1 | 0 | \$0 | 02180 | 02 | 180 | Alaska | 4 | West Region | 9 | 9 | 5766 | 0.0015609 | 0.4 | 0.2 | 10 | 5901 | 0.0016946 | 0.4 | 0.4 | Nome Census Area, AK |
| AK | Yukon-Koyukuk Census Area | Pacific Division | 0 | 2 | 0 | \$0 | 02290 | 02 | 290 | Alaska | 4 | West Region | 9 | 18 | 2300 | 0.0078261 | 0.6 | 1.0 | 21 | 2153 | 0.0097538 | 0.8 | 1.0 | Yukon-Koyukuk Census Area, AK |
| AL | Barbour County | East South Central Division | 0 | 1 | 0 | \$0 | 01005 | 01 | 005 | Alabama | 3 | South Region | 6 | 6 | 1753 | 0.0034227 | 0.2 | 0.8 | 7 | 1527 | 0.0045842 | 0.2 | 1.0 | Barbour County, AL |
Create data frame of LIHTC eligible tracts 2020 nationally
# Create data frame of LIHTC eligible tracts 2020 nationally
svi_divisional_lihtc10 <- svi_divisional_lihtc %>% select(GEOID_2010_trt, FIPS_st, FIPS_county,
    state, state_name, county, region_number, region, division_number,
    division, F_TOTAL_10, E_TOTPOP_10) %>% rename("F_TOTAL" = "F_TOTAL_10")

# Count divisional-level SVI flags for 2010, create unified fips column
svi_2010_divisional_county_flags_lihtc <- flag_summarize(svi_divisional_lihtc10, "E_TOTPOP_10") %>% unite("fips_county_st", FIPS_st:FIPS_county, remove = FALSE, sep="")

# Add suffix to flag columns 2010
colnames(svi_2010_divisional_county_flags_lihtc)[11:15] <- paste0(colnames(svi_2010_divisional_county_flags_lihtc)[11:15], "10")

# Create data frame of LIHTC eligible tracts 2020 nationally
svi_divisional_lihtc20 <- svi_divisional_lihtc %>% select(GEOID_2010_trt, FIPS_st, FIPS_county,
    state, state_name, county, region_number, region, division_number,
    division, F_TOTAL_20, E_TOTPOP_20) %>% rename("F_TOTAL" = "F_TOTAL_20")

# Count divisional-level SVI flags for 2020, create unified fips column
svi_2020_divisional_county_flags_lihtc <- flag_summarize(svi_divisional_lihtc20, "E_TOTPOP_20") %>% unite("fips_county_st", FIPS_st:FIPS_county, remove = FALSE, sep="")

# Identify needed columns for 2020
colnames(svi_2020_divisional_county_flags_lihtc)[11:15] <- paste0(colnames(svi_2020_divisional_county_flags_lihtc)[11:15], "20")

# Filter to needed columns for 2020 to avoid duplicate column column names
svi_2020_divisional_county_flags_join_lihtc <- svi_2020_divisional_county_flags_lihtc %>% ungroup() %>% select("fips_county_st", all_of(colnames(svi_2020_divisional_county_flags_lihtc)[11:15]))

# Join 2010 and 2020 data
svi_divisional_county_flags_lihtc <- left_join(svi_2010_divisional_county_flags_lihtc, svi_2020_divisional_county_flags_join_lihtc, join_by("fips_county_st" == "fips_county_st"))

svi_divisional_county_flags_lihtc %>% head() %>% kbl() %>% kable_styling() %>% scroll_box(width = "100%")
| fips_county_st | FIPS_st | FIPS_county | state | state_name | county | region_number | region | division_number | division | flag_count10 | pop10 | flag_by_pop10 | flag_count_quantile10 | flag_pop_quantile10 | flag_count20 | pop20 | flag_by_pop20 | flag_count_quantile20 | flag_pop_quantile20 |
|---|---|---|---|---|---|---|---|---|---|---|---|---|---|---|---|---|---|---|---|
| 10003 | 10 | 003 | DE | Delaware | New Castle County | 3 | South Region | 5 | South Atlantic Division | 24 | 11503 | 0.0020864 | 0.8 | 0.4 | 23 | 11693 | 0.0019670 | 0.8 | 0.4 |
| 11001 | 11 | 001 | DC | District of Columbia | District of Columbia | 3 | South Region | 5 | South Atlantic Division | 407 | 157923 | 0.0025772 | 1.0 | 0.6 | 387 | 192201 | 0.0020135 | 1.0 | 0.4 |
| 12001 | 12 | 001 | FL | Florida | Alachua County | 3 | South Region | 5 | South Atlantic Division | 7 | 6610 | 0.0010590 | 0.4 | 0.2 | 5 | 7702 | 0.0006492 | 0.2 | 0.2 |
| 12005 | 12 | 005 | FL | Florida | Bay County | 3 | South Region | 5 | South Atlantic Division | 17 | 5145 | 0.0033042 | 0.8 | 0.8 | 12 | 4297 | 0.0027926 | 0.6 | 0.8 |
| 12009 | 12 | 009 | FL | Florida | Brevard County | 3 | South Region | 5 | South Atlantic Division | 9 | 2367 | 0.0038023 | 0.4 | 1.0 | 8 | 3293 | 0.0024294 | 0.4 | 0.6 |
| 12011 | 12 | 011 | FL | Florida | Broward County | 3 | South Region | 5 | South Atlantic Division | 166 | 71933 | 0.0023077 | 1.0 | 0.6 | 160 | 84636 | 0.0018904 | 1.0 | 0.4 |
svi_divisional_county_lihtc <- left_join(svi_divisional_lihtc_county_sum,
                                        svi_divisional_county_flags_lihtc,
                                    join_by("State" == "state", "County" == "county",
                                            "Division" == "division"))

svi_divisional_county_lihtc$post10_lihtc_project_cnt[is.na(svi_divisional_county_lihtc $post10_lihtc_project_cnt)] <- 0

svi_divisional_county_lihtc$county_name <- paste0(svi_divisional_county_lihtc$County, ", ", svi_divisional_county_lihtc$State)

svi_divisional_county_lihtc %>% head() %>% kbl() %>% kable_styling() %>% scroll_box(width = "100%")
| State | County | Division | post10_lihtc_project_cnt | tract_cnt | post10_lihtc_project_dollars | post10_lihtc_dollars_formatted | fips_county_st | FIPS_st | FIPS_county | state_name | region_number | region | division_number | flag_count10 | pop10 | flag_by_pop10 | flag_count_quantile10 | flag_pop_quantile10 | flag_count20 | pop20 | flag_by_pop20 | flag_count_quantile20 | flag_pop_quantile20 | county_name |
|---|---|---|---|---|---|---|---|---|---|---|---|---|---|---|---|---|---|---|---|---|---|---|---|---|
| DC | District of Columbia | South Atlantic Division | 21 | 53 | 11695555 | \$11,695,555 | 11001 | 11 | 001 | District of Columbia | 3 | South Region | 5 | 407 | 157923 | 0.0025772 | 1.0 | 0.6 | 387 | 192201 | 0.0020135 | 1.0 | 0.4 | District of Columbia, DC |
| DE | New Castle County | South Atlantic Division | 2 | 3 | 0 | \$0 | 10003 | 10 | 003 | Delaware | 3 | South Region | 5 | 24 | 11503 | 0.0020864 | 0.8 | 0.4 | 23 | 11693 | 0.0019670 | 0.8 | 0.4 | New Castle County, DE |
| FL | Alachua County | South Atlantic Division | 0 | 1 | 0 | \$0 | 12001 | 12 | 001 | Florida | 3 | South Region | 5 | 7 | 6610 | 0.0010590 | 0.4 | 0.2 | 5 | 7702 | 0.0006492 | 0.2 | 0.2 | Alachua County, FL |
| FL | Bay County | South Atlantic Division | 1 | 2 | 0 | \$0 | 12005 | 12 | 005 | Florida | 3 | South Region | 5 | 17 | 5145 | 0.0033042 | 0.8 | 0.8 | 12 | 4297 | 0.0027926 | 0.6 | 0.8 | Bay County, FL |
| FL | Brevard County | South Atlantic Division | 0 | 1 | 0 | \$0 | 12009 | 12 | 009 | Florida | 3 | South Region | 5 | 9 | 2367 | 0.0038023 | 0.4 | 1.0 | 8 | 3293 | 0.0024294 | 0.4 | 0.6 | Brevard County, FL |
| FL | Broward County | South Atlantic Division | 3 | 17 | 2561000 | \$2,561,000 | 12011 | 12 | 011 | Florida | 3 | South Region | 5 | 166 | 71933 | 0.0023077 | 1.0 | 0.6 | 160 | 84636 | 0.0018904 | 1.0 | 0.4 | Broward County, FL |
Exporatory Data Analysis
National Data Summary
svi_national_county_nmtc_projects <- svi_national_county_nmtc %>% filter(post10_nmtc_project_cnt > 0)
summary(svi_national_county_nmtc_projects$flag_count10)
##    Min. 1st Qu.  Median    Mean 3rd Qu.    Max.
##       0      19      40     177     132    9936
summary(svi_national_county_nmtc_projects$post10_nmtc_project_dollars)
##      Min.   1st Qu.    Median      Mean   3rd Qu.      Max.
##      5154   5970000  12760000  30332743  28505000 987407086
Looking into our data, we see a large variety between minimum and maximums for both flags as well as dollars. Our means however, are much closer to our first and third quartials than to the maximium values. This could indicate that we have outliers skewing our results.
# Scatterplot
# y is our independent variable (NMTC Project Dollars),
# x is our dependent variable (SVI flag count)
ggplot2::ggplot(svi_national_county_nmtc_projects,
                aes(x=flag_count10,
                    y=post10_nmtc_project_dollars)) +
        geom_point() +
        geom_smooth(method="lm") +
        scale_y_continuous(labels = scales::dollar_format())
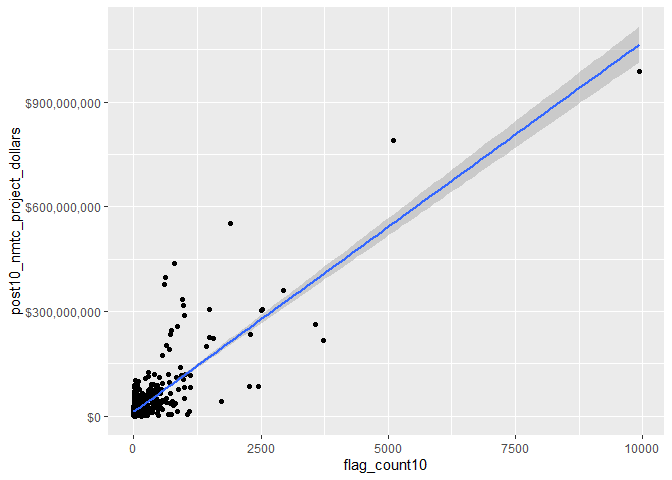
# Pearson's r calculation
cor(svi_national_county_nmtc_projects$flag_count10, svi_national_county_nmtc_projects$post10_nmtc_project_dollars, method = "pearson")
## [1] 0.8197007
While we do see a strong correlation with out Pearson’s R Calculation, looking at our data in a scatterplot confirms that our data is likely skewed.
boxplot(svi_national_county_nmtc_projects$flag_count10)
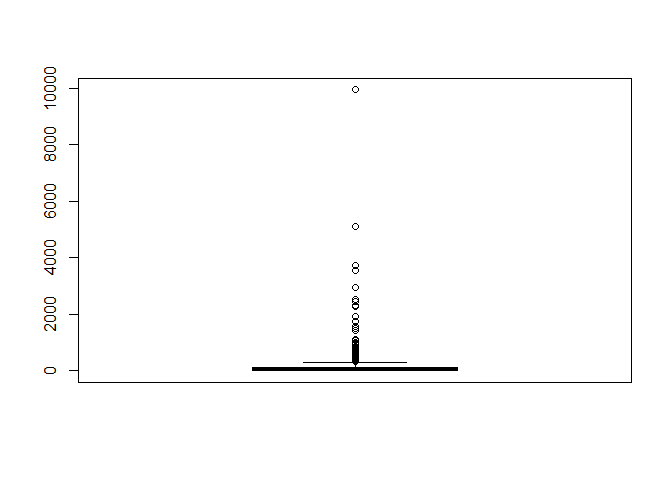
boxplot.stats(svi_national_county_nmtc_projects$flag_count10)$out %>% sort(decreasing = TRUE)
##   [1] 9936 5111 3732 3561 2941 2537 2508 2453 2296 2279 1906 1731 1569 1489 1486
##  [16] 1436 1110 1106 1096 1057 1013 1004  995  991  984  977  960  942  919  871
##  [31]  854  850  836  822  795  774  759  746  731  728  718  714  705  701  691
##  [46]  682  651  650  641  629  595  572  571  569  564  546  541  531  517  499
##  [61]  491  487  484  468  467  463  461  458  458  455  451  442  429  423  422
##  [76]  413  413  408  401  399  389  381  378  378  377  374  369  363  362  358
##  [91]  356  355  352  350  349  349  342  341  338  328  326  318  316  313
svi_national_nmtc_cluster <- svi_national_county_nmtc_projects %>%
                            select(county_name, post10_nmtc_project_dollars,
                                   flag_count10) %>%
                            remove_rownames %>%
                            column_to_rownames(var="county_name")

# Remove nulls, if in dataset
svi_national_nmtc_cluster <- na.omit(svi_national_nmtc_cluster)


# Scale numeric variables
svi_national_nmtc_cluster <- scale(svi_national_nmtc_cluster)


svi_national_nmtc_cluster %>% head(5)
##                               post10_nmtc_project_dollars flag_count10
## Aleutians East Borough, AK                     -0.2125961   -0.3189664
## Anchorage Municipality, AK                     -0.2995956   -0.1981871
## Wade Hampton Census Area, AK                   -0.1300468   -0.3170792
## Yukon-Koyukuk Census Area, AK                  -0.3310540   -0.2831100
## Baldwin County, AL                             -0.1906291   -0.2698998
set.seed(123)
k2_nmtc_nat <- kmeans(svi_national_nmtc_cluster, centers = 2, nstart = 25)
set.seed(123)
k3_nmtc_nat <- kmeans(svi_national_nmtc_cluster, centers = 3, nstart = 25)
set.seed(123)
k4_nmtc_nat <- kmeans(svi_national_nmtc_cluster, centers = 4, nstart = 25)
set.seed(123)
k5_nmtc_nat <- kmeans(svi_national_nmtc_cluster, centers = 5, nstart = 25)
# plots to compare
p_k2_nmtc_nat <- factoextra::fviz_cluster(k2_nmtc_nat, geom = "point", data = svi_national_nmtc_cluster) + ggtitle("k = 2")

p_k3_nmtc_nat <- factoextra::fviz_cluster(k3_nmtc_nat, geom = "point", data = svi_national_nmtc_cluster) + ggtitle("k = 3")

p_k4_nmtc_nat <- factoextra::fviz_cluster(k4_nmtc_nat, geom = "point",  data = svi_national_nmtc_cluster) + ggtitle("k = 4")

p_k5_nmtc_nat <- factoextra::fviz_cluster(k5_nmtc_nat, geom = "point",  data = svi_national_nmtc_cluster) + ggtitle("k = 5")

grid.arrange(p_k2_nmtc_nat, p_k3_nmtc_nat, p_k4_nmtc_nat, p_k5_nmtc_nat, nrow = 2)
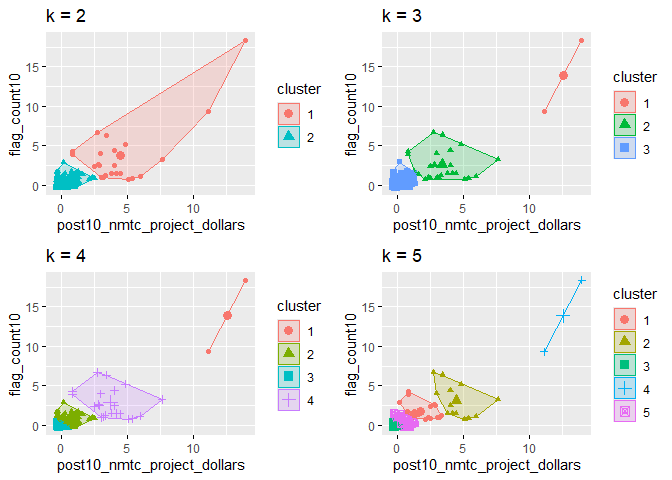
elbow_plot(svi_national_nmtc_cluster)
##  [1]  1  2  3  4  5  6  7  8  9 10 11 12 13 14 15
## [1] 1
## [1] 2
## [1] 3
## [1] 4
## [1] 5
## [1] 6
## [1] 7
## [1] 8
## [1] 9
## [1] 10
## [1] 11
## [1] 12
## [1] 13
## [1] 14
## [1] 15
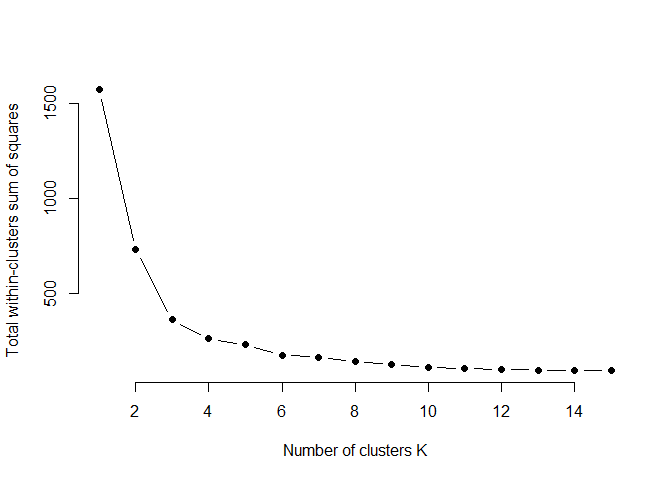
It appears that it would be best to view our data in clusters of three, so we can look at different groupings and see how the data correlates without as much bias.
p_k3_nmtc_nat <- factoextra::fviz_cluster(k3_nmtc_nat, geom = "point", data = svi_national_nmtc_cluster) + ggtitle("k = 3")

p_k3_nmtc_nat
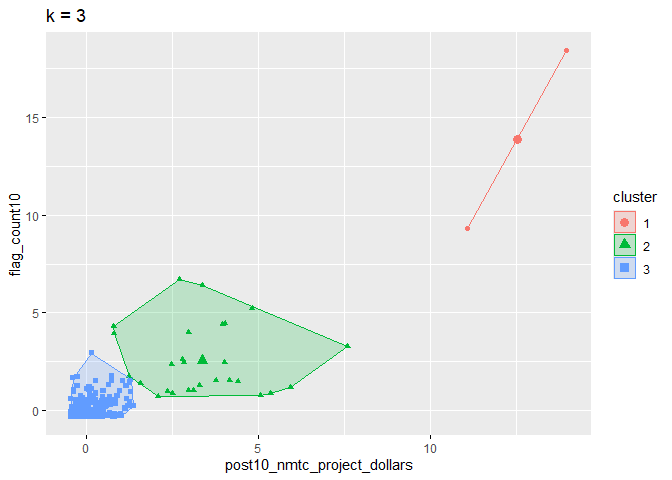
svi_national_nmtc_cluster_label <- as.data.frame(svi_national_nmtc_cluster) %>%
                                  rownames_to_column(var = "county_name") %>%
                                  as_tibble() %>%
                                  mutate(cluster = k3_nmtc_nat$cluster) %>%
                                  select(county_name, cluster)

svi_national_county_nmtc_projects2 <- left_join(svi_national_county_nmtc_projects, svi_national_nmtc_cluster_label, join_by(county_name == county_name))

# View county counts in each cluster
table(svi_national_county_nmtc_projects2$cluster)
##
##   1   2   3
##   2  27 758
# Cluster 1 Scatterplot
# y is our independent variable (NMTC Project Dollars),
# x is our dependent variable (SVI flag count)

svi_national_county_nmtc_projects2 %>%
  filter(cluster == 1) %>%
  ggplot2::ggplot(aes(x=flag_count10,
                    y=post10_nmtc_project_dollars)) +
        geom_point() +
        geom_smooth(method="lm") +
        scale_y_continuous(labels = scales::dollar_format())
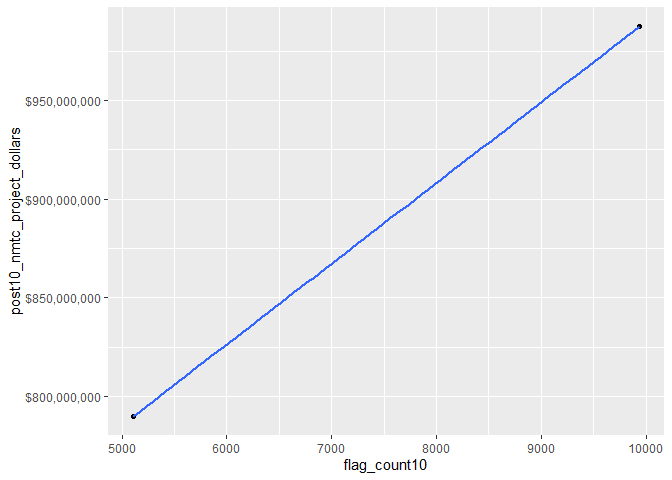
svi_national_county_nmtc_projects2 %>%
  filter(cluster == 1) %>%
  select(flag_count10,post10_nmtc_project_dollars) %>%
  cor(method = "pearson")
##                             flag_count10 post10_nmtc_project_dollars
## flag_count10                           1                           1
## post10_nmtc_project_dollars            1                           1
Looking at our fisrt cluster, we can see that there is a direct correlation between money spent and total flags. However, with only two groups in the cluster, it does not show enough data to show that this trend is true and repeatable.
svi_national_county_nmtc_projects2 %>%
  filter(cluster == 1) %>%
  select(county_name, flag_count10, post10_nmtc_dollars_formatted) %>% arrange(flag_count10) %>% kbl() %>% kable_styling() %>% scroll_box(width = "100%")
| county_name | flag_count10 | post10_nmtc_dollars_formatted |
|---|---|---|
| Cook County, IL | 5111 | \$790,158,215 |
| Los Angeles County, CA | 9936 | \$987,407,086 |
# Cluster 2 Scatterplot
# y is our independent variable (NMTC Project Dollars),
# x is our dependent variable (SVI flag count)

svi_national_county_nmtc_projects2 %>%
  filter(cluster == 2) %>%
  ggplot2::ggplot(aes(x=flag_count10,
                    y=post10_nmtc_project_dollars)) +
        geom_point() +
        geom_smooth(method="lm") +
        scale_y_continuous(labels = scales::dollar_format())
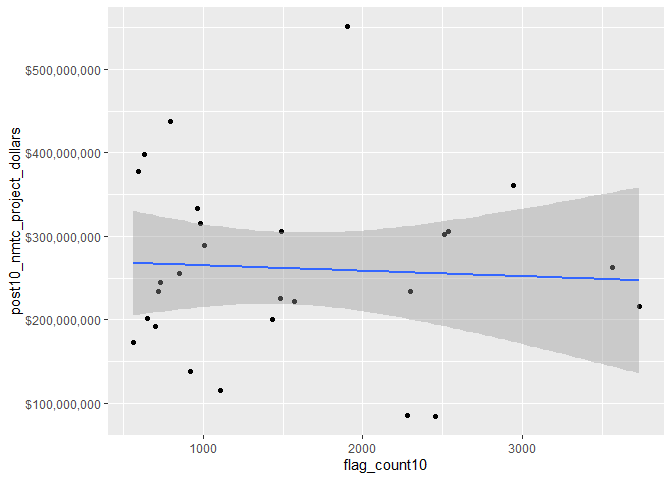
Looking at our group 2 on the other hand, we see no strong correlation between the amount of money and the amount of flags.
svi_national_county_nmtc_projects2 %>%
  filter(cluster == 2) %>%
  select(flag_count10,post10_nmtc_project_dollars) %>%
  cor(method = "pearson")
##                             flag_count10 post10_nmtc_project_dollars
## flag_count10                  1.00000000                 -0.05722041
## post10_nmtc_project_dollars  -0.05722041                  1.00000000
svi_national_county_nmtc_projects2 %>%
  filter(cluster == 2) %>%
  select(county_name, flag_count10, post10_nmtc_dollars_formatted) %>% arrange(flag_count10) %>% kbl() %>% kable_styling() %>% scroll_box(width = "100%")
| county_name | flag_count10 | post10_nmtc_dollars_formatted |
|---|---|---|
| Hennepin County, MN | 564 | \$173,393,000 |
| District of Columbia, DC | 595 | \$377,155,570 |
| Hamilton County, OH | 629 | \$397,543,856 |
| Jackson County, MO | 651 | \$201,937,281 |
| Suffolk County, MA | 701 | \$192,010,188 |
| Orleans Parish, LA | 718 | \$233,891,078 |
| Allegheny County, PA | 731 | \$244,342,400 |
| Fulton County, GA | 795 | \$437,737,000 |
| New York County, NY | 850 | \$255,545,686 |
| Marion County, IN | 919 | \$138,426,520 |
| Baltimore city, MD | 960 | \$333,109,232 |
| Milwaukee County, WI | 984 | \$315,495,493 |
| Shelby County, TN | 1004 | \$289,352,388 |
| Fresno County, CA | 1110 | \$115,258,480 |
| Bexar County, TX | 1436 | \$199,964,269 |
| Clark County, NV | 1486 | \$225,315,967 |
| Cuyahoga County, OH | 1489 | \$306,121,487 |
| San Diego County, CA | 1569 | \$221,738,411 |
| Philadelphia County, PA | 1906 | \$550,969,964 |
| Queens County, NY | 2279 | \$85,225,100 |
| Miami-Dade County, FL | 2296 | \$233,661,603 |
| Maricopa County, AZ | 2453 | \$84,923,464 |
| Dallas County, TX | 2508 | \$302,019,013 |
| Bronx County, NY | 2537 | \$306,355,715 |
| Wayne County, MI | 2941 | \$360,949,480 |
| Harris County, TX | 3561 | \$262,456,477 |
| Kings County, NY | 3732 | \$216,348,600 |
# Cluster 3 Scatterplot
# y is our independent variable (NMTC Project Dollars),
# x is our dependent variable (SVI flag count)

svi_national_county_nmtc_projects2 %>%
  filter(cluster == 3) %>%
  ggplot2::ggplot(aes(x=flag_count10,
                    y=post10_nmtc_project_dollars)) +
        geom_point() +
        geom_smooth(method="lm") +
        scale_y_continuous(labels = scales::dollar_format())
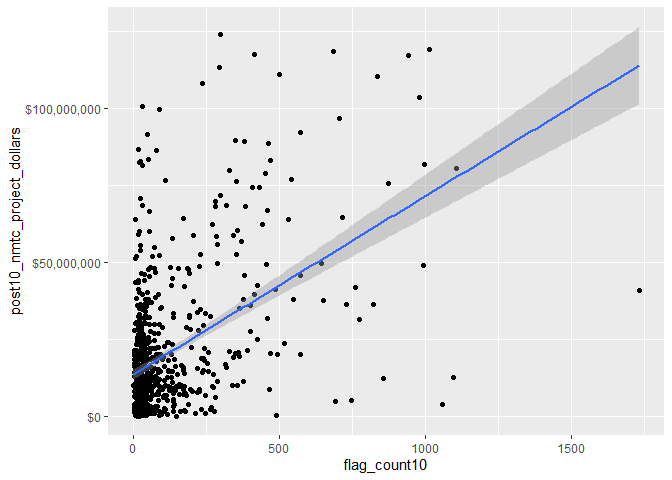
svi_national_county_nmtc_projects2 %>%
  filter(cluster == 3) %>%
  select(flag_count10,post10_nmtc_project_dollars) %>%
  cor(method = "pearson")
##                             flag_count10 post10_nmtc_project_dollars
## flag_count10                   1.0000000                   0.4736348
## post10_nmtc_project_dollars    0.4736348                   1.0000000
Finally, when we look at our third and largest cluster, we do see a positive trend. While it is nota very strong trend, it still does suggest some positive correlation.
# Recall that we are working with 2010 census tracts, thus we need to pull the 2010 shapefiles
county_sf = tigris::counties(year = 2010, cb = TRUE)
## | | | 0% | | | 1% | |= | 1% | |= | 2% | |== | 2% | |== | 3% | |=== | 4% | |=== | 5% | |==== | 5% | |==== | 6% | |===== | 7% | |===== | 8% | |====== | 8% | |====== | 9% | |======= | 9% | |======= | 10% | |======= | 11% | |======== | 11% | |======== | 12% | |========= | 12% | |========= | 13% | |========== | 14% | |========== | 15% | |=========== | 15% | |=========== | 16% | |============ | 17% | |============= | 18% | |============= | 19% | |============== | 19% | |============== | 20% | |=============== | 21% | |=============== | 22% | |================ | 22% | |================ | 23% | |================= | 24% | |================= | 25% | |================== | 25% | |=================== | 27% | |=================== | 28% | |==================== | 28% | |==================== | 29% | |===================== | 29% | |===================== | 30% | |====================== | 32% | |======================= | 32% | |======================= | 33% | |======================== | 34% | |======================== | 35% | |========================== | 37% | |========================== | 38% | |=========================== | 38% | |=========================== | 39% | |============================ | 39% | |============================ | 40% | |============================ | 41% | |============================= | 41% | |============================= | 42% | |============================== | 42% | |============================== | 43% | |============================== | 44% | |=============================== | 44% | |=============================== | 45% | |================================ | 45% | |================================ | 46% | |================================= | 47% | |================================= | 48% | |================================== | 48% | |================================== | 49% | |=================================== | 49% | |=================================== | 50% | |==================================== | 51% | |==================================== | 52% | |===================================== | 52% | |===================================== | 53% | |====================================== | 54% | |====================================== | 55% | |======================================= | 55% | |======================================= | 56% | |======================================== | 56% | |======================================== | 57% | |======================================== | 58% | |========================================= | 58% | |========================================= | 59% | |========================================== | 59% | |========================================== | 60% | |========================================== | 61% | |=========================================== | 61% | |============================================ | 63% | |============================================== | 65% | |=============================================== | 67% | |================================================ | 69% | |================================================== | 71% | |=================================================== | 73% | |===================================================== | 75% | |====================================================== | 77% | |======================================================= | 79% | |========================================================= | 81% | |========================================================== | 83% | |=========================================================== | 84% | |============================================================ | 86% | |============================================================= | 87% | |============================================================= | 88% | |============================================================== | 88% | |============================================================== | 89% | |=============================================================== | 89% | |=============================================================== | 90% | |=============================================================== | 91% | |================================================================ | 91% | |================================================================ | 92% | |================================================================= | 92% | |================================================================= | 93% | |================================================================== | 94% | |================================================================== | 95% | |=================================================================== | 95% | |=================================================================== | 96% | |==================================================================== | 97% | |==================================================================== | 98% | |======================================================================| 99% | |======================================================================| 100%
# Shift geometric locations of AK and HI
county_sf <- shift_geometry(
              county_sf,
              geoid_column = NULL,
              preserve_area = FALSE,
              position = c("below", "outside")
            )

st_sf <- tigris::states(year = 2010, cb = TRUE) %>% filter(STATE != "72")
## | | | 0% | |= | 1% | |=== | 4% | |==== | 6% | |===== | 8% | |====== | 9% | |=========== | 15% | |============= | 18% | |============== | 20% | |================ | 23% | |================= | 24% | |================== | 26% | |==================== | 29% | |===================== | 30% | |======================= | 33% | |======================== | 35% | |========================== | 36% | |============================ | 40% | |============================= | 41% | |============================== | 43% | |=============================== | 44% | |================================ | 46% | |================================== | 49% | |=================================== | 50% | |==================================== | 52% | |====================================== | 55% | |======================================== | 58% | |========================================== | 59% | |=========================================== | 61% | |============================================ | 62% | |============================================= | 64% | |=============================================== | 67% | |================================================ | 69% | |================================================= | 70% | |================================================== | 72% | |=================================================== | 73% | |===================================================== | 76% | |====================================================== | 78% | |========================================================= | 81% | |========================================================== | 82% | |=========================================================== | 84% | |============================================================ | 85% | |============================================================= | 87% | |=============================================================== | 90% | |================================================================ | 91% | |================================================================== | 94% | |==================================================================== | 98% | |======================================================================| 100%
# Shift geometric locations of AK and HI
st_sf <- shift_geometry(
              st_sf,
              geoid_column = NULL,
              preserve_area = FALSE,
              position = c("below", "outside")
            )
# Join our NMTC projects data with our shapefile geocoordinates
svi_national_county_nmtc_sf <- left_join(svi_national_county_nmtc_projects, county_sf, join_by("FIPS_st" == "STATEFP", "FIPS_county" == "COUNTYFP"))

svi_national_county_nmtc_sf %>% head(5) %>% kbl() %>% kable_styling() %>% scroll_box(width = "100%")
| State | County | Division | post10_nmtc_project_cnt | tract_cnt | post10_nmtc_project_dollars | post10_nmtc_dollars_formatted | fips_county_st | FIPS_st | FIPS_county | state_name | region_number | region | division_number | flag_count10 | pop10 | flag_by_pop10 | flag_count_quantile10 | flag_pop_quantile10 | flag_count20 | pop20 | flag_by_pop20 | flag_count_quantile20 | flag_pop_quantile20 | county_name | GEO_ID | STATE | COUNTY | NAME | LSAD | CENSUSAREA | geometry |
|---|---|---|---|---|---|---|---|---|---|---|---|---|---|---|---|---|---|---|---|---|---|---|---|---|---|---|---|---|---|---|---|
| AK | Aleutians East Borough | Pacific Division | 1 | 1 | 15762500 | \$15,762,500 | 02013 | 02 | 013 | Alaska | 4 | West Region | 9 | 8 | 3703 | 0.0021604 | 0.4 | 1.0 | 5 | 3389 | 0.0014754 | 0.2 | 0.8 | Aleutians East Borough, AK | 0500000US02013 | 02 | 013 | Aleutians East | Borough | 6981.943 | MULTIPOLYGON (((-2385249 -1… |
| AK | Anchorage Municipality | Pacific Division | 1 | 13 | 9800000 | \$9,800,000 | 02020 | 02 | 020 | Alaska | 4 | West Region | 9 | 72 | 64432 | 0.0011175 | 1.0 | 0.4 | 87 | 69679 | 0.0012486 | 1.0 | 0.6 | Anchorage Municipality, AK | 0500000US02020 | 02 | 020 | Anchorage | Muny | 1704.683 | MULTIPOLYGON (((-1927463 -1… |
| AK | Wade Hampton Census Area | Pacific Division | 1 | 1 | 21420000 | \$21,420,000 | 02270 | 02 | 270 | Alaska | 4 | West Region | 9 | 9 | 7398 | 0.0012165 | 0.4 | 0.6 | 10 | 8298 | 0.0012051 | 0.4 | 0.6 | Wade Hampton Census Area, AK | 0500000US02270 | 02 | 270 | Wade Hampton | CA | 17081.433 | MULTIPOLYGON (((-2310112 -1… |
| AK | Yukon-Koyukuk Census Area | Pacific Division | 1 | 3 | 7644000 | \$7,644,000 | 02290 | 02 | 290 | Alaska | 4 | West Region | 9 | 27 | 4027 | 0.0067047 | 0.8 | 1.0 | 31 | 3979 | 0.0077909 | 0.8 | 1.0 | Yukon-Koyukuk Census Area, AK | 0500000US02290 | 02 | 290 | Yukon-Koyukuk | CA | 145504.789 | MULTIPOLYGON (((-1736112 -9… |
| AL | Baldwin County | East South Central Division | 4 | 8 | 17268000 | \$17,268,000 | 01003 | 01 | 003 | Alabama | 3 | South Region | 6 | 34 | 38458 | 0.0008841 | 0.8 | 0.4 | 34 | 46255 | 0.0007351 | 0.8 | 0.2 | Baldwin County, AL | 0500000US01003 | 01 | 003 | Baldwin | County | 1589.784 | MULTIPOLYGON (((820813.4 -7… |
# Create classes for bivariate mapping
svi_national_county_nmtc_sf <- bi_class(svi_national_county_nmtc_sf, x = flag_count10, y = post10_nmtc_project_dollars, style = "quantile", dim = 3)

# View data
svi_national_county_nmtc_sf %>% head(5) %>% kbl() %>% kable_styling() %>% scroll_box(width = "100%")
| State | County | Division | post10_nmtc_project_cnt | tract_cnt | post10_nmtc_project_dollars | post10_nmtc_dollars_formatted | fips_county_st | FIPS_st | FIPS_county | state_name | region_number | region | division_number | flag_count10 | pop10 | flag_by_pop10 | flag_count_quantile10 | flag_pop_quantile10 | flag_count20 | pop20 | flag_by_pop20 | flag_count_quantile20 | flag_pop_quantile20 | county_name | GEO_ID | STATE | COUNTY | NAME | LSAD | CENSUSAREA | geometry | bi_class |
|---|---|---|---|---|---|---|---|---|---|---|---|---|---|---|---|---|---|---|---|---|---|---|---|---|---|---|---|---|---|---|---|---|
| AK | Aleutians East Borough | Pacific Division | 1 | 1 | 15762500 | \$15,762,500 | 02013 | 02 | 013 | Alaska | 4 | West Region | 9 | 8 | 3703 | 0.0021604 | 0.4 | 1.0 | 5 | 3389 | 0.0014754 | 0.2 | 0.8 | Aleutians East Borough, AK | 0500000US02013 | 02 | 013 | Aleutians East | Borough | 6981.943 | MULTIPOLYGON (((-2385249 -1… | 1-2 |
| AK | Anchorage Municipality | Pacific Division | 1 | 13 | 9800000 | \$9,800,000 | 02020 | 02 | 020 | Alaska | 4 | West Region | 9 | 72 | 64432 | 0.0011175 | 1.0 | 0.4 | 87 | 69679 | 0.0012486 | 1.0 | 0.6 | Anchorage Municipality, AK | 0500000US02020 | 02 | 020 | Anchorage | Muny | 1704.683 | MULTIPOLYGON (((-1927463 -1… | 2-2 |
| AK | Wade Hampton Census Area | Pacific Division | 1 | 1 | 21420000 | \$21,420,000 | 02270 | 02 | 270 | Alaska | 4 | West Region | 9 | 9 | 7398 | 0.0012165 | 0.4 | 0.6 | 10 | 8298 | 0.0012051 | 0.4 | 0.6 | Wade Hampton Census Area, AK | 0500000US02270 | 02 | 270 | Wade Hampton | CA | 17081.433 | MULTIPOLYGON (((-2310112 -1… | 1-3 |
| AK | Yukon-Koyukuk Census Area | Pacific Division | 1 | 3 | 7644000 | \$7,644,000 | 02290 | 02 | 290 | Alaska | 4 | West Region | 9 | 27 | 4027 | 0.0067047 | 0.8 | 1.0 | 31 | 3979 | 0.0077909 | 0.8 | 1.0 | Yukon-Koyukuk Census Area, AK | 0500000US02290 | 02 | 290 | Yukon-Koyukuk | CA | 145504.789 | MULTIPOLYGON (((-1736112 -9… | 2-1 |
| AL | Baldwin County | East South Central Division | 4 | 8 | 17268000 | \$17,268,000 | 01003 | 01 | 003 | Alabama | 3 | South Region | 6 | 34 | 38458 | 0.0008841 | 0.8 | 0.4 | 34 | 46255 | 0.0007351 | 0.8 | 0.2 | Baldwin County, AL | 0500000US01003 | 01 | 003 | Baldwin | County | 1589.784 | MULTIPOLYGON (((820813.4 -7… | 2-2 |
# Create map with ggplot
svi_national_county_nmtc_map <- ggplot() +
  # Map county shapefile, fill with bi_class categories
  geom_sf(data = svi_national_county_nmtc_sf, mapping = aes(geometry=geometry, fill = bi_class), color = "white", size = 0.1, show.legend = FALSE) +
  # Set to biscale palette
  bi_scale_fill(pal = "GrPink", dim = 3) +
  # Add state shapefiles for outline
  geom_sf(data=st_sf, color="black", fill=NA, linewidth=.5, aes(geometry=geometry)) +
  labs(
    title = "Correlation of 2010 National SVI Flag Count and 2011 - 2020 NMTC Tax Dollars",
  ) +
  # Set them to biscale
  bi_theme(base_size = 10)

# Create biscale legend
svi_national_county_nmtc_legend <- bi_legend(pal = "GrPink",
                    dim = 3,
                    xlab = "SVI Flag Count",
                    ylab = "NMTC Dollars",
                    size = 8)

# Combine map with legend using cowplot
svi_national_county_nmtc_bivarmap <- ggdraw() +
  draw_plot(svi_national_county_nmtc_map) +
  # Set legend location
  draw_plot(svi_national_county_nmtc_legend, x= -.02,  y = -.05,
 width=.20)


# View map
svi_national_county_nmtc_bivarmap
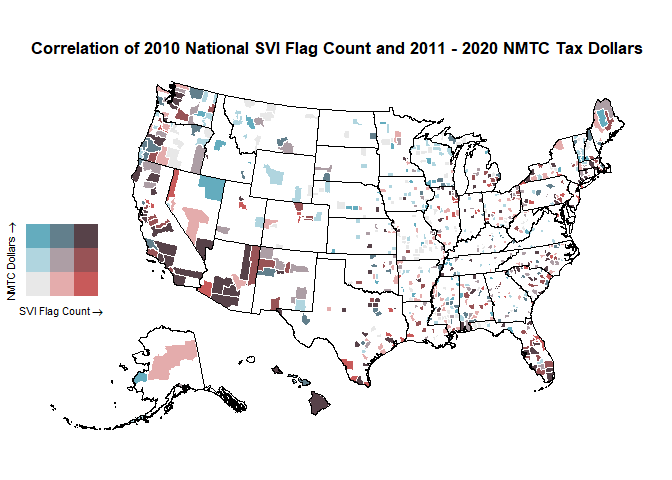
We can see a largest amount of flags in FL, Az, and CA. We can also see a higher amount of spending accros the Atlantic divisions, without as high of flags.
svi_national_county_lihtc_projects <- svi_national_county_lihtc %>% filter(post10_lihtc_project_cnt > 0)
summary(svi_national_county_lihtc_projects$flag_count10)
##    Min. 1st Qu.  Median    Mean 3rd Qu.    Max.
##     0.0    17.0    33.0   104.6   113.5  2457.0
summary(svi_national_county_lihtc_projects$post10_lihtc_project_dollars)
##     Min.  1st Qu.   Median     Mean  3rd Qu.     Max.
##        0   368649   833390  2747385  2597486 50547731
svi_national_county_lihtc_projects <- svi_national_county_lihtc_projects %>% filter(post10_lihtc_project_dollars > 0)
summary(svi_national_county_lihtc_projects$flag_count10)
##    Min. 1st Qu.  Median    Mean 3rd Qu.    Max.
##     0.0    17.0    34.0   109.8   112.5  2457.0
summary(svi_national_county_lihtc_projects$post10_lihtc_project_dollars)
##     Min.  1st Qu.   Median     Mean  3rd Qu.     Max.
##    56314   605483  1275416  3233901  3424308 50547731
# Scatterplot
# y is our independent variable (LIHTC Project Dollars),
# x is our dependent variable (SVI flag count)
ggplot2::ggplot(svi_national_county_lihtc_projects,
                aes(x=flag_count10,
                    y=post10_lihtc_project_dollars)) +
        geom_point() +
        geom_smooth(method="lm") +
        scale_y_continuous(labels = scales::dollar_format())
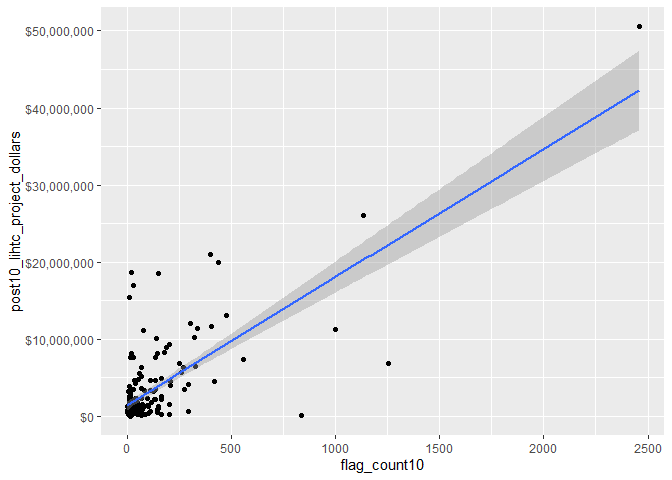
# Pearson's r calculation
cor(svi_national_county_lihtc_projects$flag_count10, svi_national_county_lihtc_projects$post10_lihtc_project_dollars, method = "pearson")
## [1] 0.7368838
Similar to our NMTC, we can see that there is a strong positive correlation between flags and amount of spending. However, we once again see that outliers are potentially swaying our data.
boxplot(svi_national_county_lihtc_projects$flag_count10)
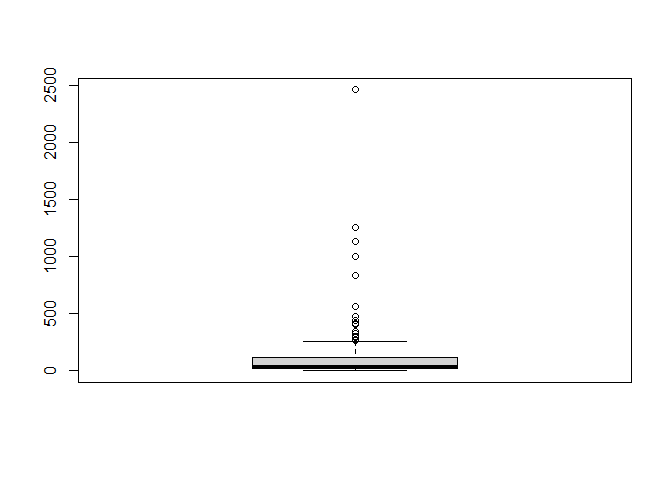
boxplot.stats(svi_national_county_lihtc_projects$flag_count10)$out %>% sort(decreasing = TRUE)
##  [1] 2457 1254 1135 1002  835  560  475  440  418  403  402  340  327  323  303
## [16]  296  293  276  271  263
svi_national_county_lihtc_projects %>% filter(flag_count10 == 2457)
##   State             County         Division post10_lihtc_project_cnt tract_cnt
## 1    CA Los Angeles County Pacific Division                       58       238
##   post10_lihtc_project_dollars post10_lihtc_dollars_formatted fips_county_st
## 1                     50547731                    $50,547,731          06037
##   FIPS_st FIPS_county state_name region_number      region division_number
## 1      06         037 California             4 West Region               9
##   flag_count10  pop10 flag_by_pop10 flag_count_quantile10 flag_pop_quantile10
## 1         2457 988225   0.002486276                     1                 0.6
##   flag_count20  pop20 flag_by_pop20 flag_count_quantile20 flag_pop_quantile20
## 1         2272 991036    0.00229255                     1                 0.6
##              county_name
## 1 Los Angeles County, CA
svi_national_lihtc %>% filter(county == "Los Angeles County") %>% select(GEOID_2010_trt, F_TOTAL_10, post10_lihtc_project_dollars) %>% summary()
##  GEOID_2010_trt       F_TOTAL_10    post10_lihtc_project_dollars
##  Length:238         Min.   : 6.00   Min.   :      0
##  Class :character   1st Qu.:10.00   1st Qu.:      0
##  Mode  :character   Median :10.00   Median :      0
##                     Mean   :10.32   Mean   : 212385
##                     3rd Qu.:11.00   3rd Qu.:      0
##                     Max.   :13.00   Max.   :4945372
svi_national_lihtc_cluster <- svi_national_county_lihtc_projects %>%
                            select(county_name, post10_lihtc_project_dollars,
                                   flag_count10) %>%
                            remove_rownames %>%
                            column_to_rownames(var="county_name")

# Remove nulls, if in dataset
svi_national_lihtc_cluster <- na.omit(svi_national_lihtc_cluster)


# Scale numeric variables
svi_national_lihtc_cluster <- scale(svi_national_lihtc_cluster)


svi_national_lihtc_cluster %>% head(5)
##                      post10_lihtc_project_dollars flag_count10
## Dale County, AL                        -0.4426510   -0.4100636
## Mobile County, AL                      -0.4215575    0.1570056
## Craighead County, AR                   -0.1126573   -0.4100636
## Jefferson County, AR                   -0.4806216   -0.2744601
## Pope County, AR                        -0.4860654   -0.4265004
set.seed(123)
k2_lihtc_nat <- kmeans(svi_national_lihtc_cluster, centers = 2, nstart = 25)
set.seed(123)
k3_lihtc_nat <- kmeans(svi_national_lihtc_cluster, centers = 3, nstart = 25)
set.seed(123)
k4_lihtc_nat <- kmeans(svi_national_lihtc_cluster, centers = 4, nstart = 25)
set.seed(123)
k5_lihtc_nat <- kmeans(svi_national_lihtc_cluster, centers = 5, nstart = 25)
# plots to compare
p_k2_lihtc_nat <- factoextra::fviz_cluster(k2_lihtc_nat, geom = "point", data = svi_national_lihtc_cluster) + ggtitle("k = 2")

p_k3_lihtc_nat <- factoextra::fviz_cluster(k3_lihtc_nat, geom = "point", data = svi_national_lihtc_cluster) + ggtitle("k = 3")

p_k4_lihtc_nat <- factoextra::fviz_cluster(k4_lihtc_nat, geom = "point",  data = svi_national_lihtc_cluster) + ggtitle("k = 4")

p_k5_lihtc_nat <- factoextra::fviz_cluster(k5_lihtc_nat, geom = "point",  data = svi_national_lihtc_cluster) + ggtitle("k = 5")

grid.arrange(p_k2_lihtc_nat, p_k3_lihtc_nat, p_k4_lihtc_nat, p_k5_lihtc_nat, nrow = 2)
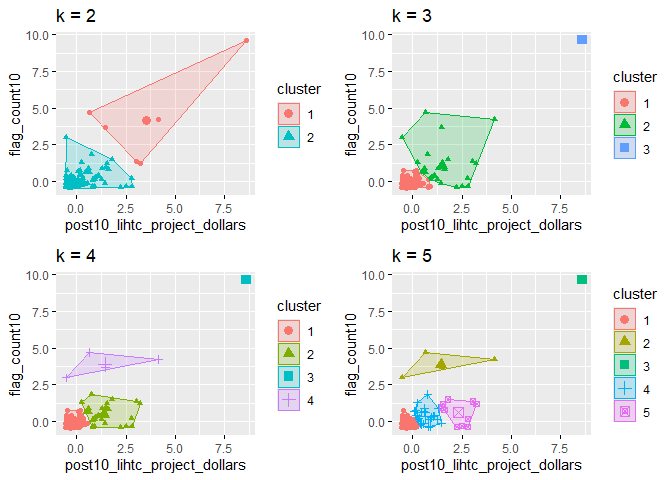
elbow_plot(svi_national_lihtc_cluster)
##  [1]  1  2  3  4  5  6  7  8  9 10 11 12 13 14 15
## [1] 1
## [1] 2
## [1] 3
## [1] 4
## [1] 5
## [1] 6
## [1] 7
## [1] 8
## [1] 9
## [1] 10
## [1] 11
## [1] 12
## [1] 13
## [1] 14
## [1] 15
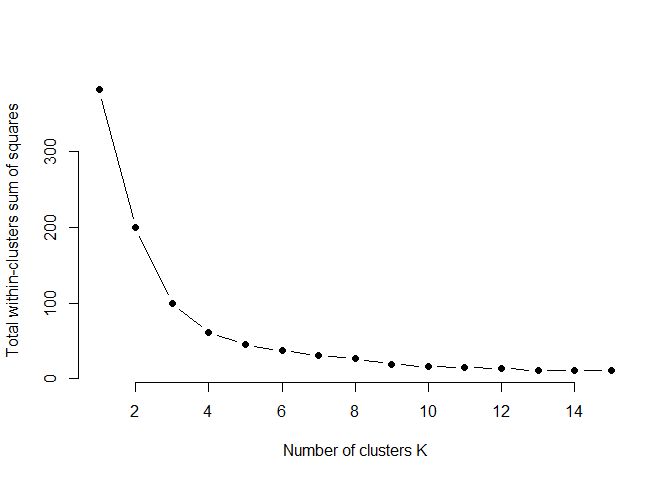
p_k3_lihtc_nat <- factoextra::fviz_cluster(k3_lihtc_nat, geom = "point", data = svi_national_lihtc_cluster) + ggtitle("k = 3")

p_k3_lihtc_nat
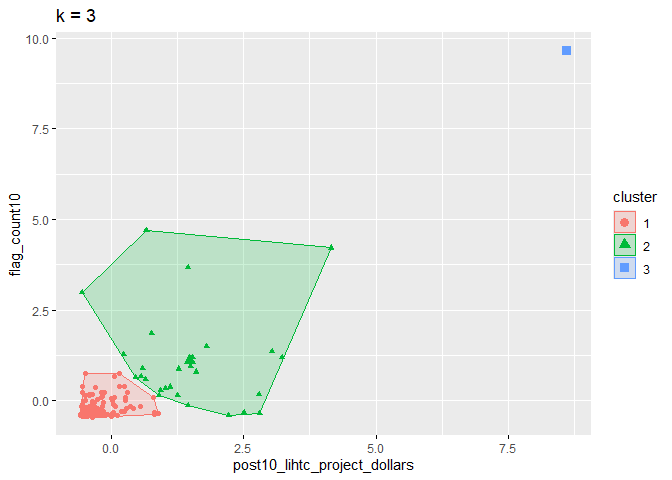
svi_national_lihtc_cluster_label <- as.data.frame(svi_national_lihtc_cluster) %>%
                                  rownames_to_column(var = "county_name") %>%
                                  as_tibble() %>%
                                  mutate(cluster = k3_lihtc_nat$cluster) %>%
                                  select(county_name, cluster)

svi_national_county_lihtc_projects2 <- left_join(svi_national_county_lihtc_projects, svi_national_lihtc_cluster_label, join_by(county_name == county_name))

# View county counts in each cluster
table(svi_national_county_lihtc_projects2$cluster)
##
##   1   2   3
## 164  27   1
It appears once again that three cluster are best to view our data
svi_national_lihtc_cluster_label <- as.data.frame(svi_national_lihtc_cluster) %>%
                                  rownames_to_column(var = "county_name") %>%
                                  as_tibble() %>%
                                  mutate(cluster = k3_lihtc_nat$cluster) %>%
                                  select(county_name, cluster)

svi_national_county_lihtc_projects2 <- left_join(svi_national_county_lihtc_projects, svi_national_lihtc_cluster_label, join_by(county_name == county_name))

# View county counts in each cluster
table(svi_national_county_lihtc_projects2$cluster)
##
##   1   2   3
## 164  27   1
# Cluster 1 Scatterplot
# y is our independent variable (LIHTC Project Dollars),
# x is our dependent variable (SVI flag count)

svi_national_county_lihtc_projects2 %>%
  filter(cluster == 1) %>%
  ggplot2::ggplot(aes(x=flag_count10,
                    y=post10_lihtc_project_dollars)) +
        geom_point() +
        geom_smooth(method="lm") +
        scale_y_continuous(labels = scales::dollar_format())
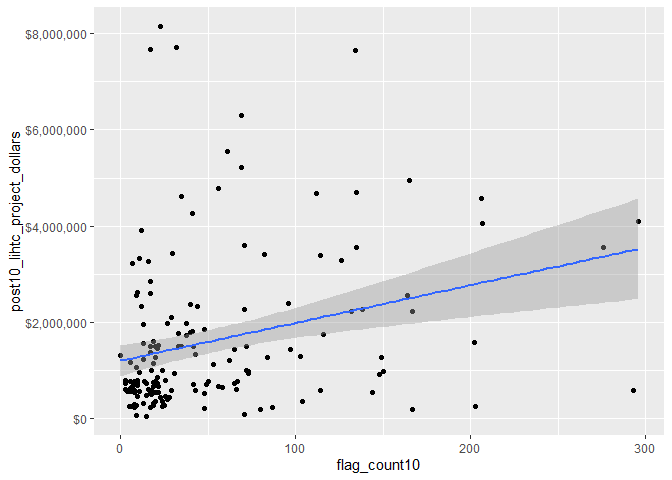
svi_national_county_lihtc_projects2 %>%
  filter(cluster == 1) %>%
  select(flag_count10,post10_lihtc_project_dollars) %>%
  cor(method = "pearson")
##                              flag_count10 post10_lihtc_project_dollars
## flag_count10                    1.0000000                    0.2812405
## post10_lihtc_project_dollars    0.2812405                    1.0000000
svi_national_county_lihtc_projects2 %>%
  filter(cluster == 1) %>%
  select(county_name, flag_count10, post10_lihtc_dollars_formatted) %>%
  arrange(desc(flag_count10)) %>% head(10) %>% kbl() %>% kable_styling() %>% scroll_box(width = "100%")
| county_name | flag_count10 | post10_lihtc_dollars_formatted |
|---|---|---|
| Queens County, NY | 296 | \$4,094,899 |
| Oklahoma County, OK | 293 | \$590,000 |
| Orleans Parish, LA | 276 | \$3,558,074 |
| Sacramento County, CA | 207 | \$4,065,883 |
| Passaic County, NJ | 206 | \$4,564,679 |
| Hartford County, CT | 203 | \$256,961 |
| Alameda County, CA | 202 | \$1,590,984 |
| Erie County, NY | 167 | \$2,220,667 |
| Shelby County, TN | 167 | \$201,735 |
| Monroe County, NY | 165 | \$4,944,903 |
Our first cluster, which is also our largest cluster, does not show a strong correlation between flags and dollars spent.
# Cluster 2 Scatterplot
# y is our independent variable (LIHTC Project Dollars),
# x is our dependent variable (SVI flag count)

svi_national_county_lihtc_projects2 %>%
  filter(cluster == 2) %>%
  ggplot2::ggplot(aes(x=flag_count10,
                    y=post10_lihtc_project_dollars)) +
        geom_point() +
        geom_smooth(method="lm") +
        scale_y_continuous(labels = scales::dollar_format())
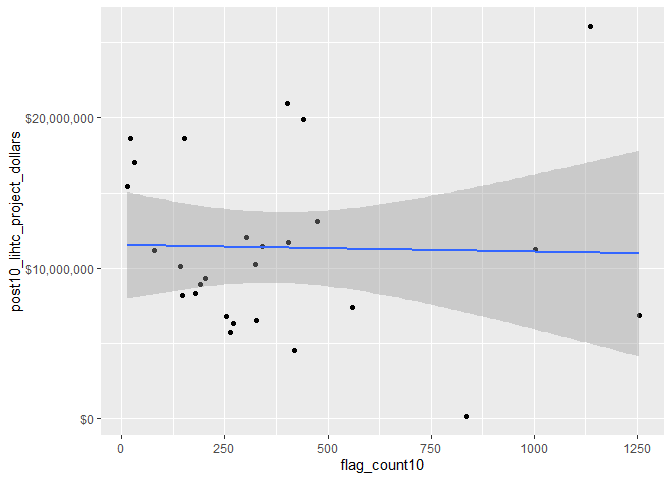
svi_national_county_lihtc_projects2 %>%
  filter(cluster == 2) %>%
  select(flag_count10,post10_lihtc_project_dollars) %>%
  cor(method = "pearson")
##                              flag_count10 post10_lihtc_project_dollars
## flag_count10                   1.00000000                  -0.02464747
## post10_lihtc_project_dollars  -0.02464747                   1.00000000
svi_national_county_lihtc_projects2 %>%
  filter(cluster == 2) %>%
  select(county_name, flag_count10, post10_lihtc_dollars_formatted) %>%
  arrange(desc(flag_count10)) %>% kbl() %>% kable_styling() %>% scroll_box(width = "100%")
| county_name | flag_count10 | post10_lihtc_dollars_formatted |
|---|---|---|
| Cook County, IL | 1254 | \$6,872,376 |
| Kings County, NY | 1135 | \$26,054,976 |
| Wayne County, MI | 1002 | \$11,226,253 |
| Harris County, TX | 835 | \$179,539 |
| Essex County, NJ | 560 | \$7,410,996 |
| Maricopa County, AZ | 475 | \$13,115,292 |
| Bronx County, NY | 440 | \$19,909,800 |
| Cuyahoga County, OH | 418 | \$4,515,742 |
| District of Columbia, DC | 403 | \$11,695,555 |
| San Diego County, CA | 402 | \$20,961,962 |
| Milwaukee County, WI | 340 | \$11,454,416 |
| Baltimore city, MD | 327 | \$6,501,415 |
| Orange County, CA | 323 | \$10,245,926 |
| Miami-Dade County, FL | 303 | \$12,039,478 |
| Riverside County, CA | 271 | \$6,335,483 |
| San Bernardino County, CA | 263 | \$5,757,810 |
| Philadelphia County, PA | 253 | \$6,805,843 |
| New York County, NY | 202 | \$9,337,368 |
| Allegheny County, PA | 191 | \$8,889,633 |
| Hennepin County, MN | 178 | \$8,327,899 |
| Onondaga County, NY | 152 | \$18,599,402 |
| Tulsa County, OK | 146 | \$8,175,983 |
| Hillsborough County, FL | 143 | \$10,116,734 |
| San Francisco County, CA | 79 | \$11,194,380 |
| Delaware County, IN | 31 | \$17,000,000 |
| Vigo County, IN | 22 | \$18,646,385 |
| Mesa County, CO | 13 | \$15,437,500 |
Our second cluster, which as the largest spread, shows a slightly negative correlation.
# Cluster 3 Scatterplot
# y is our independent variable (LIHTC Project Dollars),
# x is our dependent variable (SVI flag count)

svi_national_county_lihtc_projects2 %>%
  filter(cluster == 3) %>%
  ggplot2::ggplot(aes(x=flag_count10,
                    y=post10_lihtc_project_dollars)) +
        geom_point() +
        geom_smooth(method="lm") +
        scale_y_continuous(labels = scales::dollar_format())
svi_national_county_lihtc_projects2 %>%
  filter(cluster == 3) %>%
  select(flag_count10,post10_lihtc_project_dollars) %>%
  cor(method = "pearson")
##                              flag_count10 post10_lihtc_project_dollars
## flag_count10                           NA                           NA
## post10_lihtc_project_dollars           NA                           NA
svi_national_county_lihtc_projects2 %>%
  filter(cluster == 3) %>%
  select(county_name, flag_count10, post10_lihtc_dollars_formatted) %>%
  arrange(desc(flag_count10)) %>% head(10) %>% kbl() %>% kable_styling() %>% scroll_box(width = "100%")
| county_name | flag_count10 | post10_lihtc_dollars_formatted |
|---|---|---|
| Los Angeles County, CA | 2457 | \$50,547,731 |
Unfortionately, our third cluster only has one instance, so we cannot tell if there is a trend or if it is repeatable.
# Join our LIHTC projects data with our shapefile geocoordinates
svi_national_county_lihtc_sf <- left_join(svi_national_county_lihtc_projects, county_sf, join_by("FIPS_st" == "STATEFP", "FIPS_county" == "COUNTYFP"))

svi_national_county_lihtc_sf %>% head(5) %>% kbl() %>% kable_styling() %>% scroll_box(width = "100%")
| State | County | Division | post10_lihtc_project_cnt | tract_cnt | post10_lihtc_project_dollars | post10_lihtc_dollars_formatted | fips_county_st | FIPS_st | FIPS_county | state_name | region_number | region | division_number | flag_count10 | pop10 | flag_by_pop10 | flag_count_quantile10 | flag_pop_quantile10 | flag_count20 | pop20 | flag_by_pop20 | flag_count_quantile20 | flag_pop_quantile20 | county_name | GEO_ID | STATE | COUNTY | NAME | LSAD | CENSUSAREA | geometry |
|---|---|---|---|---|---|---|---|---|---|---|---|---|---|---|---|---|---|---|---|---|---|---|---|---|---|---|---|---|---|---|---|
| AL | Dale County | East South Central Division | 1 | 2 | 801670 | \$801,670 | 01045 | 01 | 045 | Alabama | 3 | South Region | 6 | 10 | 4943 | 0.0020231 | 0.4 | 0.4 | 15 | 4853 | 0.0030909 | 0.6 | 0.8 | Dale County, AL | 0500000US01045 | 01 | 045 | Dale | County | 561.150 | MULTIPOLYGON (((966402.4 -6… |
| AL | Mobile County | East South Central Division | 1 | 18 | 917572 | \$917,572 | 01097 | 01 | 097 | Alabama | 3 | South Region | 6 | 148 | 41977 | 0.0035257 | 1.0 | 0.8 | 126 | 34483 | 0.0036540 | 1.0 | 0.8 | Mobile County, AL | 0500000US01097 | 01 | 097 | Mobile | County | 1229.435 | MULTIPOLYGON (((763284.2 -7… |
| AR | Craighead County | West South Central Division | 6 | 1 | 2614884 | \$2,614,884 | 05031 | 05 | 031 | Arkansas | 3 | South Region | 7 | 10 | 5701 | 0.0017541 | 0.4 | 0.4 | 9 | 6088 | 0.0014783 | 0.4 | 0.2 | Craighead County, AR | 0500000US05031 | 05 | 031 | Craighead | County | 707.206 | MULTIPOLYGON (((509938.5 -1… |
| AR | Jefferson County | West South Central Division | 1 | 5 | 593033 | \$593,033 | 05069 | 05 | 069 | Arkansas | 3 | South Region | 7 | 43 | 14174 | 0.0030337 | 1.0 | 0.8 | 39 | 11370 | 0.0034301 | 0.8 | 0.8 | Jefferson County, AR | 0500000US05069 | 05 | 069 | Jefferson | County | 870.746 | MULTIPOLYGON (((391413.8 -3… |
| AR | Pope County | West South Central Division | 1 | 1 | 563121 | \$563,121 | 05115 | 05 | 115 | Arkansas | 3 | South Region | 7 | 6 | 4220 | 0.0014218 | 0.2 | 0.2 | 9 | 4890 | 0.0018405 | 0.4 | 0.4 | Pope County, AR | 0500000US05115 | 05 | 115 | Pope | County | 812.548 | MULTIPOLYGON (((243262.7 -2… |
# Create classes for bivariate mapping
svi_national_county_lihtc_sf <- bi_class(svi_national_county_lihtc_sf, x = flag_count10, y = post10_lihtc_project_dollars, style = "quantile", dim = 3)

# View data
svi_national_county_lihtc_sf %>% head(5) %>% kbl() %>% kable_styling() %>% scroll_box(width = "100%")
| State | County | Division | post10_lihtc_project_cnt | tract_cnt | post10_lihtc_project_dollars | post10_lihtc_dollars_formatted | fips_county_st | FIPS_st | FIPS_county | state_name | region_number | region | division_number | flag_count10 | pop10 | flag_by_pop10 | flag_count_quantile10 | flag_pop_quantile10 | flag_count20 | pop20 | flag_by_pop20 | flag_count_quantile20 | flag_pop_quantile20 | county_name | GEO_ID | STATE | COUNTY | NAME | LSAD | CENSUSAREA | geometry | bi_class |
|---|---|---|---|---|---|---|---|---|---|---|---|---|---|---|---|---|---|---|---|---|---|---|---|---|---|---|---|---|---|---|---|---|
| AL | Dale County | East South Central Division | 1 | 2 | 801670 | \$801,670 | 01045 | 01 | 045 | Alabama | 3 | South Region | 6 | 10 | 4943 | 0.0020231 | 0.4 | 0.4 | 15 | 4853 | 0.0030909 | 0.6 | 0.8 | Dale County, AL | 0500000US01045 | 01 | 045 | Dale | County | 561.150 | MULTIPOLYGON (((966402.4 -6… | 1-2 |
| AL | Mobile County | East South Central Division | 1 | 18 | 917572 | \$917,572 | 01097 | 01 | 097 | Alabama | 3 | South Region | 6 | 148 | 41977 | 0.0035257 | 1.0 | 0.8 | 126 | 34483 | 0.0036540 | 1.0 | 0.8 | Mobile County, AL | 0500000US01097 | 01 | 097 | Mobile | County | 1229.435 | MULTIPOLYGON (((763284.2 -7… | 3-2 |
| AR | Craighead County | West South Central Division | 6 | 1 | 2614884 | \$2,614,884 | 05031 | 05 | 031 | Arkansas | 3 | South Region | 7 | 10 | 5701 | 0.0017541 | 0.4 | 0.4 | 9 | 6088 | 0.0014783 | 0.4 | 0.2 | Craighead County, AR | 0500000US05031 | 05 | 031 | Craighead | County | 707.206 | MULTIPOLYGON (((509938.5 -1… | 1-3 |
| AR | Jefferson County | West South Central Division | 1 | 5 | 593033 | \$593,033 | 05069 | 05 | 069 | Arkansas | 3 | South Region | 7 | 43 | 14174 | 0.0030337 | 1.0 | 0.8 | 39 | 11370 | 0.0034301 | 0.8 | 0.8 | Jefferson County, AR | 0500000US05069 | 05 | 069 | Jefferson | County | 870.746 | MULTIPOLYGON (((391413.8 -3… | 2-1 |
| AR | Pope County | West South Central Division | 1 | 1 | 563121 | \$563,121 | 05115 | 05 | 115 | Arkansas | 3 | South Region | 7 | 6 | 4220 | 0.0014218 | 0.2 | 0.2 | 9 | 4890 | 0.0018405 | 0.4 | 0.4 | Pope County, AR | 0500000US05115 | 05 | 115 | Pope | County | 812.548 | MULTIPOLYGON (((243262.7 -2… | 1-1 |
# Create map with ggplot
svi_national_county_lihtc_map <- ggplot() +
  # Map county shapefile, fill with bi_class categories
  geom_sf(data = svi_national_county_lihtc_sf, mapping = aes(geometry=geometry, fill = bi_class), color = "white", size = 0.1, show.legend = FALSE) +
  # Set to biscale palette
  bi_scale_fill(pal = "GrPink", dim = 3) +
  # Add state shapefiles for outline
  geom_sf(data=st_sf, color="black", fill=NA, linewidth=.5, aes(geometry=geometry)) +
  labs(
    title = "Correlation of 2010 National SVI Flag Count and 2011 - 2020 LIHTC Tax Dollars",
  ) +
  # Set them to biscale
  bi_theme(base_size = 10)

# Create biscale legend
svi_national_county_lihtc_legend <- bi_legend(pal = "GrPink",
                    dim = 3,
                    xlab = "SVI Flag Count",
                    ylab = "LIHTC Dollars",
                    size = 8)

# Combine map with legend using cowplot
svi_national_county_lihtc_bivarmap <- ggdraw() +
  draw_plot(svi_national_county_lihtc_map) +
  # Set legend location
  draw_plot(svi_national_county_lihtc_legend, x= -.02,  y = -.05,
 width=.20)


# View map
svi_national_county_lihtc_bivarmap
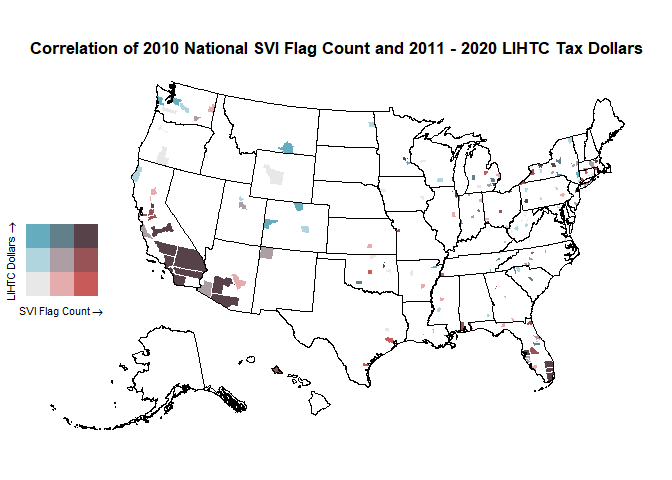
Here we once again see the larges amounts of flags in both Florida and California.
svi_national_county_lihtc_sf %>% filter(State == "CO") %>% select(State, County, flag_count10, post10_lihtc_dollars_formatted) %>% arrange(desc(flag_count10)) %>% head(6)
##   State         County flag_count10 post10_lihtc_dollars_formatted
## 1    CO  Denver County           69                     $5,226,128
## 2    CO El Paso County           18                     $1,011,891
## 3    CO Larimer County           17                     $2,609,648
## 4    CO    Mesa County           13                    $15,437,500
svi_national_county_lihtc_sf %>% filter(State == "CA") %>% select(State, County, flag_count10, post10_lihtc_dollars_formatted) %>% arrange(desc(flag_count10)) %>% head(6)
##   State                County flag_count10 post10_lihtc_dollars_formatted
## 1    CA    Los Angeles County         2457                    $50,547,731
## 2    CA      San Diego County          402                    $20,961,962
## 3    CA         Orange County          323                    $10,245,926
## 4    CA      Riverside County          271                     $6,335,483
## 5    CA San Bernardino County          263                     $5,757,810
## 6    CA     Sacramento County          207                     $4,065,883
Divisional Data Summary
svi_divisional_county_nmtc_projects <- svi_divisional_county_nmtc %>% filter(post10_nmtc_project_cnt > 0)
summary(svi_divisional_county_nmtc_projects$flag_count10)
##    Min. 1st Qu.  Median    Mean 3rd Qu.    Max.
##     2.0    25.0    52.0   156.4   170.2  2301.0
summary(svi_divisional_county_nmtc_projects$post10_nmtc_project_dollars)
##      Min.   1st Qu.    Median      Mean   3rd Qu.      Max.
##      6235   7063450  13963750  29058223  31893750 437737000
Looking into our summary statistics for the South Atlantic division, we can see a large spread in both flags and in money spent. Flags rangs from 2 to 2301, a very large gap. Money spent also ranges from 6235 to over 400,000,000. Interestingly, the average amount of flags is 156.4, which is far below the maximum of 2301. This suggests that which there are outliers pulling the data to 2301, most divisions are actually much smaller. Similarly, the average amount of money is just over 29,000,000, which is significantly different than the maximum of over 400,000,000
# Scatterplot
# y is our independent variable (NMTC Project Dollars),
# x is our dependent variable (SVI flag count)
ggplot2::ggplot(svi_divisional_county_nmtc_projects,
                aes(x=flag_count10,
                    y=post10_nmtc_project_dollars)) +
        geom_point() +
        geom_smooth(method="lm") +
        scale_y_continuous(labels = scales::dollar_format())
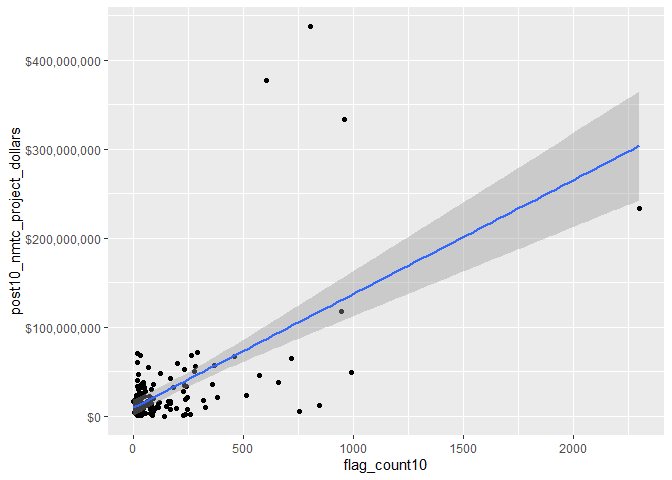

# Pearson's r calculation
cor(svi_divisional_county_nmtc_projects$flag_count10, svi_divisional_county_nmtc_projects$post10_nmtc_project_dollars, method = "pearson")
## [1] 0.5999762
If we view the data in a scatter plot, we can more clearly see how the outliers are pulling our data. While there are instances that reach a spending of over $100,000,000, there are only 5 in total. In fact, there is only one instance that reaches over the $400,000,000 threshhold.
This stark difference is examined by looking at our Pearson’s R Calculation. While still showing that flag count has a strong impact on money spent, the pattern is much less strong than how it initially looks. This is because the majority of our data is in the bottom left corner, with less than $100,000,000 spent, and less than 500 flags.
boxplot(svi_divisional_county_nmtc_projects$flag_count10)
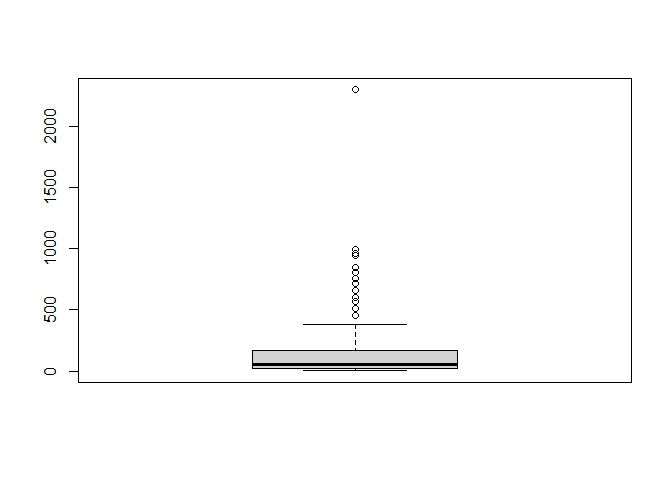
boxplot.stats(svi_divisional_county_nmtc_projects$flag_count10)$out %>% sort(decreasing = TRUE)
## [1] 2301 993 962 946 846 805 756 717 660 605 572 514 459
svi_divisional_county_nmtc_projects %>%
  select(county_name, flag_count10, post10_nmtc_dollars_formatted) %>%
  arrange(desc(flag_count10)) %>%
  head(7) %>% kbl() %>% kable_styling() %>% scroll_box(width = "100%")
| county_name | flag_count10 | post10_nmtc_dollars_formatted |
|---|---|---|
| Miami-Dade County, FL | 2301 | \$233,661,603 |
| Broward County, FL | 993 | \$48,975,143 |
| Baltimore city, MD | 962 | \$333,109,232 |
| Hillsborough County, FL | 946 | \$117,152,400 |
| Palm Beach County, FL | 846 | \$12,202,000 |
| Fulton County, GA | 805 | \$437,737,000 |
| Prince George’s County, MD | 756 | \$4,900,000 |
If we sort by our largest amount of flags, there is a very large difference between number 7 and number 1. However, if just look at the flags between 2 and 7, they are much more comparable. Yet, the money spent does not seem to increase in any particular trend. In fact, the most amount of money spent is number 6, which is almost double that of number 1, even though number 1 has almost 3 times the amount of flags as number 6.
svi_divisional_nmtc_cluster <- svi_divisional_county_nmtc_projects %>%
                            select(county_name, post10_nmtc_project_dollars,
                                   flag_count10) %>%
                            remove_rownames %>%
                            column_to_rownames(var="county_name")

# Remove nulls, if in dataset
svi_divisional_nmtc_cluster <- na.omit(svi_divisional_nmtc_cluster)


# Scale numeric variables
svi_divisional_nmtc_cluster <- scale(svi_divisional_nmtc_cluster)


svi_divisional_nmtc_cluster %>% head(5)
##                          post10_nmtc_project_dollars flag_count10
## District of Columbia, DC                  5.95900625   1.63887937
## New Castle County, DE                    -0.01961731   0.26881224
## Alachua County, FL                       -0.21737824   0.01306638
## Brevard County, FL                       -0.37714793   0.04594799
## Broward County, FL                        0.34095362   3.05644216
K-Means Clustering
set.seed(123)
k2_nmtc_div <- kmeans(svi_divisional_nmtc_cluster, centers = 2, nstart = 25)
set.seed(123)
k3_nmtc_div <- kmeans(svi_divisional_nmtc_cluster, centers = 3, nstart = 25)
set.seed(123)
k4_nmtc_div <- kmeans(svi_divisional_nmtc_cluster, centers = 4, nstart = 25)
set.seed(123)
k5_nmtc_div <- kmeans(svi_divisional_nmtc_cluster, centers = 5, nstart = 25)
# plots to compare
p_k2_nmtc_div <- factoextra::fviz_cluster(k2_nmtc_div, geom = "point", data = svi_divisional_nmtc_cluster) + ggtitle("k = 2")

p_k3_nmtc_div <- factoextra::fviz_cluster(k3_nmtc_div, geom = "point", data = svi_divisional_nmtc_cluster) + ggtitle("k = 3")

p_k4_nmtc_div <- factoextra::fviz_cluster(k4_nmtc_div, geom = "point",  data = svi_divisional_nmtc_cluster) + ggtitle("k = 4")

p_k5_nmtc_div <- factoextra::fviz_cluster(k5_nmtc_div, geom = "point",  data = svi_divisional_nmtc_cluster) + ggtitle("k = 5")

grid.arrange(p_k2_nmtc_div, p_k3_nmtc_div, p_k4_nmtc_div, p_k5_nmtc_div, nrow = 2)
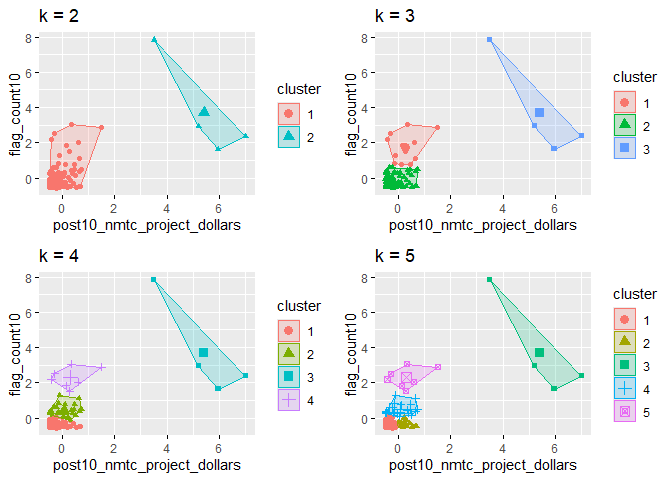
elbow_plot(svi_divisional_nmtc_cluster)
##  [1]  1  2  3  4  5  6  7  8  9 10 11 12 13 14 15
## [1] 1
## [1] 2
## [1] 3
## [1] 4
## [1] 5
## [1] 6
## [1] 7
## [1] 8
## [1] 9
## [1] 10
## [1] 11
## [1] 12
## [1] 13
## [1] 14
## [1] 15
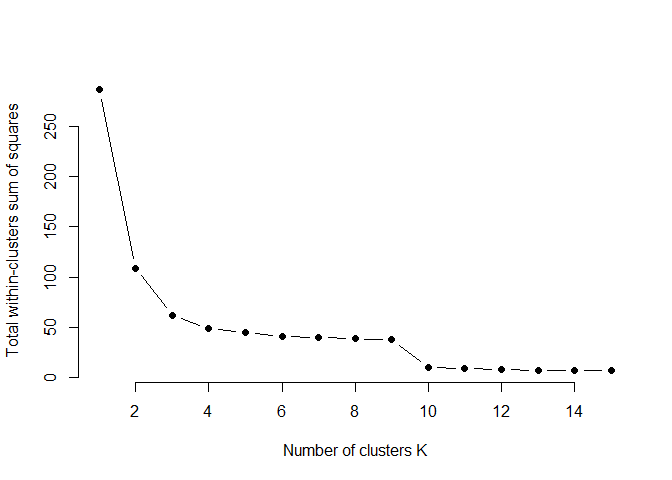
p_k3_nmtc_div <- factoextra::fviz_cluster(k3_nmtc_div, geom = "point", data = svi_divisional_nmtc_cluster) + ggtitle("k = 3")

p_k3_nmtc_div
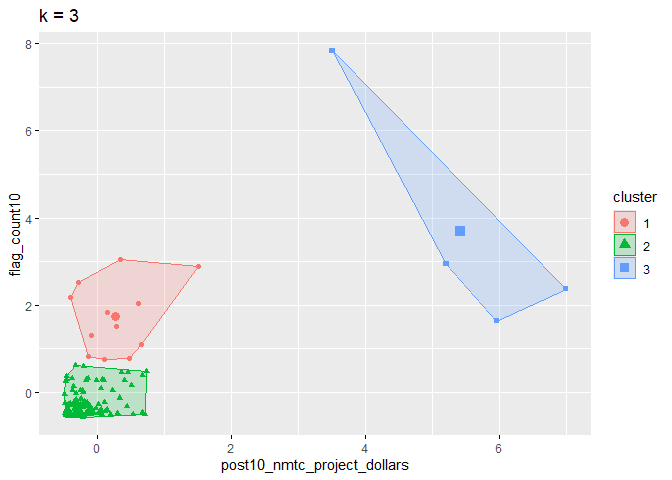
Since there is such a large difference in both flag counts and project dollars spent, we can divide our groups into clusters. Our group is best divided into three different clusters, which may show different flag or money trends.
svi_divisional_nmtc_cluster_label <- as.data.frame(svi_divisional_nmtc_cluster) %>%
                                  rownames_to_column(var = "county_name") %>%
                                  as_tibble() %>%
                                  mutate(cluster = k3_nmtc_div$cluster) %>%
                                  select(county_name, cluster)

svi_divisional_county_nmtc_projects2 <- left_join(svi_divisional_county_nmtc_projects, svi_divisional_nmtc_cluster_label, join_by(county_name == county_name))

# View county counts in each cluster
table(svi_divisional_county_nmtc_projects2$cluster)
##
##   1   2   3
##  12 128   4
# Cluster 1 Scatterplot
# y is our independent variable (NMTC Project Dollars),
# x is our dependent variable (SVI flag count)

svi_divisional_county_nmtc_projects2 %>%
  filter(cluster == 1) %>%
  ggplot2::ggplot(aes(x=flag_count10,
                    y=post10_nmtc_project_dollars)) +
        geom_point() +
        geom_smooth(method="lm") +
        scale_y_continuous(labels = scales::dollar_format())
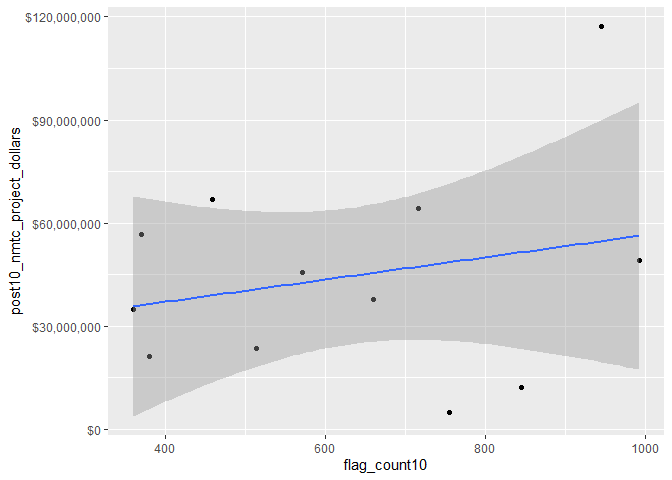
svi_divisional_county_nmtc_projects2 %>%
  filter(cluster == 1) %>%
  select(flag_count10,post10_nmtc_project_dollars) %>%
  cor(method = "pearson")
##                             flag_count10 post10_nmtc_project_dollars
## flag_count10                   1.0000000                   0.2395816
## post10_nmtc_project_dollars    0.2395816                   1.0000000
svi_divisional_county_nmtc_projects2 %>%
  filter(cluster == 1) %>%
  select(county_name, flag_count10, post10_nmtc_dollars_formatted) %>% kbl() %>% kable_styling() %>% scroll_box(width = "100%")
| county_name | flag_count10 | post10_nmtc_dollars_formatted |
|---|---|---|
| Broward County, FL | 993 | \$48,975,143 |
| Duval County, FL | 459 | \$66,878,307 |
| Hillsborough County, FL | 946 | \$117,152,400 |
| Lee County, FL | 361 | \$34,965,000 |
| Orange County, FL | 717 | \$64,320,444 |
| Palm Beach County, FL | 846 | \$12,202,000 |
| Pinellas County, FL | 381 | \$21,235,000 |
| Polk County, FL | 514 | \$23,450,000 |
| DeKalb County, GA | 572 | \$45,575,000 |
| Prince George’s County, MD | 756 | \$4,900,000 |
| Guilford County, NC | 370 | \$56,800,000 |
| Mecklenburg County, NC | 660 | \$37,629,278 |
If we look at our cluster 1, we can see that they do not have a strong coorelation between money spent and flags.
# Cluster 2 Scatterplot
# y is our independent variable (NMTC Project Dollars),
# x is our dependent variable (SVI flag count)

svi_divisional_county_nmtc_projects2 %>%
  filter(cluster == 2) %>%
  ggplot2::ggplot(aes(x=flag_count10,
                    y=post10_nmtc_project_dollars)) +
        geom_point() +
        geom_smooth(method="lm") +
        scale_y_continuous(labels = scales::dollar_format())
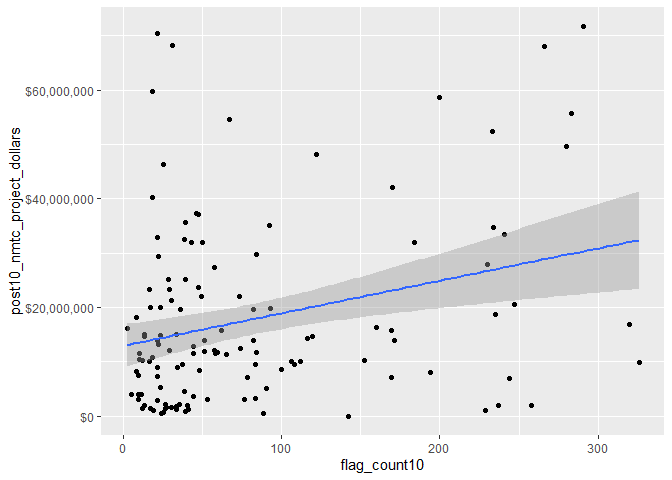
svi_divisional_county_nmtc_projects2 %>%
  filter(cluster == 2) %>%
  select(flag_count10,post10_nmtc_project_dollars) %>%
  cor(method = "pearson")
##                             flag_count10 post10_nmtc_project_dollars
## flag_count10                    1.000000                    0.289368
## post10_nmtc_project_dollars     0.289368                    1.000000
svi_divisional_county_nmtc_projects2 %>%
  filter(cluster == 2) %>%
  select(county_name, flag_count10, post10_nmtc_dollars_formatted) %>% kbl() %>% kable_styling() %>% scroll_box(width = "100%")
| county_name | flag_count10 | post10_nmtc_dollars_formatted |
|---|---|---|
| New Castle County, DE | 230 | \$27,912,271 |
| Alachua County, FL | 160 | \$16,360,000 |
| Brevard County, FL | 169 | \$7,027,000 |
| Clay County, FL | 34 | \$8,941,080 |
| Collier County, FL | 169 | \$15,775,000 |
| Escambia County, FL | 194 | \$8,071,834 |
| Glades County, FL | 16 | \$10,000,000 |
| Hendry County, FL | 37 | \$9,500,000 |
| Highlands County, FL | 106 | \$9,997,500 |
| Holmes County, FL | 17 | \$1,400,000 |
| Lake County, FL | 116 | \$14,340,000 |
| Leon County, FL | 184 | \$31,875,000 |
| Manatee County, FL | 171 | \$13,927,500 |
| Okaloosa County, FL | 19 | \$1,000,000 |
| Pasco County, FL | 326 | \$9,800,000 |
| Santa Rosa County, FL | 21 | \$2,884,750 |
| Seminole County, FL | 88 | \$500,000 |
| Taylor County, FL | 21 | \$32,880,000 |
| Volusia County, FL | 229 | \$945,000 |
| Washington County, FL | 21 | \$9,000,000 |
| Baldwin County, GA | 40 | \$2,000,000 |
| Bibb County, GA | 237 | \$2,000,000 |
| Bulloch County, GA | 47 | \$23,635,000 |
| Carroll County, GA | 59 | \$11,700,000 |
| Chatham County, GA | 235 | \$18,663,750 |
| Clarke County, GA | 122 | \$48,125,000 |
| Clayton County, GA | 283 | \$55,708,000 |
| Coffee County, GA | 46 | \$37,260,000 |
| Colquitt County, GA | 58 | \$11,682,000 |
| Decatur County, GA | 31 | \$68,230,000 |
| Echols County, GA | 17 | \$20,000,000 |
| Emanuel County, GA | 30 | \$1,660,000 |
| Franklin County, GA | 18 | \$59,786,701 |
| Glynn County, GA | 51 | \$13,823,750 |
| Gordon County, GA | 21 | \$70,484,594 |
| Gwinnett County, GA | 320 | \$16,890,000 |
| Irwin County, GA | 12 | \$1,391,250 |
| Jeff Davis County, GA | 13 | \$14,613,500 |
| Muscogee County, GA | 244 | \$6,825,000 |
| Peach County, GA | 22 | \$29,310,000 |
| Rabun County, GA | 21 | \$7,350,000 |
| Richmond County, GA | 234 | \$34,750,000 |
| Screven County, GA | 23 | \$14,920,000 |
| Spalding County, GA | 48 | \$8,320,000 |
| Telfair County, GA | 21 | \$14,000,000 |
| Tift County, GA | 43 | \$31,950,000 |
| Troup County, GA | 58 | \$11,520,000 |
| Upson County, GA | 18 | \$40,210,000 |
| Wilkinson County, GA | 8 | \$18,100,000 |
| Talbot County, MD | 9 | \$7,550,000 |
| Washington County, MD | 78 | \$7,075,600 |
| Anson County, NC | 33 | \$15,000,000 |
| Beaufort County, NC | 25 | \$582,500 |
| Cabarrus County, NC | 83 | \$9,500,000 |
| Chatham County, NC | 26 | \$1,381,291 |
| Cleveland County, NC | 44 | \$11,600,000 |
| Columbus County, NC | 53 | \$3,000,000 |
| Duplin County, NC | 74 | \$12,460,000 |
| Durham County, NC | 200 | \$58,719,117 |
| Halifax County, NC | 73 | \$22,072,000 |
| Harnett County, NC | 84 | \$29,800,000 |
| Hertford County, NC | 26 | \$2,060,000 |
| Johnston County, NC | 83 | \$3,249,239 |
| Jones County, NC | 13 | \$15,100,000 |
| Lenoir County, NC | 65 | \$11,270,000 |
| Mitchell County, NC | 12 | \$10,185,000 |
| Montgomery County, NC | 38 | \$32,576,600 |
| New Hanover County, NC | 93 | \$19,886,415 |
| Northampton County, NC | 30 | \$21,264,000 |
| Robeson County, NC | 233 | \$52,367,992 |
| Rutherford County, NC | 41 | \$1,240,101 |
| Sampson County, NC | 57 | \$12,000,000 |
| Vance County, NC | 44 | \$3,638,400 |
| Wake County, NC | 280 | \$49,684,621 |
| Warren County, NC | 33 | \$1,750,000 |
| Wayne County, NC | 100 | \$8,650,000 |
| Wilkes County, NC | 62 | \$15,757,000 |
| Wilson County, NC | 76 | \$3,000,000 |
| Allendale County, SC | 25 | \$46,260,000 |
| Charleston County, SC | 241 | \$33,400,000 |
| Cherokee County, SC | 49 | \$22,069,493 |
| Colleton County, SC | 44 | \$12,870,000 |
| Darlington County, SC | 47 | \$37,026,000 |
| Fairfield County, SC | 29 | \$12,000,000 |
| Florence County, SC | 119 | \$14,700,000 |
| Georgetown County, SC | 57 | \$27,403,451 |
| Greenville County, SC | 266 | \$68,000,000 |
| Horry County, SC | 142 | \$6,235 |
| Jasper County, SC | 23 | \$5,280,000 |
| Marlboro County, SC | 50 | \$31,950,000 |
| Newberry County, SC | 28 | \$25,200,000 |
| Oconee County, SC | 29 | \$23,220,000 |
| Orangeburg County, SC | 112 | \$10,051,000 |
| Pickens County, SC | 51 | \$11,800,000 |
| Richland County, SC | 247 | \$20,500,000 |
| Spartanburg County, SC | 170 | \$42,080,000 |
| Sumter County, SC | 92 | \$35,060,000 |
| Williamsburg County, SC | 82 | \$14,000,000 |
| York County, SC | 90 | \$5,000,000 |
| Alleghany County, VA | 10 | \$10,478,000 |
| Bath County, VA | 2 | \$16,155,350 |
| Bristol city, VA | 23 | \$19,982,000 |
| Brunswick County, VA | 22 | \$13,095,000 |
| Buchanan County, VA | 39 | \$35,640,000 |
| Charlottesville city, VA | 35 | \$2,116,510 |
| Culpeper County, VA | 10 | \$11,504,473 |
| Henry County, VA | 67 | \$54,630,000 |
| Nelson County, VA | 8 | \$8,191,650 |
| Newport News city, VA | 152 | \$10,249,514 |
| Norfolk city, VA | 258 | \$2,000,000 |
| Patrick County, VA | 18 | \$10,738,175 |
| Petersburg city, VA | 82 | \$19,633,250 |
| Portsmouth city, VA | 108 | \$9,500,000 |
| Richmond city, VA | 291 | \$71,688,438 |
| Smyth County, VA | 39 | \$25,088,000 |
| Berkeley County, WV | 13 | \$2,000,000 |
| Braxton County, WV | 11 | \$4,000,000 |
| Fayette County, WV | 38 | \$4,600,000 |
| Greenbrier County, WV | 16 | \$23,386,235 |
| Harrison County, WV | 36 | \$19,700,000 |
| Kanawha County, WV | 84 | \$11,700,000 |
| Marion County, WV | 24 | \$500,000 |
| Monongalia County, WV | 33 | \$1,250,000 |
| Nicholas County, WV | 9 | \$4,000,000 |
| Ohio County, WV | 27 | \$1,550,000 |
| Upshur County, WV | 9 | \$3,120,000 |
| Wetzel County, WV | 5 | \$4,000,000 |
| Wood County, WV | 39 | \$800,000 |
Looking at our second cluster, which contains the majority of our instances, we can see that there is still no strong coorelation.
# Cluster 2 Scatterplot
# y is our independent variable (NMTC Project Dollars),
# x is our dependent variable (SVI flag count)

svi_divisional_county_nmtc_projects2 %>%
  filter(cluster == 3) %>%
  ggplot2::ggplot(aes(x=flag_count10,
                    y=post10_nmtc_project_dollars)) +
        geom_point() +
        geom_smooth(method="lm") +
        scale_y_continuous(labels = scales::dollar_format())
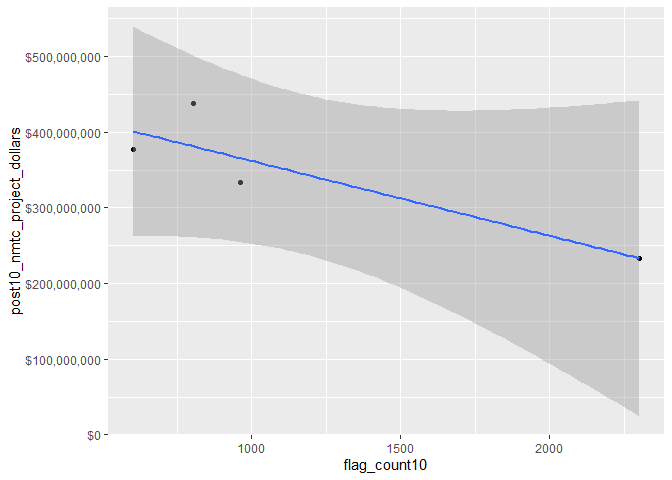
svi_divisional_county_nmtc_projects2 %>%
  filter(cluster == 3) %>%
  select(flag_count10,post10_nmtc_project_dollars) %>%
  cor(method = "pearson")
##                             flag_count10 post10_nmtc_project_dollars
## flag_count10                   1.0000000                  -0.8845317
## post10_nmtc_project_dollars   -0.8845317                   1.0000000
svi_divisional_county_nmtc_projects2 %>%
  filter(cluster == 3) %>%
  select(county_name, flag_count10, post10_nmtc_dollars_formatted) %>% kbl() %>% kable_styling() %>% scroll_box(width = "100%")
| county_name | flag_count10 | post10_nmtc_dollars_formatted |
|---|---|---|
| District of Columbia, DC | 605 | \$377,155,570 |
| Miami-Dade County, FL | 2301 | \$233,661,603 |
| Fulton County, GA | 805 | \$437,737,000 |
| Baltimore city, MD | 962 | \$333,109,232 |
Finally, when we look at our third cluster, which contains our most extreme outliers, we can see that there is in fact a negative coorelation.
divisional_county_sf <- svi_county_map2010 %>% select(COUNTYFP, STATEFP, geometry)

divisional_county_sf %>% head(5)
## Simple feature collection with 5 features and 2 fields
## Geometry type: MULTIPOLYGON
## Dimension:     XY
## Bounding box:  xmin: -85.38976 ymin: 30.19998 xmax: -75.04894 ymax: 39.83901
## Geodetic CRS:  NAD83
##   COUNTYFP STATEFP                       geometry
## 1      001      10 MULTIPOLYGON (((-75.7601 39...
## 2      003      10 MULTIPOLYGON (((-75.5655 39...
## 3      005      10 MULTIPOLYGON (((-75.69878 3...
## 4      001      11 MULTIPOLYGON (((-76.95772 3...
## 5      013      12 MULTIPOLYGON (((-85.02994 3...
Bivariate Mapping
# Join our NMTC projects data with our shapefile geocoordinates
svi_divisional_county_nmtc_sf <- left_join(svi_divisional_county_nmtc_projects, divisional_county_sf, join_by("FIPS_st" == "STATEFP", "FIPS_county" == "COUNTYFP"))

svi_divisional_county_nmtc_sf %>% head(5) %>% kbl() %>% kable_styling() %>% scroll_box(width = "100%")
| State | County | Division | post10_nmtc_project_cnt | tract_cnt | post10_nmtc_project_dollars | post10_nmtc_dollars_formatted | fips_county_st | FIPS_st | FIPS_county | state_name | region_number | region | division_number | flag_count10 | pop10 | flag_by_pop10 | flag_count_quantile10 | flag_pop_quantile10 | flag_count20 | pop20 | flag_by_pop20 | flag_count_quantile20 | flag_pop_quantile20 | county_name | geometry |
|---|---|---|---|---|---|---|---|---|---|---|---|---|---|---|---|---|---|---|---|---|---|---|---|---|---|
| DC | District of Columbia | South Atlantic Division | 22 | 78 | 377155570 | \$377,155,570 | 11001 | 11 | 001 | District of Columbia | 3 | South Region | 5 | 605 | 234370 | 0.0025814 | 1 | 1.0 | 576 | 290905 | 0.0019800 | 1 | 1.0 | District of Columbia, DC | MULTIPOLYGON (((-76.95772 3… |
| DE | New Castle County | South Atlantic Division | 2 | 44 | 27912271 | \$27,912,271 | 10003 | 10 | 003 | Delaware | 3 | South Region | 5 | 230 | 157982 | 0.0014559 | 1 | 0.8 | 215 | 157528 | 0.0013648 | 1 | 0.8 | New Castle County, DE | MULTIPOLYGON (((-75.5655 39… |
| FL | Alachua County | South Atlantic Division | 2 | 28 | 16360000 | \$16,360,000 | 12001 | 12 | 001 | Florida | 3 | South Region | 5 | 160 | 107400 | 0.0014898 | 1 | 0.8 | 156 | 115817 | 0.0013470 | 1 | 0.8 | Alachua County, FL | MULTIPOLYGON (((-82.24401 2… |
| FL | Brevard County | South Atlantic Division | 1 | 37 | 7027000 | \$7,027,000 | 12009 | 12 | 009 | Florida | 3 | South Region | 5 | 169 | 171842 | 0.0009835 | 1 | 0.4 | 166 | 185164 | 0.0008965 | 1 | 0.4 | Brevard County, FL | MULTIPOLYGON (((-80.57159 2… |
| FL | Broward County | South Atlantic Division | 7 | 119 | 48975143 | \$48,975,143 | 12011 | 12 | 011 | Florida | 3 | South Region | 5 | 993 | 571520 | 0.0017375 | 1 | 1.0 | 1027 | 648697 | 0.0015832 | 1 | 0.8 | Broward County, FL | MULTIPOLYGON (((-80.08484 2… |
# Create classes for bivariate mapping
svi_divisional_county_nmtc_sf <- bi_class(svi_divisional_county_nmtc_sf, x = flag_count10, y = post10_nmtc_project_dollars, style = "quantile", dim = 3)

# View data
svi_divisional_county_nmtc_sf %>% head(5) %>% kbl() %>% kable_styling() %>% scroll_box(width = "100%")
| State | County | Division | post10_nmtc_project_cnt | tract_cnt | post10_nmtc_project_dollars | post10_nmtc_dollars_formatted | fips_county_st | FIPS_st | FIPS_county | state_name | region_number | region | division_number | flag_count10 | pop10 | flag_by_pop10 | flag_count_quantile10 | flag_pop_quantile10 | flag_count20 | pop20 | flag_by_pop20 | flag_count_quantile20 | flag_pop_quantile20 | county_name | geometry | bi_class |
|---|---|---|---|---|---|---|---|---|---|---|---|---|---|---|---|---|---|---|---|---|---|---|---|---|---|---|
| DC | District of Columbia | South Atlantic Division | 22 | 78 | 377155570 | \$377,155,570 | 11001 | 11 | 001 | District of Columbia | 3 | South Region | 5 | 605 | 234370 | 0.0025814 | 1 | 1.0 | 576 | 290905 | 0.0019800 | 1 | 1.0 | District of Columbia, DC | MULTIPOLYGON (((-76.95772 3… | 3-3 |
| DE | New Castle County | South Atlantic Division | 2 | 44 | 27912271 | \$27,912,271 | 10003 | 10 | 003 | Delaware | 3 | South Region | 5 | 230 | 157982 | 0.0014559 | 1 | 0.8 | 215 | 157528 | 0.0013648 | 1 | 0.8 | New Castle County, DE | MULTIPOLYGON (((-75.5655 39… | 3-3 |
| FL | Alachua County | South Atlantic Division | 2 | 28 | 16360000 | \$16,360,000 | 12001 | 12 | 001 | Florida | 3 | South Region | 5 | 160 | 107400 | 0.0014898 | 1 | 0.8 | 156 | 115817 | 0.0013470 | 1 | 0.8 | Alachua County, FL | MULTIPOLYGON (((-82.24401 2… | 3-2 |
| FL | Brevard County | South Atlantic Division | 1 | 37 | 7027000 | \$7,027,000 | 12009 | 12 | 009 | Florida | 3 | South Region | 5 | 169 | 171842 | 0.0009835 | 1 | 0.4 | 166 | 185164 | 0.0008965 | 1 | 0.4 | Brevard County, FL | MULTIPOLYGON (((-80.57159 2… | 3-1 |
| FL | Broward County | South Atlantic Division | 7 | 119 | 48975143 | \$48,975,143 | 12011 | 12 | 011 | Florida | 3 | South Region | 5 | 993 | 571520 | 0.0017375 | 1 | 1.0 | 1027 | 648697 | 0.0015832 | 1 | 0.8 | Broward County, FL | MULTIPOLYGON (((-80.08484 2… | 3-3 |
# Create map with ggplot
svi_divisional_county_nmtc_map <- ggplot() +
  # Map county shapefile, fill with bi_class categories
  geom_sf(data = svi_divisional_county_nmtc_sf, mapping = aes(geometry=geometry, fill = bi_class), color = "white", size = 0.1, show.legend = FALSE) +
  # Set to biscale palette
  bi_scale_fill(pal = "GrPink", dim = 3) +
  # Add state shapefiles for outline
  geom_sf(data=divisional_st_sf, color="black", fill=NA, linewidth=.5, aes(geometry=geometry)) +
  labs(
    title = paste0("Correlation of 2010 ", census_division, " SVI Flag Count \n and 2011 - 2020 NMTC Tax Dollars"),
  ) +
  # Set them to biscale
  bi_theme(base_size = 10)

# Create biscale legend
svi_divisional_county_nmtc_legend <- bi_legend(pal = "GrPink",
                    dim = 3,
                    xlab = "SVI Flag Count",
                    ylab = "NMTC Dollars",
                    size = 8)

# Combine map with legend using cowplot
svi_divisional_county_nmtc_bivarmap <- ggdraw() +
  draw_plot(svi_divisional_county_nmtc_map) +
  # Set legend location
  draw_plot(svi_divisional_county_nmtc_legend, x= -.02,  y = -.05,
 width=.20)


# View map
svi_divisional_county_nmtc_bivarmap
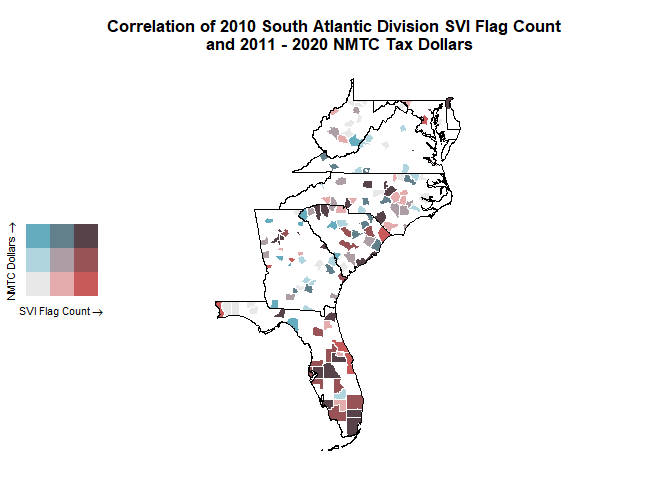
Here we can see the distribution of our counties with NMTC projects based on correlation between 2010 SVI Flag Count and NMTC dollars for the South Atlantic Division.
We can see that the majority of our high flag counts are in Florida, with some moderate flag counts and higher NMTC spending between Georgia and North Carolina.
svi_divisional_county_nmtc_sf %>% filter(State %in% c("FL", "GE", "NC")) %>% select(State, County, flag_count10, post10_nmtc_dollars_formatted) %>% arrange(desc(flag_count10)) %>% head(6) %>% kbl() %>% kable_styling() %>% scroll_box(width = "100%")
| State | County | flag_count10 | post10_nmtc_dollars_formatted |
|---|---|---|---|
| FL | Miami-Dade County | 2301 | \$233,661,603 |
| FL | Broward County | 993 | \$48,975,143 |
| FL | Hillsborough County | 946 | \$117,152,400 |
| FL | Palm Beach County | 846 | \$12,202,000 |
| FL | Orange County | 717 | \$64,320,444 |
| NC | Mecklenburg County | 660 | \$37,629,278 |
svi_divisional_county_nmtc_sf %>% filter(State == "FL") %>%
  arrange(desc(post10_nmtc_project_dollars), flag_count10) %>% select(State, County, flag_count10, post10_nmtc_dollars_formatted) %>% head(10) %>% kbl() %>% kable_styling() %>% scroll_box(width = "100%")
| State | County | flag_count10 | post10_nmtc_dollars_formatted |
|---|---|---|---|
| FL | Miami-Dade County | 2301 | \$233,661,603 |
| FL | Hillsborough County | 946 | \$117,152,400 |
| FL | Duval County | 459 | \$66,878,307 |
| FL | Orange County | 717 | \$64,320,444 |
| FL | Broward County | 993 | \$48,975,143 |
| FL | Lee County | 361 | \$34,965,000 |
| FL | Taylor County | 21 | \$32,880,000 |
| FL | Leon County | 184 | \$31,875,000 |
| FL | Polk County | 514 | \$23,450,000 |
| FL | Pinellas County | 381 | \$21,235,000 |
Here we can see the largest amounts of dollars spent in Florida, as well as how they comare to the amount of flags.
LIHTC
svi_divisional_county_lihtc_projects <- svi_divisional_county_lihtc %>% filter(post10_lihtc_project_cnt > 0)
summary(svi_divisional_county_lihtc_projects$flag_count10)
##    Min. 1st Qu.  Median    Mean 3rd Qu.    Max.
##    3.00   16.50   25.00   56.33   62.00  407.00
svi_divisional_county_lihtc_projects <- svi_divisional_county_lihtc_projects %>% filter(post10_lihtc_project_dollars > 0)
summary(svi_divisional_county_lihtc_projects$flag_count10)
##    Min. 1st Qu.  Median    Mean 3rd Qu.    Max.
##    3.00   16.25   27.00   59.10   62.50  407.00
summary(svi_divisional_county_lihtc_projects$post10_lihtc_project_dollars)
##     Min.  1st Qu.   Median     Mean  3rd Qu.     Max.
##    63397   612954   942126  2038582  1543086 12039478
Similar to our NMTC group, we can see that our LIHTC group has a large range of both flags and dollars spent. Our minimum is now 3, with our maximum amount of flags at 407. Our minimum money spent is now $63,397, with our maximum being over $12,000,000.
Also similarly to our last group, we can see that our means are much smaller than our maximums, suggesting that large outliers are once again impacting our data.
# Scatterplot
# y is our independent variable (LIHTC Project Dollars),
# x is our dependent variable (SVI flag count)
ggplot2::ggplot(svi_divisional_county_lihtc_projects,
                aes(x=flag_count10,
                    y=post10_lihtc_project_dollars)) +
        geom_point() +
        geom_smooth(method="lm") +
        scale_y_continuous(labels = scales::dollar_format())
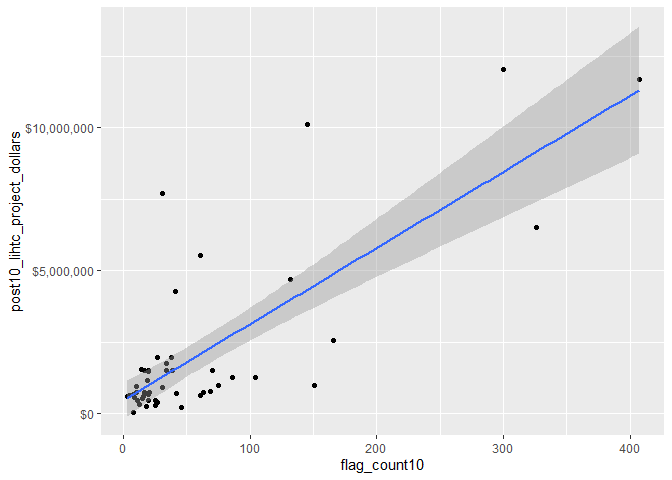
# Pearson's r calculation
cor(svi_divisional_county_lihtc_projects$flag_count10, svi_divisional_county_lihtc_projects$post10_lihtc_project_dollars, method = "pearson")
## [1] 0.7792099
boxplot(svi_divisional_county_lihtc_projects$flag_count10)
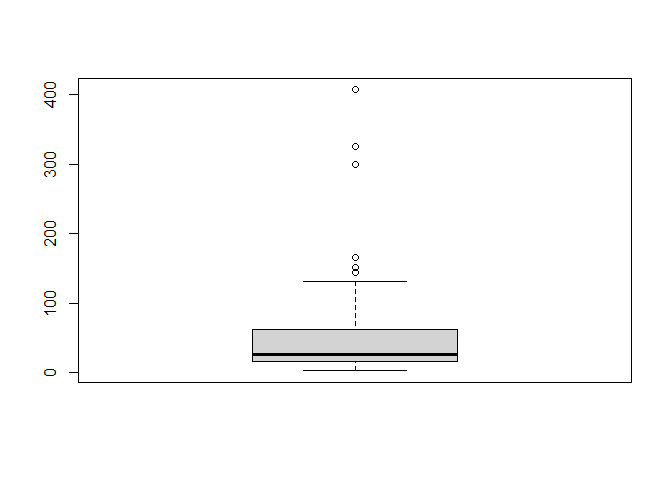
Once again, our Pearson’s R Calculation suggests a fairly strong correlation. However, a vizual representation of our data does confirm that outliers may be impacting this.
svi_divisional_lihtc_cluster <- svi_divisional_county_lihtc_projects %>%
                            select(county_name, post10_lihtc_project_dollars,
                                   flag_count10) %>%
                            remove_rownames %>%
                            column_to_rownames(var="county_name")

# Remove nulls, if in dataset
svi_divisional_lihtc_cluster <- na.omit(svi_divisional_lihtc_cluster)


# Scale numeric variables
svi_divisional_lihtc_cluster <- scale(svi_divisional_lihtc_cluster)


svi_divisional_lihtc_cluster %>% head(5)
##                          post10_lihtc_project_dollars flag_count10
## District of Columbia, DC                    3.3855306    4.1691145
## Broward County, FL                          0.1831488    1.2810530
## Duval County, FL                           -0.2637197    0.5380662
## Escambia County, FL                        -0.1853096    0.1306219
## Hillsborough County, FL                     2.8320293    1.0293962
set.seed(123)
k2_lihtc_div <- kmeans(svi_divisional_lihtc_cluster, centers = 2, nstart = 25)
set.seed(123)
k3_lihtc_div <- kmeans(svi_divisional_lihtc_cluster, centers = 3, nstart = 25)
set.seed(123)
k4_lihtc_div <- kmeans(svi_divisional_lihtc_cluster, centers = 4, nstart = 25)
set.seed(123)
k5_lihtc_div <- kmeans(svi_divisional_lihtc_cluster, centers = 5, nstart = 25)
# plots to compare
p_k2_lihtc_div <- factoextra::fviz_cluster(k2_lihtc_div, geom = "point", data = svi_divisional_lihtc_cluster) + ggtitle("k = 2")

p_k3_lihtc_div <- factoextra::fviz_cluster(k3_lihtc_div, geom = "point", data = svi_divisional_lihtc_cluster) + ggtitle("k = 3")

p_k4_lihtc_div <- factoextra::fviz_cluster(k4_lihtc_div, geom = "point",  data = svi_divisional_lihtc_cluster) + ggtitle("k = 4")

p_k5_lihtc_div <- factoextra::fviz_cluster(k5_lihtc_div, geom = "point",  data = svi_divisional_lihtc_cluster) + ggtitle("k = 5")

grid.arrange(p_k2_lihtc_div, p_k3_lihtc_div, p_k4_lihtc_div, p_k5_lihtc_div, nrow = 2)
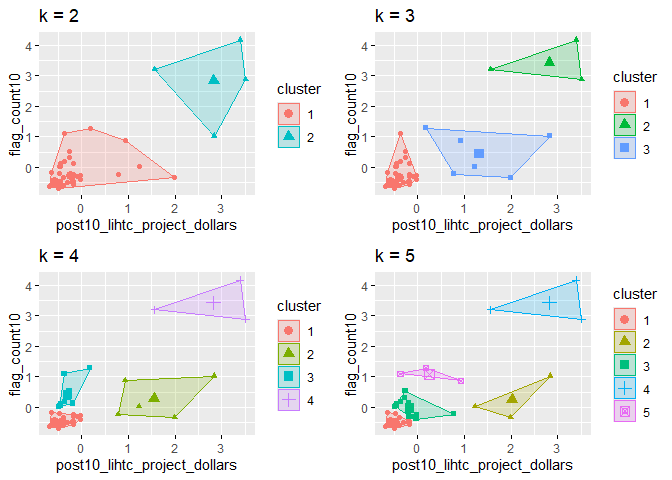
elbow_plot(svi_divisional_lihtc_cluster)
##  [1]  1  2  3  4  5  6  7  8  9 10 11 12 13 14 15
## [1] 1
## [1] 2
## [1] 3
## [1] 4
## [1] 5
## [1] 6
## [1] 7
## [1] 8
## [1] 9
## [1] 10
## [1] 11
## [1] 12
## [1] 13
## [1] 14
## [1] 15
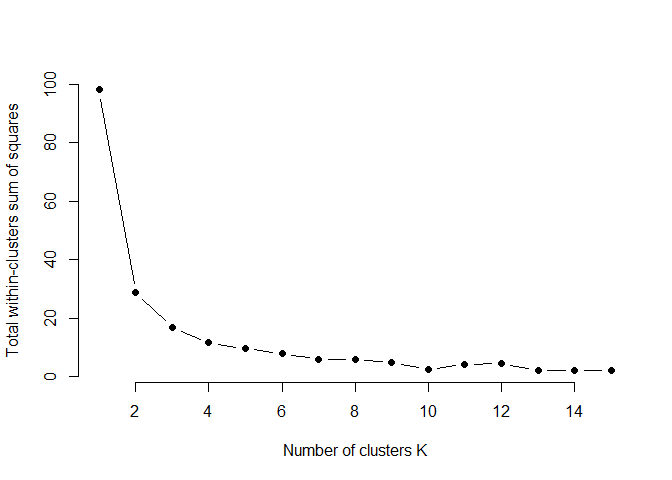
p_k3_lihtc_div <- factoextra::fviz_cluster(k3_lihtc_div, geom = "point", data = svi_divisional_lihtc_cluster) + ggtitle("k = 3")

p_k3_lihtc_div
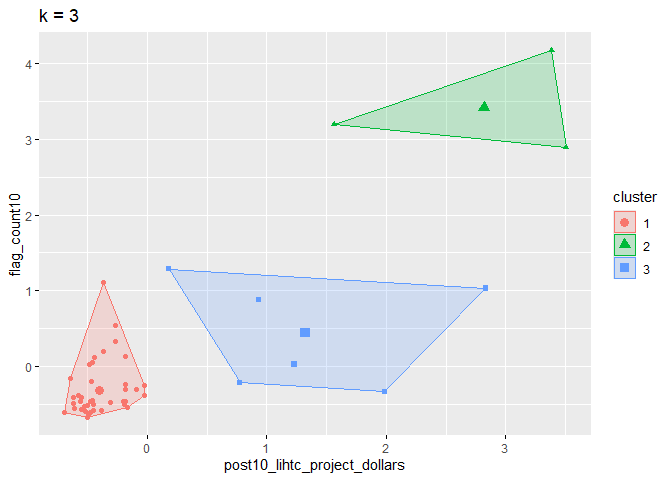
Once again, it appears that our data would be better represented as three clusters.
svi_divisional_lihtc_cluster_label <- as.data.frame(svi_divisional_lihtc_cluster) %>%
                                  rownames_to_column(var = "county_name") %>%
                                  as_tibble() %>%
                                  mutate(cluster = k3_lihtc_div$cluster) %>%
                                  select(county_name, cluster)

svi_divisional_county_lihtc_projects2 <- left_join(svi_divisional_county_lihtc_projects, svi_divisional_lihtc_cluster_label, join_by(county_name == county_name))

# View county counts in each cluster
table(svi_divisional_county_lihtc_projects2$cluster)
##
##  1  2  3
## 41  3  6
# Cluster 1 Scatterplot
# y is our independent variable (LIHTC Project Dollars),
# x is our dependent variable (SVI flag count)

svi_divisional_county_lihtc_projects2 %>%
  filter(cluster == 1) %>%
  ggplot2::ggplot(aes(x=flag_count10,
                    y=post10_lihtc_project_dollars)) +
        geom_point() +
        geom_smooth(method="lm") +
        scale_y_continuous(labels = scales::dollar_format())
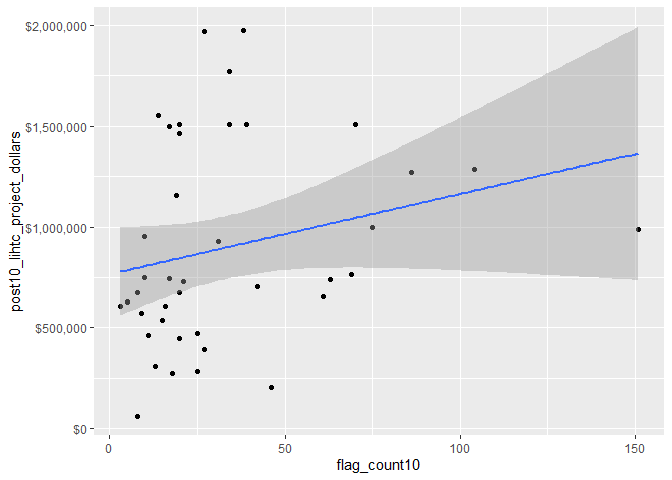
svi_divisional_county_lihtc_projects2 %>%
  filter(cluster == 1) %>%
  select(flag_count10,post10_lihtc_project_dollars) %>%
  cor(method = "pearson")
##                              flag_count10 post10_lihtc_project_dollars
## flag_count10                    1.0000000                    0.2414151
## post10_lihtc_project_dollars    0.2414151                    1.0000000
Looking at our first and largest cluster, we can see that there is no strong correlation between the amount of flags and the amount of money spent.
# Cluster 2 Scatterplot
# y is our independent variable (LIHTC Project Dollars),
# x is our dependent variable (SVI flag count)

svi_divisional_county_lihtc_projects2 %>%
  filter(cluster == 2) %>%
  ggplot2::ggplot(aes(x=flag_count10,
                    y=post10_lihtc_project_dollars)) +
        geom_point() +
        geom_smooth(method="lm") +
        scale_y_continuous(labels = scales::dollar_format())
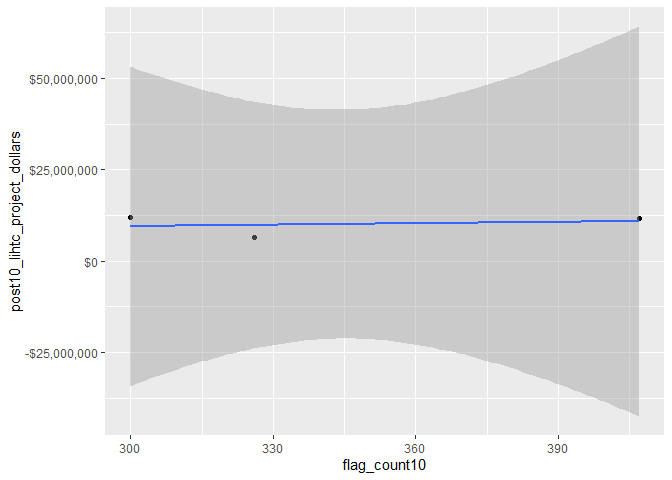
svi_divisional_county_lihtc_projects2 %>%
  filter(cluster == 2) %>%
  select(flag_count10,post10_lihtc_project_dollars) %>%
  cor(method = "pearson")
##                              flag_count10 post10_lihtc_project_dollars
## flag_count10                    1.0000000                    0.2309379
## post10_lihtc_project_dollars    0.2309379                    1.0000000
Our number 2 cluster, which contains our largest outliers, confims this as well.
# Cluster 3 Scatterplot
# y is our independent variable (LIHTC Project Dollars),
# x is our dependent variable (SVI flag count)

svi_divisional_county_lihtc_projects2 %>%
  filter(cluster == 3) %>%
  ggplot2::ggplot(aes(x=flag_count10,
                    y=post10_lihtc_project_dollars)) +
        geom_point() +
        geom_smooth(method="lm") +
        scale_y_continuous(labels = scales::dollar_format())
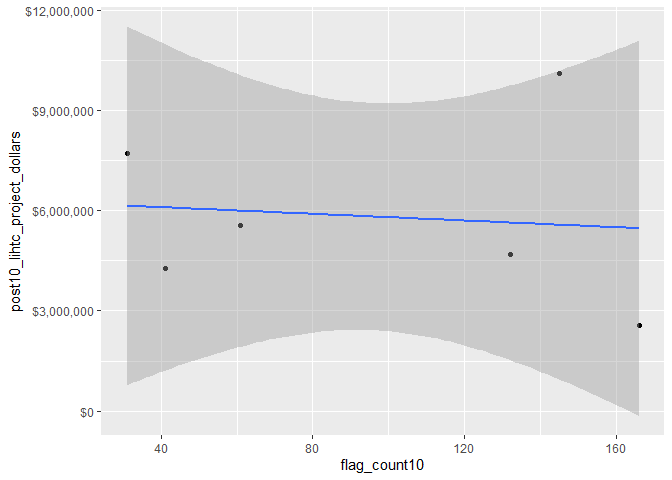
svi_divisional_county_lihtc_projects2 %>%
  filter(cluster == 3) %>%
  select(flag_count10,post10_lihtc_project_dollars) %>%
  cor(method = "pearson")
##                              flag_count10 post10_lihtc_project_dollars
## flag_count10                    1.0000000                   -0.1082347
## post10_lihtc_project_dollars   -0.1082347                    1.0000000
Finally, our number three cluster shows a slight negative correlation, also confirming that there is not a strong relationship between the amount of money spent and the amount of flags.
# Join our LIHTC projects data with our shapefile geocoordinates
svi_divisional_county_lihtc_sf <- left_join(svi_divisional_county_lihtc_projects, divisional_county_sf, join_by("FIPS_st" == "STATEFP", "FIPS_county" == "COUNTYFP"))

svi_divisional_county_lihtc_sf %>% head(5) %>% kbl() %>% kable_styling() %>% scroll_box(width = "100%")
| State | County | Division | post10_lihtc_project_cnt | tract_cnt | post10_lihtc_project_dollars | post10_lihtc_dollars_formatted | fips_county_st | FIPS_st | FIPS_county | state_name | region_number | region | division_number | flag_count10 | pop10 | flag_by_pop10 | flag_count_quantile10 | flag_pop_quantile10 | flag_count20 | pop20 | flag_by_pop20 | flag_count_quantile20 | flag_pop_quantile20 | county_name | geometry |
|---|---|---|---|---|---|---|---|---|---|---|---|---|---|---|---|---|---|---|---|---|---|---|---|---|---|
| DC | District of Columbia | South Atlantic Division | 21 | 53 | 11695555 | \$11,695,555 | 11001 | 11 | 001 | District of Columbia | 3 | South Region | 5 | 407 | 157923 | 0.0025772 | 1 | 0.6 | 387 | 192201 | 0.0020135 | 1 | 0.4 | District of Columbia, DC | MULTIPOLYGON (((-76.95772 3… |
| FL | Broward County | South Atlantic Division | 3 | 17 | 2561000 | \$2,561,000 | 12011 | 12 | 011 | Florida | 3 | South Region | 5 | 166 | 71933 | 0.0023077 | 1 | 0.6 | 160 | 84636 | 0.0018904 | 1 | 0.4 | Broward County, FL | MULTIPOLYGON (((-80.08484 2… |
| FL | Duval County | South Atlantic Division | 4 | 12 | 1286341 | \$1,286,341 | 12031 | 12 | 031 | Florida | 3 | South Region | 5 | 104 | 40471 | 0.0025697 | 1 | 0.6 | 90 | 40771 | 0.0022075 | 1 | 0.6 | Duval County, FL | MULTIPOLYGON (((-81.39745 3… |
| FL | Escambia County | South Atlantic Division | 1 | 9 | 1510000 | \$1,510,000 | 12033 | 12 | 033 | Florida | 3 | South Region | 5 | 70 | 30376 | 0.0023045 | 1 | 0.6 | 64 | 26675 | 0.0023993 | 1 | 0.6 | Escambia County, FL | MULTIPOLYGON (((-87.54197 3… |
| FL | Hillsborough County | South Atlantic Division | 7 | 17 | 10116734 | \$10,116,734 | 12057 | 12 | 057 | Florida | 3 | South Region | 5 | 145 | 42317 | 0.0034265 | 1 | 0.8 | 149 | 50266 | 0.0029642 | 1 | 0.8 | Hillsborough County, FL | MULTIPOLYGON (((-82.75593 2… |
# Create classes for bivariate mapping
svi_divisional_county_lihtc_sf <- bi_class(svi_divisional_county_lihtc_sf, x = flag_count10, y = post10_lihtc_project_dollars, style = "quantile", dim = 3)

# View data
svi_divisional_county_lihtc_sf %>% head(5) %>% kbl() %>% kable_styling() %>% scroll_box(width = "100%")
| State | County | Division | post10_lihtc_project_cnt | tract_cnt | post10_lihtc_project_dollars | post10_lihtc_dollars_formatted | fips_county_st | FIPS_st | FIPS_county | state_name | region_number | region | division_number | flag_count10 | pop10 | flag_by_pop10 | flag_count_quantile10 | flag_pop_quantile10 | flag_count20 | pop20 | flag_by_pop20 | flag_count_quantile20 | flag_pop_quantile20 | county_name | geometry | bi_class |
|---|---|---|---|---|---|---|---|---|---|---|---|---|---|---|---|---|---|---|---|---|---|---|---|---|---|---|
| DC | District of Columbia | South Atlantic Division | 21 | 53 | 11695555 | \$11,695,555 | 11001 | 11 | 001 | District of Columbia | 3 | South Region | 5 | 407 | 157923 | 0.0025772 | 1 | 0.6 | 387 | 192201 | 0.0020135 | 1 | 0.4 | District of Columbia, DC | MULTIPOLYGON (((-76.95772 3… | 3-3 |
| FL | Broward County | South Atlantic Division | 3 | 17 | 2561000 | \$2,561,000 | 12011 | 12 | 011 | Florida | 3 | South Region | 5 | 166 | 71933 | 0.0023077 | 1 | 0.6 | 160 | 84636 | 0.0018904 | 1 | 0.4 | Broward County, FL | MULTIPOLYGON (((-80.08484 2… | 3-3 |
| FL | Duval County | South Atlantic Division | 4 | 12 | 1286341 | \$1,286,341 | 12031 | 12 | 031 | Florida | 3 | South Region | 5 | 104 | 40471 | 0.0025697 | 1 | 0.6 | 90 | 40771 | 0.0022075 | 1 | 0.6 | Duval County, FL | MULTIPOLYGON (((-81.39745 3… | 3-2 |
| FL | Escambia County | South Atlantic Division | 1 | 9 | 1510000 | \$1,510,000 | 12033 | 12 | 033 | Florida | 3 | South Region | 5 | 70 | 30376 | 0.0023045 | 1 | 0.6 | 64 | 26675 | 0.0023993 | 1 | 0.6 | Escambia County, FL | MULTIPOLYGON (((-87.54197 3… | 3-3 |
| FL | Hillsborough County | South Atlantic Division | 7 | 17 | 10116734 | \$10,116,734 | 12057 | 12 | 057 | Florida | 3 | South Region | 5 | 145 | 42317 | 0.0034265 | 1 | 0.8 | 149 | 50266 | 0.0029642 | 1 | 0.8 | Hillsborough County, FL | MULTIPOLYGON (((-82.75593 2… | 3-3 |
# Create map with ggplot
svi_divisional_county_lihtc_map <- ggplot() +
  # Map county shapefile, fill with bi_class categories
  geom_sf(data = svi_divisional_county_lihtc_sf, mapping = aes(geometry=geometry, fill = bi_class), color = "white", size = 0.1, show.legend = FALSE) +
  # Set to biscale palette
  bi_scale_fill(pal = "GrPink", dim = 3) +
  # Add state shapefiles for outline
  geom_sf(data=divisional_st_sf, color="black", fill=NA, linewidth=.5, aes(geometry=geometry)) +
  labs(
    title = paste0("Correlation of 2010 ", census_division, " SVI Flag Count \n and 2011 - 2020 LIHTC Tax Dollars")
  ) +
  # Set them to biscale
  bi_theme(base_size = 10)

# Create biscale legend
svi_divisional_county_lihtc_legend <- bi_legend(pal = "GrPink",
                    dim = 3,
                    xlab = "SVI Flag Count",
                    ylab = "LIHTC Dollars",
                    size = 8)

# Combine map with legend using cowplot
svi_divisional_county_lihtc_bivarmap <- ggdraw() +
  draw_plot(svi_divisional_county_lihtc_map) +
  # Set legend location
  draw_plot(svi_divisional_county_lihtc_legend, x= -.02,  y = -.05,
 width=.20)


# View map
svi_divisional_county_lihtc_bivarmap
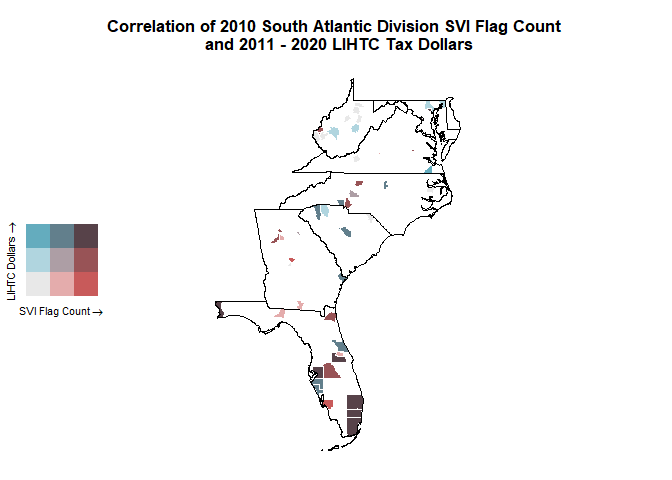
It appears that this time, the majority of high flags are still in Florida; there is no significant impact on the map in our other states, though there is a slight increase in spending without high flag counts above North Carolina.
svi_divisional_county_lihtc_sf %>% filter(State == "FL") %>% select(State, County, flag_count10, post10_lihtc_dollars_formatted) %>% arrange(desc(flag_count10)) %>% head(6)
##   State              County flag_count10 post10_lihtc_dollars_formatted
## 1    FL   Miami-Dade County          300                    $12,039,478
## 2    FL      Broward County          166                     $2,561,000
## 3    FL Hillsborough County          145                    $10,116,734
## 4    FL   Palm Beach County          132                     $4,702,545
## 5    FL        Duval County          104                     $1,286,341
## 6    FL         Polk County           86                     $1,271,000
saveRDS(svi_divisional_lihtc, file = here::here(paste0("data/wrangling/", str_replace_all(census_division, " ", "_"), "_svi_divisional_lihtc.rds")))

saveRDS(svi_national_lihtc, file = here::here(paste0("data/wrangling/", str_replace_all(census_division, " ", "_"), "_svi_national_lihtc.rds")))

saveRDS(svi_divisional_nmtc, file = here::here(paste0("data/wrangling/", str_replace_all(census_division, " ", "_"), "_svi_divisional_nmtc.rds")))

saveRDS(svi_national_nmtc, file = here::here(paste0("data/wrangling/", str_replace_all(census_division, " ", "_"), "_svi_national_nmtc.rds")))
</div>